Chiến lược đảo ngược xu hướng Fibonacci
Tác giả:ChaoZhang, Ngày: 2024-04-28 14:05:45Tags:ATRTSOTRMA
Tổng quan
Chiến lược đảo ngược xu hướng Fibonacci là một chiến lược giao dịch sử dụng các mức khôi phục Fibonacci và chỉ số Tăng cường xu hướng theo thời gian (TSOT) để nắm bắt các điểm đảo ngược xu hướng tiềm năng trên thị trường. Chiến lược thực hiện lệnh dừng lỗ ATR năng động và lấy lợi nhuận một phần để quản lý rủi ro và tối đa hóa lợi nhuận. Nó được tối ưu hóa cho việc vỏ đầu (5 phút khung thời gian) trong thị trường mở rộng.
Nguyên tắc chiến lược
Chiến lược sử dụng các mức khôi phục Fibonacci (0.236, 0.5, và 0.786) để xác định các điểm đảo ngược xu hướng tiềm năng. Ngoài ra, chỉ số TSOT đo cường độ xu hướng bằng cách sử dụng bảng xếp hạng phần trăm của hành động giá. Khi giá vượt qua mức trung bình Fibonacci (0.5) với tín hiệu TSOT tăng / giảm, chiến lược đi vào vị trí dài / ngắn. Mức dừng lỗ được tính năng động bằng cách sử dụng ATR, trong khi mức lợi nhuận được đặt dựa trên tỷ lệ lợi nhuận và rủi ro-lợi nhuận một phần. Hơn nữa, chiến lược cho phép đảo ngược vị trí dựa trên các tín hiệu TSOT mới.
Ưu điểm chiến lược
- Bằng cách kết hợp Fibonacci retracements với chỉ số sức mạnh xu hướng, chiến lược có thể xác định chính xác hơn các điểm đảo ngược xu hướng.
- ATR động dừng lỗ điều chỉnh theo biến động thị trường hiện tại, đảm bảo quản lý rủi ro hiệu quả.
- Các thiết lập lợi nhuận một phần cho phép lợi nhuận kịp thời khi các mục tiêu đạt được trong khi cho phép lợi nhuận tiếp tục chạy.
- Khả năng đảo ngược các vị trí dựa trên các tín hiệu mới làm tăng khả năng thích nghi và linh hoạt của chiến lược.
Rủi ro chiến lược
- Trong thị trường bất ổn hoặc các điều kiện xu hướng không rõ ràng, các tín hiệu đảo ngược thường xuyên có thể dẫn đến giao dịch quá mức và thua lỗ.
- Mặc dù dừng lỗ năng động và lợi nhuận một phần giúp kiểm soát rủi ro, nhưng có thể vẫn có sự rút ngắn đáng kể trong điều kiện thị trường cực đoan.
- Việc lựa chọn các thông số chiến lược (ví dụ: mức Fibonacci, tính toán TSOT) đòi hỏi tối ưu hóa cho các thị trường và khung thời gian khác nhau; các thông số không phù hợp có thể ảnh hưởng đến hiệu suất chiến lược.
Hướng dẫn tối ưu hóa chiến lược
- Thêm các tín hiệu xác nhận bổ sung (ví dụ: chỉ số âm lượng, động lượng) để lọc các tín hiệu sai và cải thiện độ chính xác nhập.
- Tối ưu hóa logic lấy lợi nhuận và dừng lỗ, chẳng hạn như điều chỉnh năng động các mục tiêu lấy lợi nhuận dựa trên sức mạnh của xu hướng hoặc thực hiện dừng lỗ.
- Đối với các kịch bản đảo ngược thường xuyên, hãy xem xét việc đặt giới hạn số lần đảo ngược hoặc đưa ra các điều kiện lọc đảo ngược để giảm quá mức giao dịch.
- Thực hiện tối ưu hóa và thử nghiệm kỹ lưỡng các tham số chiến lược phù hợp với các đặc điểm thị trường và các công cụ giao dịch cụ thể.
Tóm lại
Chiến lược đảo ngược xu hướng Fibonacci có hiệu quả nắm bắt các điểm đảo ngược xu hướng bằng cách kết hợp các mức khôi phục Fibonacci với chỉ số TSOT, trong khi quản lý các mục tiêu rủi ro và lợi nhuận thông qua việc dừng lỗ và lợi nhuận một phần. Chiến lược hoạt động tốt trên các thị trường có xu hướng rõ ràng nhưng đòi hỏi sự thận trọng trong điều kiện hỗn loạn.
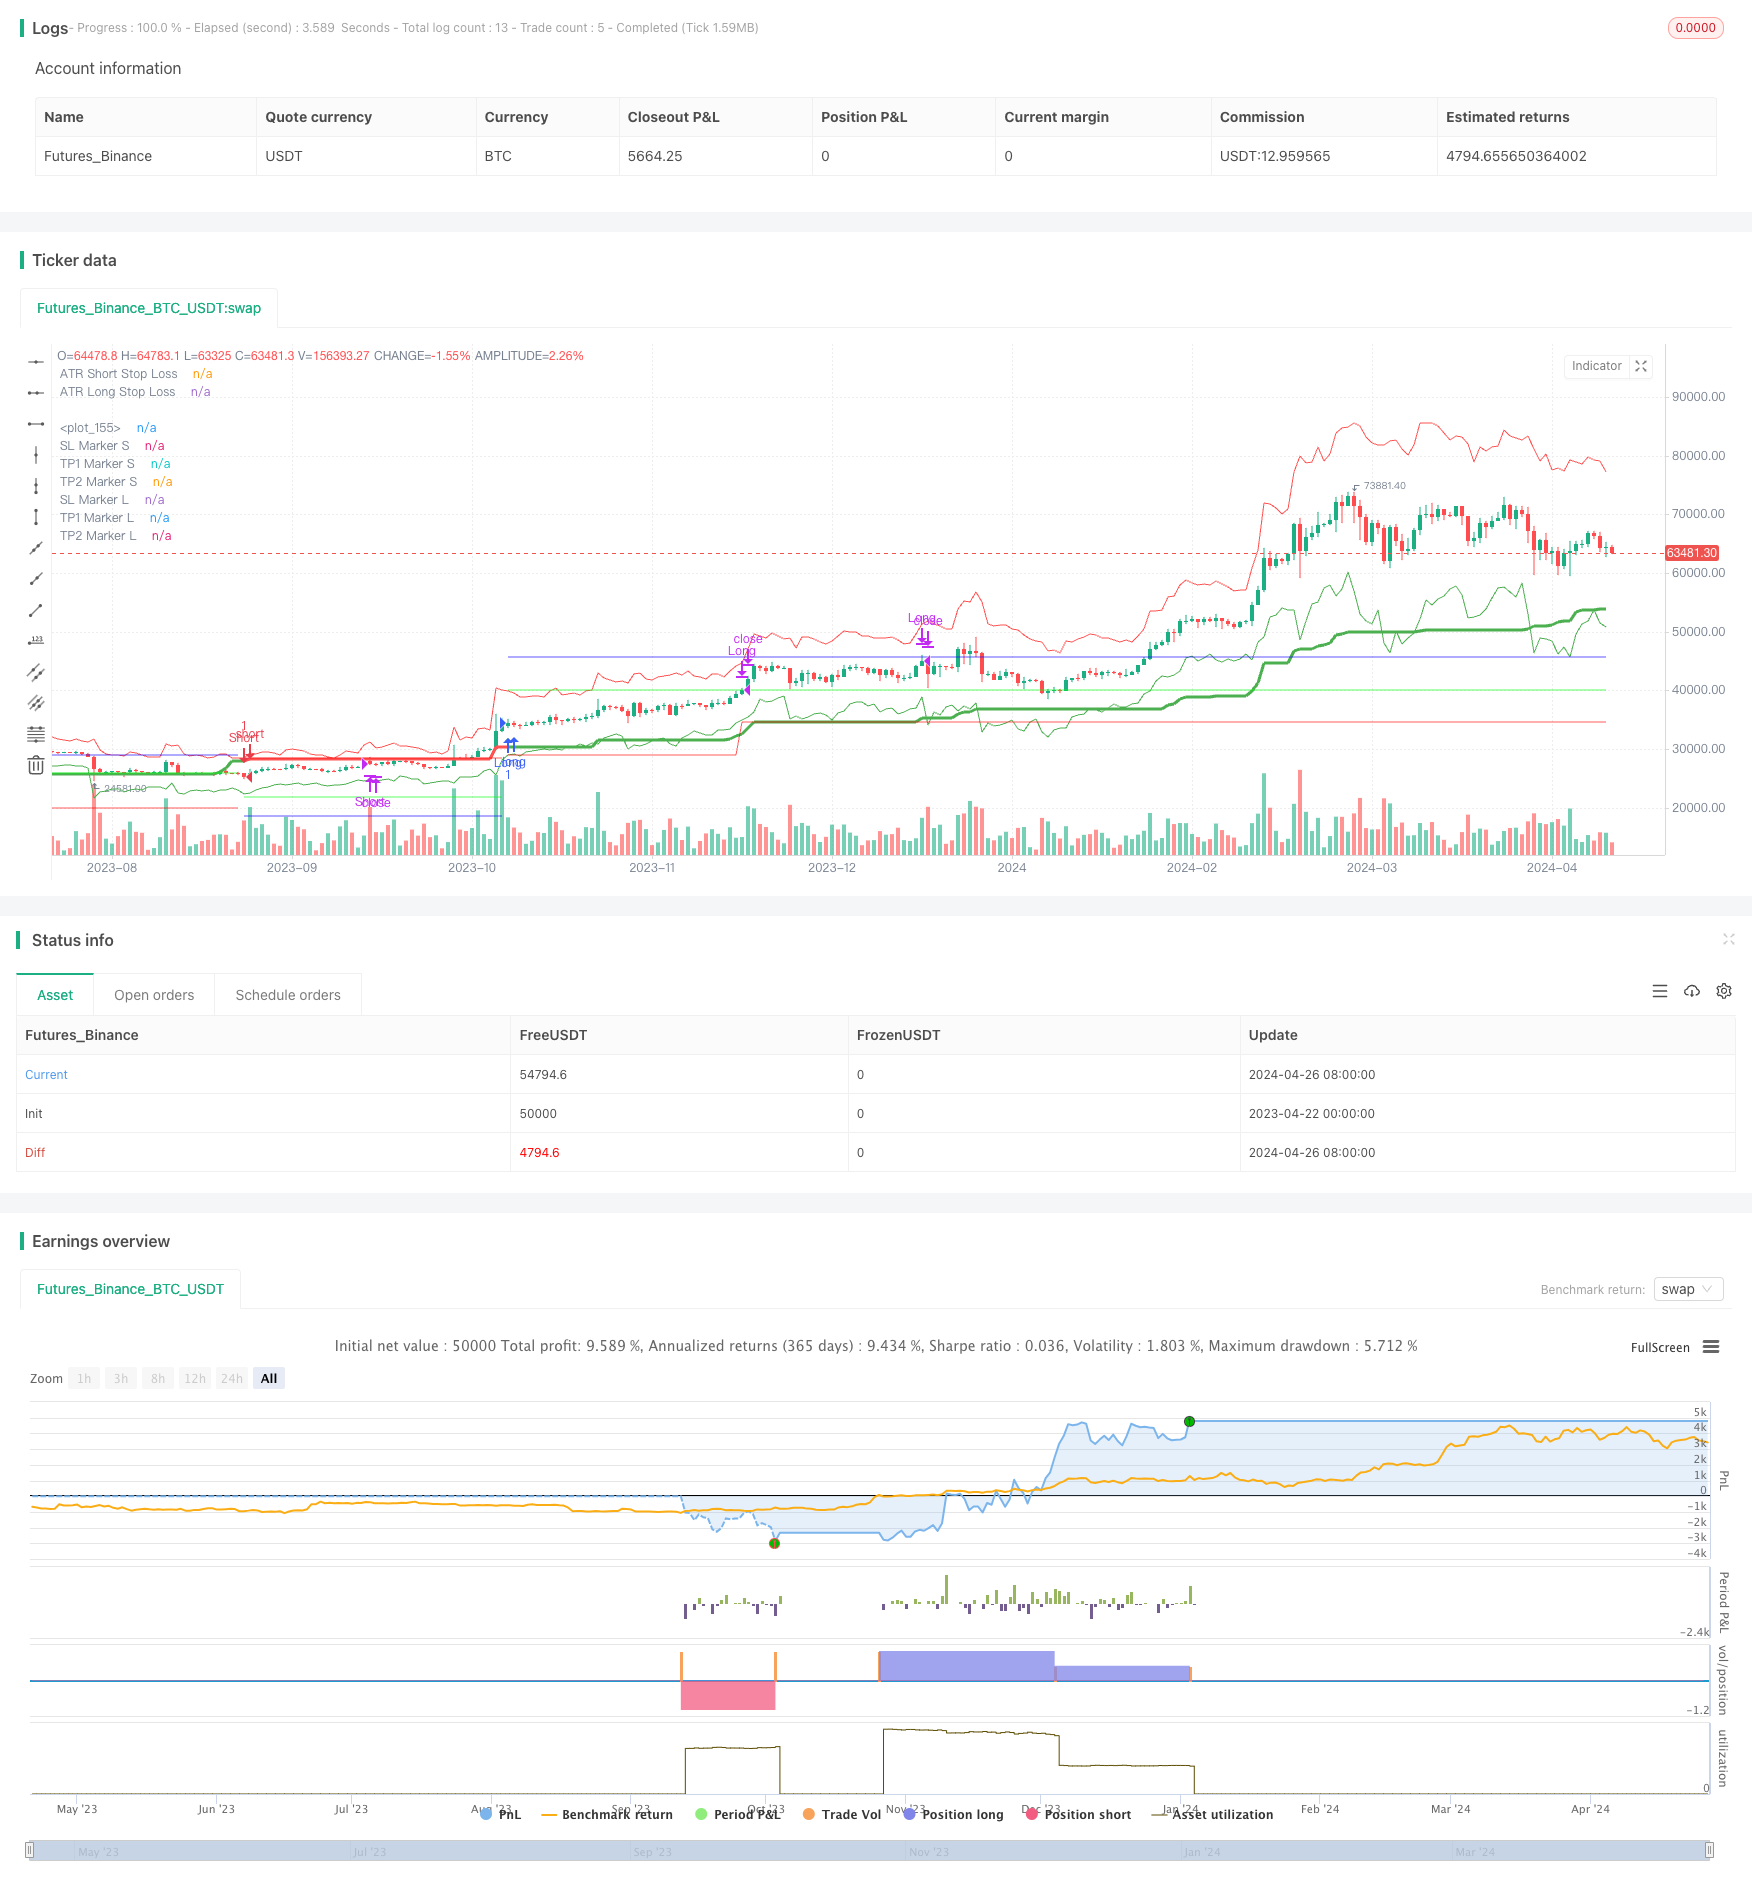
/*backtest
start: 2023-04-22 00:00:00
end: 2024-04-27 00:00:00
period: 1d
basePeriod: 1h
exchanges: [{"eid":"Futures_Binance","currency":"BTC_USDT"}]
*/

// This Pine Script™ code is subject to the terms of the Mozilla Public License 2.0 at https://mozilla.org/MPL/2.0/
// © nioboi

//@version=5
strategy("Fibonacci Trend Reversals", overlay=true, process_orders_on_close = true, commission_value = 0.055, initial_capital = 1000)

// =========================================
// Input Groups
// =========================================
string rsi_group = "RSI"
string main_group = "Fib Sensitivity"
string atr_sl_finder_group = "ATR SL Finder"
string trade_execution_group = "Strategy Execution"

// =========================================
// Fibonacci Retracement Trend Reversal
// =========================================
sensitivity_input = input.float(title = 'Sensitive', step = 0.1, defval = 18, group = main_group)
var bool is_long_trend_started = false
var bool is_short_trend_started = false
var bool is_trend_change = na
var bool is_long_trend = false
var bool is_short_trend = false
var bool can_long = false
var bool can_short = false

sensitivity = sensitivity_input
sensitivity *= 10

high_line = ta.highest(high, int(sensitivity))
low_line = ta.lowest(low, int(sensitivity))
channel_range = high_line - low_line
fib_236 = high_line - channel_range * (0.236)
fib_5 = high_line - channel_range * 0.5
fib_786 = high_line - channel_range * (0.786)
imba_trend_line = fib_5

// =========================================
// TSOT | Trend Strength Over Time
// =========================================

// Calculate 75th percentile of price for each length
percentile_13H = ta.percentile_nearest_rank(high, 13, 75)
percentile_21H = ta.percentile_nearest_rank(high, 21, 75)
percentile_34H = ta.percentile_nearest_rank(high, 34, 75)
percentile_55H = ta.percentile_nearest_rank(high, 55, 75)
percentile_89H = ta.percentile_nearest_rank(high, 89, 75)

// Calculate 25th percentile of  price for each length
percentile_13L =  ta.percentile_nearest_rank(low, 13, 25)
percentile_21L =  ta.percentile_nearest_rank(low, 21, 25)
percentile_34L =  ta.percentile_nearest_rank(low, 34, 25)
percentile_55L = ta.percentile_nearest_rank(low, 55, 25)
percentile_89L = ta.percentile_nearest_rank(low, 89, 25)

// Calculate 75th and 25th for length 144 (longest length)
highest_high = ta.percentile_nearest_rank(high, 144, 75)
lowest_low = ta.percentile_nearest_rank(low, 144, 25)

// Calculate trend strength conditions
trendBull1 = percentile_13H > highest_high
trendBull2 = percentile_21H > highest_high
trendBull3 = percentile_34H > highest_high
trendBull4 = percentile_55H > highest_high
trendBull5 = percentile_89H > highest_high
trendBull6 = percentile_13L > highest_high
trendBull7 = percentile_21L > highest_high
trendBull8 = percentile_34L > highest_high
trendBull9 = percentile_55L > highest_high
trendBull10 = percentile_89L > highest_high

trendBear1 = percentile_13H < lowest_low
trendBear2 = percentile_21H < lowest_low
trendBear3 = percentile_34H < lowest_low
trendBear4 = percentile_55H < lowest_low
trendBear5 = percentile_89H < lowest_low
trendBear6 = percentile_13L < lowest_low
trendBear7 = percentile_21L < lowest_low
trendBear8 = percentile_34L < lowest_low
trendBear9 = percentile_55L < lowest_low
trendBear10 = percentile_89L < lowest_low

countBull =
     (trendBull1 ? 1 : 0) +
     (trendBull2 ? 1 : 0) +
     (trendBull3 ? 1 : 0) +
     (trendBull4 ? 1 : 0) +
     (trendBull5 ? 1 : 0) +
     (trendBull6 ? 1 : 0) +
     (trendBull7 ? 1 : 0) +
     (trendBull8 ? 1 : 0) +
     (trendBull9 ? 1 : 0) +
     (trendBull10 ? 1 : 0)

countBear =
     (trendBear1 ? 1 : 0) +
     (trendBear2 ? 1 : 0) +
     (trendBear3 ? 1 : 0) +
     (trendBear4 ? 1 : 0) +
     (trendBear5 ? 1 : 0) +
     (trendBear6 ? 1 : 0) +
     (trendBear7 ? 1 : 0) +
     (trendBear8 ? 1 : 0) +
     (trendBear9 ? 1 : 0) +
     (trendBear10 ? 1 : 0)

// Calculate weak bull count
weakBullCount =
     (percentile_13L < highest_high and percentile_13L > lowest_low ? 1 : 0) +
     (percentile_21L < highest_high and percentile_21L > lowest_low ? 1 : 0) +
     (percentile_34L < highest_high and percentile_34L > lowest_low ? 1 : 0) +
     (percentile_55L < highest_high and percentile_55L > lowest_low ? 1 : 0) +
     (percentile_89L < highest_high and percentile_89L > lowest_low ? 1 : 0)

// Calculate weak bear count
weakBearCount =
     (percentile_13H > lowest_low and percentile_13H < highest_high ? 1 : 0) +
     (percentile_21H > lowest_low and percentile_21H < highest_high ? 1 : 0) +
     (percentile_34H > lowest_low and percentile_34H < highest_high ? 1 : 0) +
     (percentile_55H > lowest_low and percentile_55H < highest_high ? 1 : 0) +
     (percentile_89H > lowest_low and percentile_89H < highest_high ? 1 : 0)

// Calculate bull strength and bear strength
bullStrength = 10 * (countBull + 0.5*weakBullCount - 0.5*weakBearCount - countBear)
bearStrength = 10 * (countBear + 0.5*weakBearCount - 0.5*weakBullCount - countBull)

// Calculate the current trend
currentTrendValue = bullStrength - bearStrength

tsot_bullish = currentTrendValue > 0
tsot_bearish = currentTrendValue < 0

// CAN LONG/SHORT
can_long := close >= imba_trend_line and close >= fib_236 and not is_long_trend and tsot_bullish
can_short := close <= imba_trend_line and close <= fib_786 and not is_short_trend and tsot_bearish

if can_long
    is_long_trend := true
    is_short_trend := false
    is_long_trend_started := is_long_trend_started ? false : true
else if can_short
    is_short_trend := true
    is_long_trend := false
    is_short_trend_started := is_short_trend_started ? false : true
else
    is_trend_change := false
    can_long := false
    can_short := false
    is_short_trend_started := false
    is_long_trend_started := false

is_trend_change := is_short_trend_started or is_long_trend_started
plotshape(is_long_trend and is_long_trend_started ? imba_trend_line : na, title="Long", style=shape.triangleup, location=location.belowbar, color=color.green, size=size.small)
plotshape(is_short_trend and is_short_trend_started ? imba_trend_line : na, title="Short", style=shape.triangledown, location=location.abovebar, color=color.red, size=size.small)
plot(imba_trend_line, color = is_long_trend[1] ? color.green : color.red, linewidth = 3)

// =========================================
// ATR SL Finder
// =========================================
atrlength = input.int(title='Length', defval=14, minval=1, group = atr_sl_finder_group)
smoothing = input.string(title='Smoothing', defval='RMA', options=['RMA', 'SMA', 'EMA', 'WMA'], group = atr_sl_finder_group)
m = input(3.5, 'Multiplier', group = atr_sl_finder_group)
src1 = high
src2 = low
ma_function(source, length) =>
    if smoothing == 'RMA'
        ta.rma(source, length)
    else
        if smoothing == 'SMA'
            ta.sma(source, length)
        else
            if smoothing == 'EMA'
                ta.ema(source, length)
            else
                ta.wma(source, length)

x = ma_function(ta.tr(true), atrlength) * m + src1 // SHORT SL
x2 = src2 - ma_function(ta.tr(true), atrlength) * m // LONG SL

p1 = plot(x, title="ATR Short Stop Loss", color=color.red)
p2 = plot(x2, title="ATR Long Stop Loss", color=color.green)

// =========================================
// Strategy Execution
// =========================================

tradeDirection = input.string("Both", "Trade Direction", ["Long Only", "Short Only", "Both"], group = trade_execution_group, tooltip = "Select if you want this strategy to run only Long or Only Short positions, or Both")

risk_reward_ratio = input.float(2, "Risk Reward Ratio", group = trade_execution_group)
partialTp = input.bool(true, "Use Partial Take Profit", tooltip = "Enable this if you want to exit 50% of your position when half point of your Risk Reward is reached.", group = trade_execution_group)
allowReversePosition = input.bool(true, "Allow Reversing of Position", tooltip = "Enable this if you want to reverse position when new opposite signal occurs", group = trade_execution_group)

// Long or Short Conditions
enterLong = can_long and (tradeDirection == "Long Only" or tradeDirection == "Both")
enterShort = can_short and (tradeDirection == "Short Only" or tradeDirection == "Both")

// Long Entry Variables
var bool plotMarkers_long = false
var bool firstTPHit_long = false
var float sl_long = na
var float breakEven_long = na
var float tp1_long = na
var float tp2_long = na
var float entryPrice_long = na
var bool inLongPosition = false

// Short Entry Variables
var bool plotMarkers_short = false
var bool firstTPHit_short = false
var float sl_short = na
var float breakEven_short = na
var float tp1_short = na
var float tp2_short = na
var float entryPrice_short = na
var bool inShortPosition = false


// Reversal Logic
if inLongPosition and can_short and allowReversePosition // in a long position and signal to enter short and havent yet hit first tp
    strategy.close("Long", "Reversing Long to Short") // close Long in preparation to enter short in the next few lines
    inLongPosition := false
else if inShortPosition and can_long and allowReversePosition // in a short position and signal to enter long and havent yet hit first tp
    strategy.close("Short", "Reversing Short to Long") // close Short in preparation to enter long in the next few lines
    inShortPosition := false

// Long Entries
if enterLong
    entryPrice_long := close
    sl_long := x2
    risk = entryPrice_long - sl_long
    tp1_long := entryPrice_long + ((risk_reward_ratio * risk) / 2)
    tp2_long := entryPrice_long + (risk_reward_ratio * risk)
    breakEven_long := entryPrice_long + (entryPrice_long * 0.002)
    strategy.entry("Long", strategy.long)
    if not partialTp
        strategy.exit("Exit Long", "Long", limit = tp2_long, stop = sl_long)
    firstTPHit_long := false
    inLongPosition := true

// Short Entries
if enterShort
    entryPrice_short := close
    sl_short := x
    risk = sl_short - entryPrice_short
    tp1_short := entryPrice_short - ((risk_reward_ratio * risk)/2)
    tp2_short := entryPrice_short - (risk_reward_ratio * risk)
    breakEven_short := entryPrice_short - (entryPrice_short * 0.002)
    strategy.entry("Short", strategy.short)
    if not partialTp
        strategy.exit("Exit Short", "Short", limit = tp2_short, stop = sl_short)
    firstTPHit_short := false
    inShortPosition := true

// Dynamic TP and exit strategy for Longs
if inLongPosition and partialTp // in long position and partial TP for exit strategy is enabled
    if high >= tp1_long and not firstTPHit_long // high of candle hit first TP of long, and not yet hit first TP before
        strategy.close("Long", "TP-1 Long", qty_percent = 50) // close 50% of our long position
        sl_long := breakEven_long
        firstTPHit_long := true // set the first TP checker flag to true
    else if high >= tp2_long and firstTPHit_long // already hit the first TP and we hit our 2nd tp
        strategy.close("Long", "TP-2 long") // close the remaining of the long position
        inLongPosition := false // not in long position anymore
    else if low <= sl_long and not firstTPHit_long // not yet hit first TP but hit our SL
        strategy.close("Long", "SL long") // close the entire long position
        inLongPosition := false // not in long position anymore
    else if low <= breakEven_long and firstTPHit_long // already hit first TP and retraced back to breakEven
        strategy.close("Long", "BE Long")
        inLongPosition := false // not in long position anymore

// Dynamic TP and exit strategy for Shorts
if inShortPosition and partialTp // in short position and partial TP for exit strategy is enabled
    if low <= tp1_short and not firstTPHit_short // low of candle hit first TP of short, and not yet hit first TP before
        strategy.close("Short", "TP-1 Short", qty_percent = 50) // close 50% of our short position
        firstTPHit_short := true // set the first TP checker flag to true
        sl_short := breakEven_short
    else if low <= tp2_short and firstTPHit_short // already hit the first TP and we hit our 2nd tp
        strategy.close("Short", "TP-2 Short") // close the remaining of the short position
        inShortPosition := false // not in short position anymore
    else if high >= sl_short and not firstTPHit_short // not yet hit first TP but hit our SL
        strategy.close("Short", "SL Short") // close the entire long position
        inShortPosition := false // not in long position anymore
    else if high >= breakEven_short and firstTPHit_short // already hit first TP and retraced back to breakEven
        strategy.close("Short", "BE Short")
        inShortPosition := false // not in long position anymore

// =========================================
// Entry Visuals
// =========================================

// Entry Visual Flags
if inLongPosition
    plotMarkers_long := true
    plotMarkers_short := false
else if inShortPosition
    plotMarkers_long := false
    plotMarkers_short := true

showEntryVisuals = input.bool(true, "Show Entry Visuals", group = trade_execution_group)
plot(plotMarkers_long and showEntryVisuals?sl_long:na, "SL Marker L", color = #ff0000a4, linewidth = 1, style = plot.style_linebr)
plot(plotMarkers_long and showEntryVisuals?tp1_long:na, "TP1 Marker L", color = #00ff08a8, linewidth = 1, style = plot.style_linebr)
plot(plotMarkers_long and showEntryVisuals?tp2_long:na, "TP2 Marker L", color = #1100ffa9, linewidth = 1, style = plot.style_linebr)
plot(plotMarkers_short and showEntryVisuals?sl_short:na, "SL Marker S", color = #ff0000a4, linewidth = 1, style = plot.style_linebr)
plot(plotMarkers_short and showEntryVisuals?tp1_short:na, "TP1 Marker S", color = #00ff08a8, linewidth = 1, style = plot.style_linebr)
plot(plotMarkers_short and showEntryVisuals?tp2_short:na, "TP2 Marker S", color = #1100ffa9, linewidth = 1, style = plot.style_linebr)
- SSL lai
- Super Scalper
- ESSMA
- SuperJump quay lại Bollinger Band
- Super Scalper - 5 phút 15 phút
- VAWSI và Chiến lược đảo ngược sự bền vững của xu hướng với hệ thống phân tích đa chỉ số tính toán chiều dài động
- Chiến lược giao dịch năng động siêu xu hướng nhiều giai đoạn
- Chiến lược hỗ trợ và kháng cự với hệ thống quản lý rủi ro năng động
- Tiến trình Fibonacci với các đoạn phá vỡ
- Máy xay
- Chiến lược giao dịch dài hạn kết hợp MACD và RSI
- DCA Dual Moving Average Turtle Trading Strategy (Chiến lược giao dịch trung bình chuyển động hai lần)
- Chiến lược giao dịch VWAP
- Chiến lược kết hợp nhiều chỉ số (CCI, DMI, MACD, ADX)
- RSI2 Chiến lược Trở lại trong ngày Tỷ lệ giành chiến thắng Backtest
- Hurst Các đường biên giới trong tương lai của chiến lược phân định
- Xu hướng theo chiến lược dựa trên tín hiệu chéo OBV và MA
- GBS TOP Bottom Chiến lược được xác nhận
- Xu hướng đa chỉ số theo chiến lược
- Squeeze Backtest Transformer v2.0
- Chiến lược HTF Zigzag Path
- WaveTrend Cross LazyBear Chiến lược
- CCI, DMI và MACD Chiến lược ngắn hạn lai
- Chiến lược giao dịch AlphaTradingBot
- Chiến lược tăng cường Vegas SuperTrend
- Chiến lược giao dịch định lượng dựa trên trung bình di chuyển Hull sửa đổi và Ichimoku Kinko Hyo
- Chiến lược đảo ngược xu hướng RSI
- Chiến lược giao dịch động lực chỉ số chéo stochastic
- RSI và chiến lược định lượng tín hiệu chéo EMA kép
- Lý thuyết sóng Elliott 4-9 Sóng xung phát hiện tự động Chiến lược giao dịch