ওভারভিউ
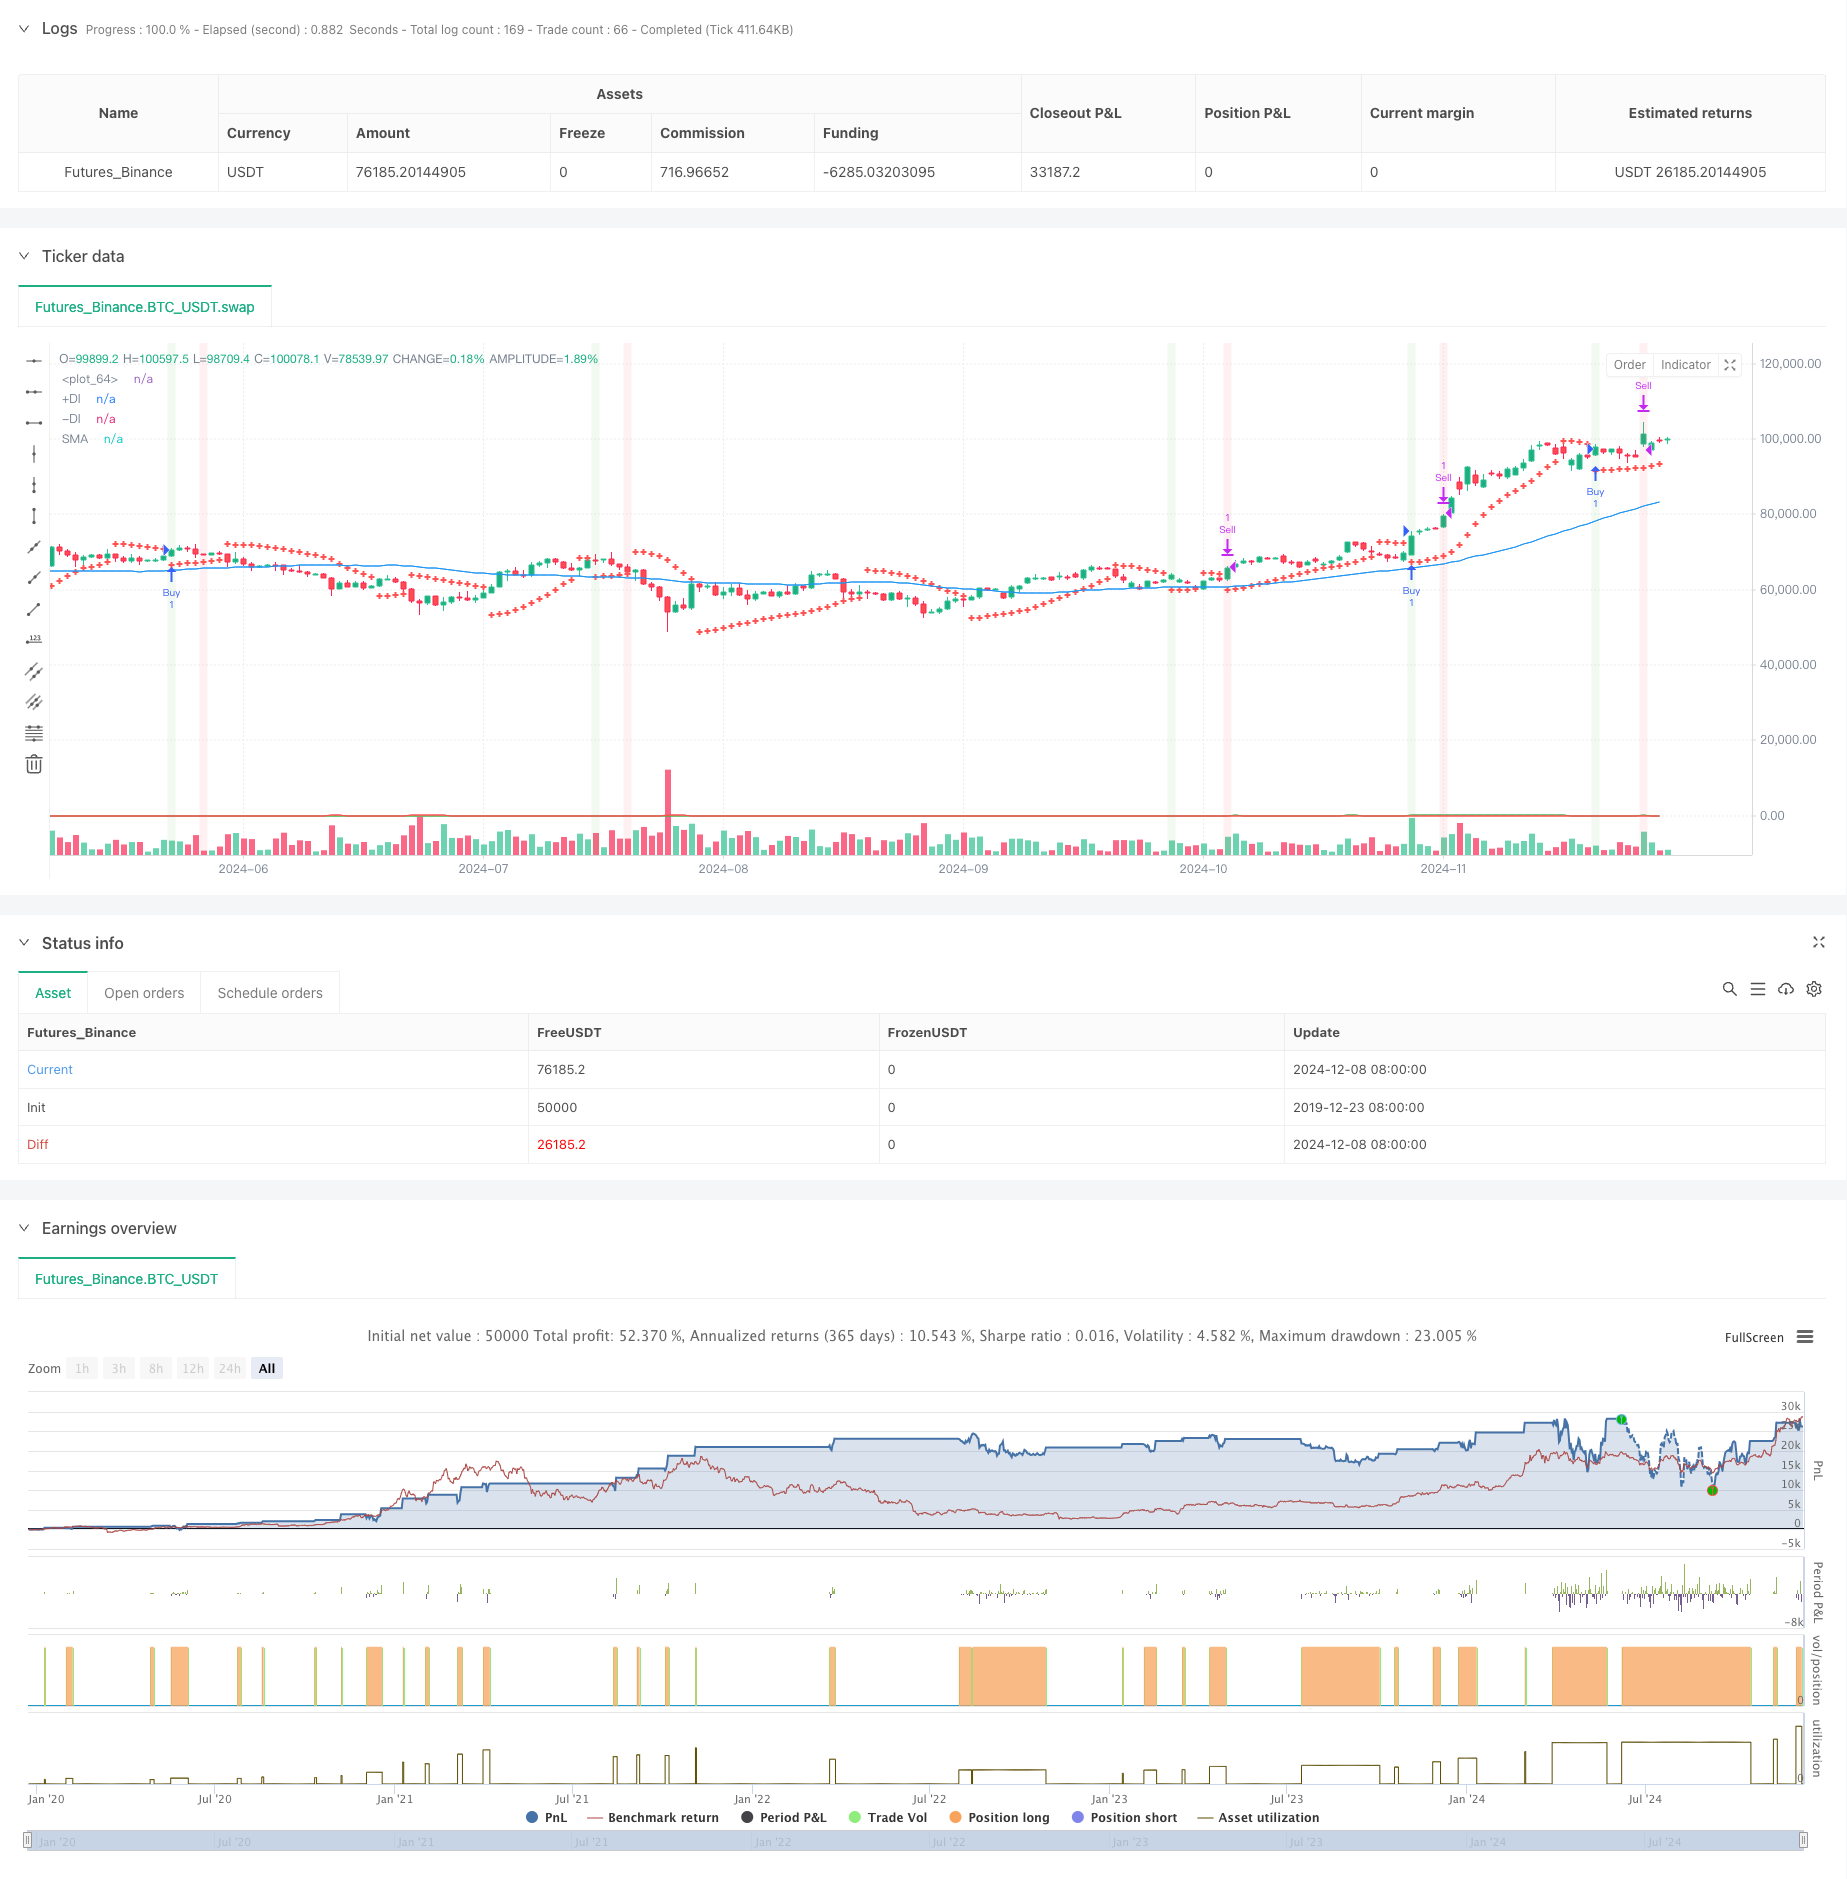
এই কৌশলটি একাধিক প্রযুক্তিগত সূচকের সমন্বয়ে একটি প্রবণতা ট্র্যাকিং ট্রেডিং সিস্টেম। এটি মূলত প্যারালাল লাইন ডাইভার্শন সূচক (SAR), মুভিং এভারেজ (SMA) এবং দিকনির্দেশক গতিশীলতা সূচক (DMI) ব্যবহার করে বাজার প্রবণতা এবং প্রবেশের সময় নির্ধারণ করে এবং শতাংশ স্টপ এবং MACD বিপরীতের মাধ্যমে প্রস্থানকে অনুকূল করে তোলে। কৌশলটির নকশার মূল ধারণাটি শক্তিশালী প্রবণতার পরে প্রবেশের বিষয়টি নিশ্চিত করা এবং নির্ধারিত মুনাফার লক্ষ্যে পৌঁছানোর সময় বা প্রবণতা পাল্টানোর সংকেত উপস্থিত হওয়ার সময় প্রস্থান করা।
কৌশল নীতি
ট্রেডিং সিগন্যাল নিশ্চিত করার জন্য কৌশলটি একাধিক স্তরের ফিল্টারিং পদ্ধতি ব্যবহার করেঃ
- প্রাথমিক ট্রেডিং সিগন্যাল ক্যাপচার করা হচ্ছে SAR সূচকগুলির ক্রস দ্বারা
- 50 পিরিয়ডের এসএমএ ব্যবহার করে সামগ্রিক প্রবণতা নির্দেশ করুন
- প্রবণতা শক্তি এবং দিকনির্দেশনা নিশ্চিত করার জন্য ডিএমআই সূচক ব্যবহার করুন
- প্রবেশের শর্তগুলি একই সাথে পূরণ করতে হবেঃ দাম SAR পরা, দাম SMA এর উপরে এবং DMI একটি বহু-মুখী প্রবণতা দেখায়
- দ্বৈত ব্যবস্থা গ্রহণ করাঃ লক্ষ্যমাত্রা 3% লাভ বা MACD ডেডফোর্ক সংকেত উপস্থিত
- ATR সূচকটি বাজারের অস্থিরতার জন্য ব্যবহৃত হয়
কৌশলগত সুবিধা
- মাল্টি-টেকনিক্যাল ইন্ডিকেটর ক্রস ভেরিফিকেশন, যা মিথ্যা সংকেত হ্রাস করতে পারে
- ট্রেন্ড ট্র্যাকিং এবং গতিশীলতা সূচকগুলির সাথে একত্রিত হয়ে ট্রেডিং সাফল্যের হার বাড়ান
- ফিক্সড শতাংশ বন্ধ কৌশল, স্থিতিশীল মুনাফা নিশ্চিত
- প্রবণতা বিপরীত হওয়ার কারণে ম্যাকডির প্রস্থান
- কৌশলগত প্যারামিটারগুলি বিভিন্ন বাজারের বৈশিষ্ট্য অনুসারে নমনীয়ভাবে সামঞ্জস্য করা যায়
- এটিআর ব্যবহার করে বাজারের স্থিতির জন্য একটি রেফারেন্স প্রদান করে
কৌশলগত ঝুঁকি
- একাধিক সূচক সিগন্যালকে পিছিয়ে দিতে পারে
- ফিক্সড শতাংশ স্টপ-আপ একটি শক্তিশালী প্রবণতা মধ্যে অগ্রিম প্রস্থান হতে পারে
- স্টপ লস ব্যবস্থা না থাকায় ঝুঁকি বাড়ছে
- ট্রান্সক্রিপশন মার্কেটে ভুল সংকেত তৈরি হতে পারে
- ডিএমআই সূচক বাজারে বিভ্রান্তিকর সংকেত দিতে পারে
কৌশল অপ্টিমাইজেশনের দিকনির্দেশনা
- এটিআর-ভিত্তিক ডায়নামিক স্টপ-অফের মতো অভিযোজিত স্টপ-অফ ব্যবস্থা চালু করা
- উচ্চ অস্থিরতার সময় হোল্ডিং স্কেল সামঞ্জস্য করার জন্য অস্থিরতা ফিল্টার বিকাশ
- MACD প্যারামিটার অপ্টিমাইজ করা, ট্রেন্ড রিভার্সের সঠিকতা বাড়ানো
- সংকেত নির্ভরযোগ্যতা উন্নত করতে একটি ট্রেডিং ভলিউম নিশ্চিতকরণ প্রক্রিয়া যোগ করুন
- বাজারের অস্থিরতা অনুযায়ী লক্ষ্যমাত্রা লাভের জন্য গতিশীল স্টপ-আপ ব্যবস্থা তৈরি করা
সারসংক্ষেপ
এই কৌশলটি একাধিক প্রযুক্তিগত সূচকগুলির সমন্বয়মূলক সহযোগিতার মাধ্যমে একটি তুলনামূলকভাবে সম্পূর্ণ প্রবণতা ট্র্যাকিং ট্রেডিং সিস্টেম তৈরি করে। এর সুবিধা হল সংকেত স্বীকৃতির নির্ভরযোগ্যতা এবং ঝুঁকি নিয়ন্ত্রণের নমনীয়তা। যদিও কিছু পিছিয়ে পড়া ঝুঁকি রয়েছে, তবে প্যারামিটার অপ্টিমাইজেশন এবং গতিশীল পরিচালনা ব্যবস্থার সাথে যুক্ত হওয়ার মাধ্যমে কৌশলটির সামগ্রিক পারফরম্যান্স এখনও ভাল ব্যবহারের মূল্য রয়েছে। ক্রমাগত অপ্টিমাইজেশন এবং উন্নতির মাধ্যমে কৌশলটি একটি স্থিতিশীল ট্রেডিং সরঞ্জাম হতে পারে।
/*backtest
start: 2019-12-23 08:00:00
end: 2024-12-09 08:00:00
period: 1d
basePeriod: 1d
exchanges: [{"eid":"Futures_Binance","currency":"BTC_USDT"}]
*/

//@version=5
strategy("Swing Trading Strategy with DMI", overlay=true)

// Define parameters
sarStart = input.float(0.02, title="SAR Start")
sarIncrement = input.float(0.02, title="SAR Increment")
sarMax = input.float(0.2, title="SAR Max")
atrLength = input.int(10, title="ATR Length")
macdShort = input.int(12, title="MACD Short Length")
macdLong = input.int(26, title="MACD Long Length")
macdSignal = input.int(9, title="MACD Signal Length")
smaLength = input.int(50, title="SMA Length")
dmiLength = input.int(14, title="DMI Length")
adxSmoothing = input.int(14, title="ADX Smoothing") // Smoothing period for ADX
targetProfitPercentage = input.float(3.0, title="Target Profit Percentage")

// Calculate SAR
sar = ta.sar(sarStart, sarIncrement, sarMax)

// Calculate ATR
atr = ta.atr(atrLength)

// Calculate MACD
[macdLine, macdSignalLine, _] = ta.macd(close, macdShort, macdLong, macdSignal)

// Calculate SMA
sma = ta.sma(close, smaLength)
bullishTrend = close > sma

// Calculate DMI
[plusDI, minusDI, adx] = ta.dmi(dmiLength, adxSmoothing) // Specify ADX smoothing period

// Determine if DMI is bullish
dmiBullish = plusDI > minusDI

// Define buy signal
buySignal = ta.crossover(close, sar) and bullishTrend and dmiBullish

// Track buy price and position state
var float buyPrice = na
var bool inPosition = false

// Enter position
if (buySignal and not inPosition)
    buyPrice := close
    inPosition := true
    strategy.entry("Buy", strategy.long)

// Define target price (3% above the buy price)
targetPrice = na(buyPrice) ? na : buyPrice * (1 + targetProfitPercentage / 100)

// Define MACD sell signal
macdSellSignal = ta.crossunder(macdLine, macdSignalLine)

// Define sell signal
sellSignal = inPosition and (close >= targetPrice or macdSellSignal)

// Exit position
if (sellSignal)
    inPosition := false
    strategy.exit("Sell", "Buy", limit=targetPrice)

// Plot SAR on the chart
plot(sar, color=color.red, style=plot.style_cross, linewidth=2)

// Plot SMA (optional, for visualizing the trend)
plot(sma, color=color.blue, title="SMA")

// Plot DMI +DI and -DI
plot(plusDI, color=color.green, title="+DI")
plot(minusDI, color=color.red, title="-DI")

// Plot buy signal on the chart
//plotshape(series=buySignal, location=location.belowbar, color=color.green, style=shape.labelup, text="BUY")

// Plot sell signal on the chart
//plotshape(series=sellSignal, location=location.abovebar, color=color.red, style=shape.labeldown, text="SELL")

// Optional: Plot background color for buy and sell signals
bgcolor(buySignal ? color.new(color.green, 90) : na, title="Buy Signal Background")
bgcolor(sellSignal ? color.new(color.red, 90) : na, title="Sell Signal Background")