ডুয়াল ইমপুটম ওসিলেটর স্মার্ট টাইমিং ট্রেডিং কৌশল
লেখক:চাওঝাং, তারিখঃ ২০২৪-১২-১৭ ১৪ঃ৩৬ঃ৪৬ট্যাগঃআরএসআইএসএমএইএমএএমএসিডি

সারসংক্ষেপ
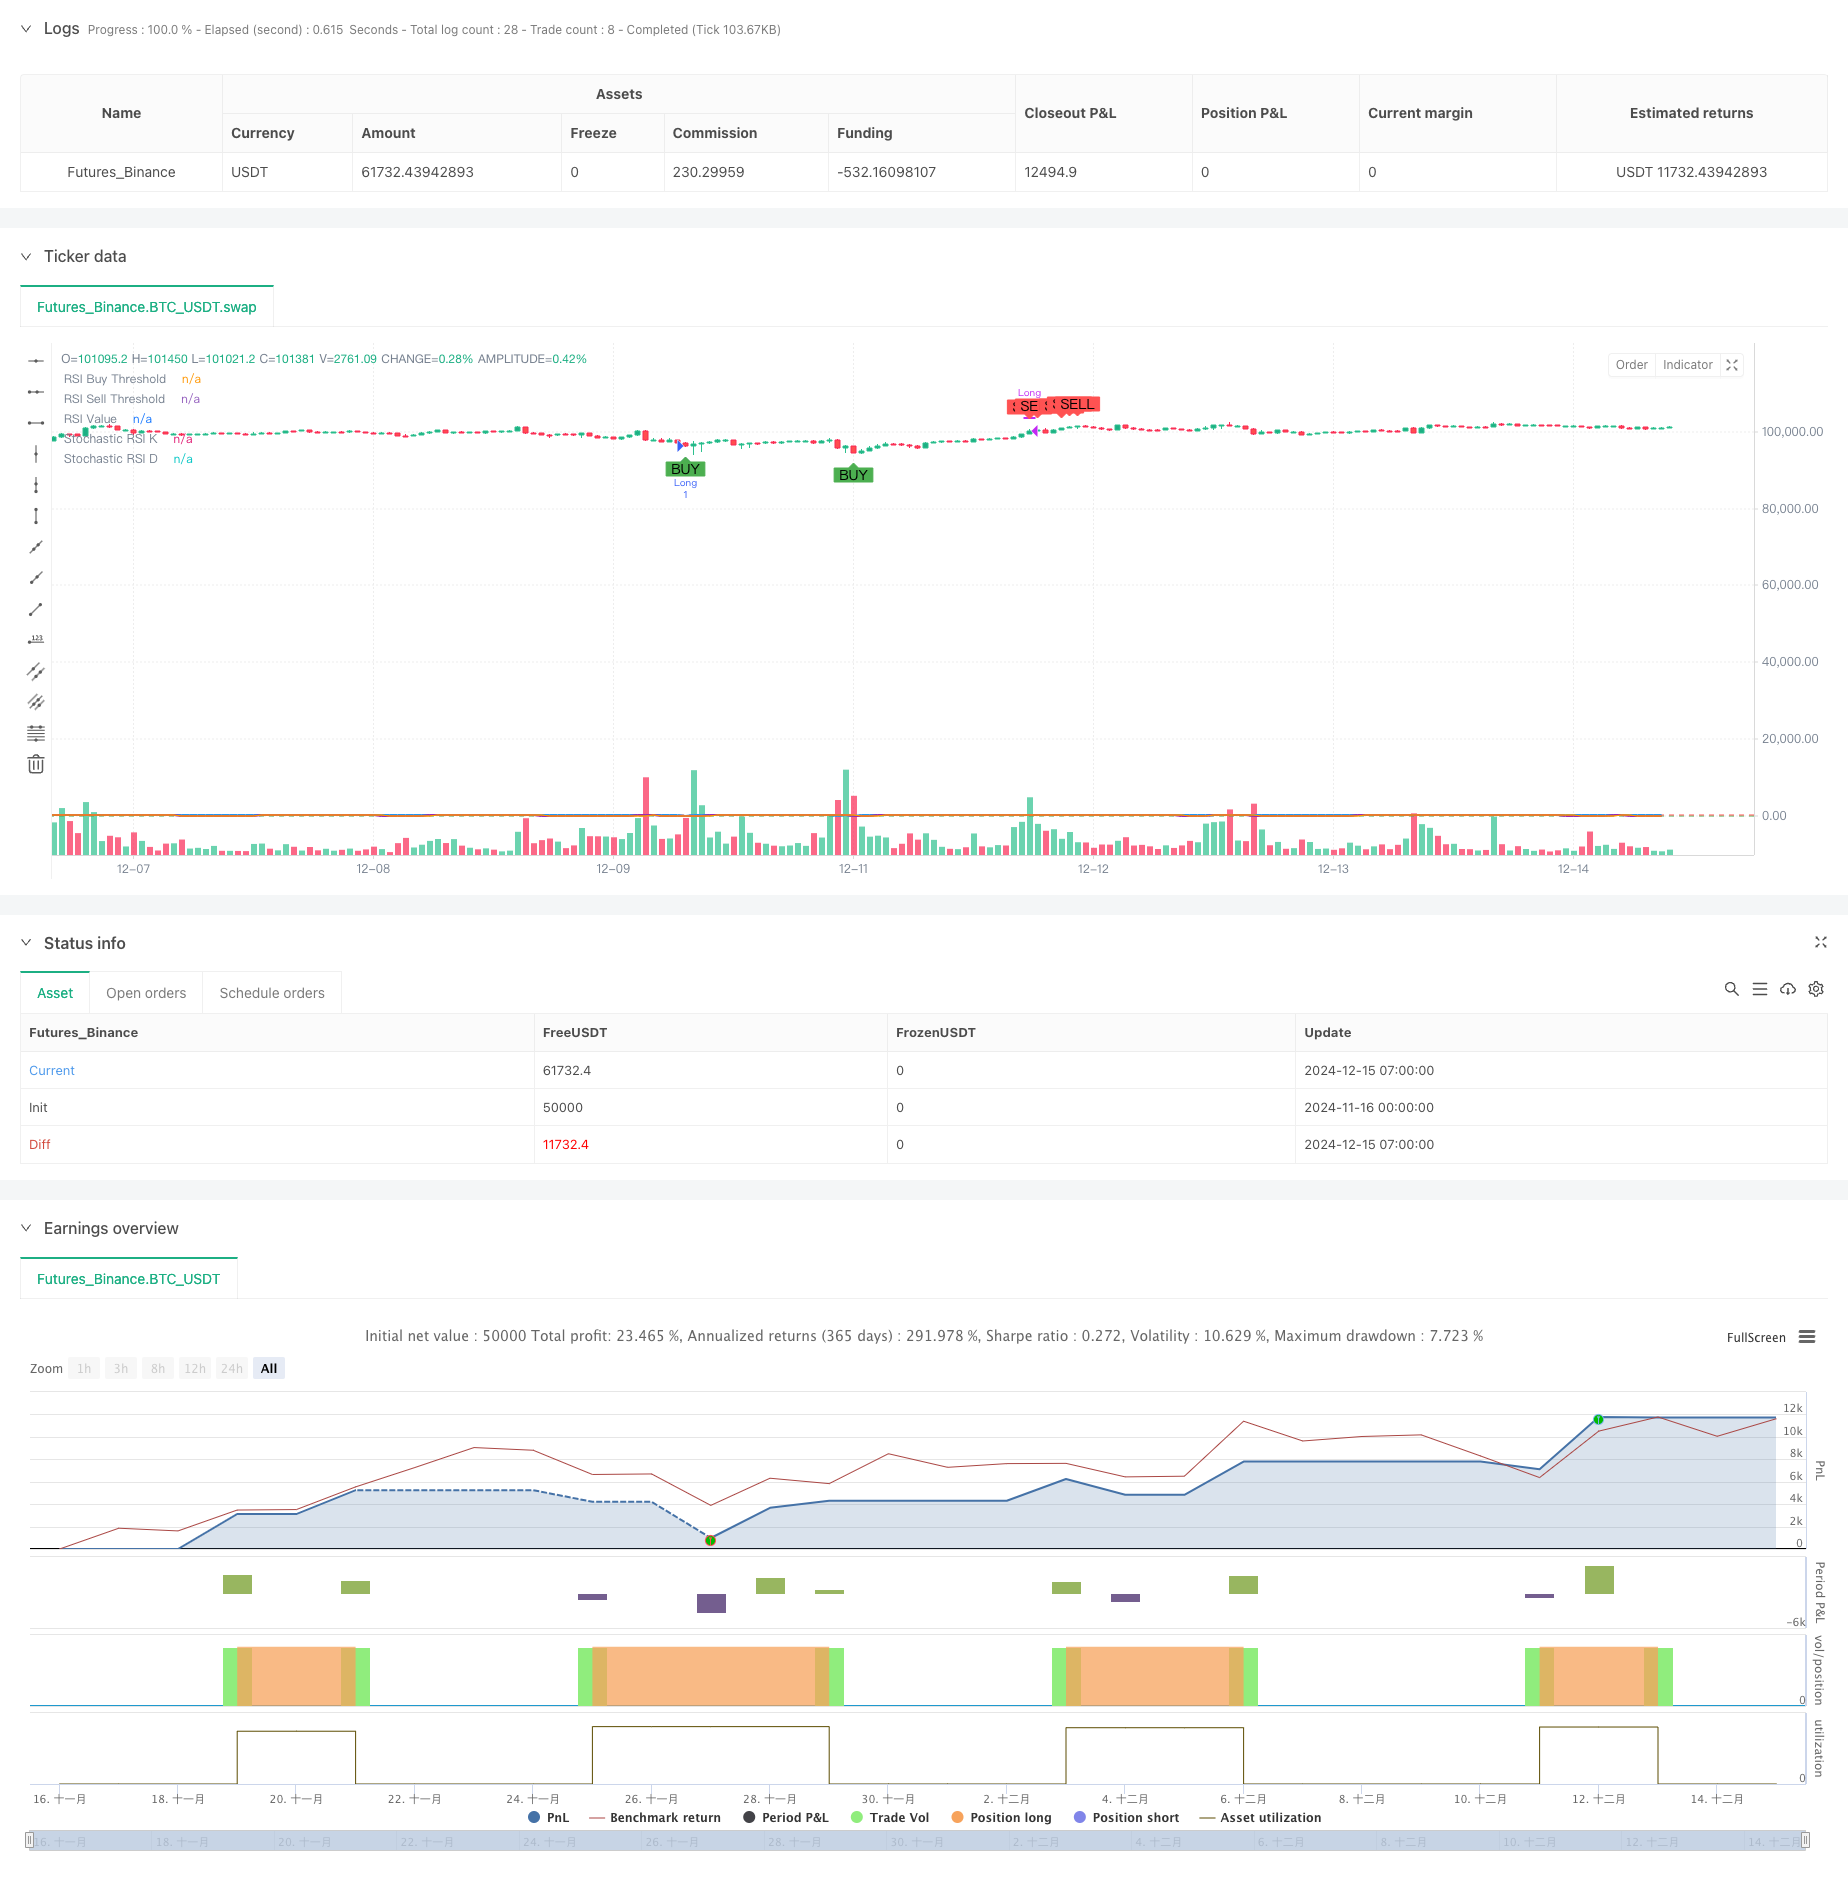
এই কৌশলটি একটি বুদ্ধিমান ট্রেডিং সিস্টেম যা দ্বৈত গতির সূচকগুলির উপর ভিত্তি করেঃ আরএসআই এবং স্টোকাস্টিক আরএসআই। এটি দুটি গতির দোলকের সংকেতগুলি একত্রিত করে, সম্ভাব্য ট্রেডিং সুযোগগুলি ক্যাপচার করে বাজারের অতিরিক্ত ক্রয় এবং অতিরিক্ত বিক্রয় শর্তগুলি সনাক্ত করে। সিস্টেমটি সময়কালের অভিযোজনকে সমর্থন করে এবং বিভিন্ন বাজারের পরিবেশ অনুযায়ী ট্রেডিং চক্রগুলি নমনীয়ভাবে সামঞ্জস্য করতে পারে।
কৌশল নীতি
কৌশলটির মূল যুক্তি নিম্নলিখিত মূল উপাদানগুলির উপর ভিত্তি করেঃ 1. মূল্য গতির হিসাব করতে 14 পিরিয়ড আরএসআই সূচক ব্যবহার করে ২. সেকেন্ডারি নিশ্চিতকরণের জন্য ১৪ পেরিওড স্টোকাস্টিক আরএসআই ব্যবহার করে ৩. যখন আরএসআই ৩৫ এর নিচে এবং স্টোকাস্টিক আরএসআই ২০ এর নিচে থাকে তখন ট্রিগার কিনে সংকেত দেয় ৪. যখন আরএসআই ৭০ এর উপরে এবং স্টোকাস্টিক আরএসআই ৮০ এর উপরে থাকে তখন ট্রিগারগুলি সংকেত বিক্রি করে 5. সিগন্যাল স্থিতিশীলতার জন্য স্টোকাস্টিক আরএসআই-তে 3-অবধি এসএমএ মসৃণকরণ প্রয়োগ করে 6. দৈনিক এবং সাপ্তাহিক সময়সীমার মধ্যে স্যুইচিং সমর্থন করে
কৌশলগত সুবিধা
- ডাবল সিগন্যাল কনফার্মেশন মেকানিজম ভুয়া সিগন্যালের হস্তক্ষেপকে উল্লেখযোগ্যভাবে হ্রাস করে
- সূচক পরামিতিগুলি বাজারের অস্থিরতার সাথে নমনীয়ভাবে সামঞ্জস্য করা যেতে পারে
- এসএমএ মসৃণকরণ কার্যকরভাবে সংকেত গোলমাল হ্রাস করে
- বিভিন্ন বিনিয়োগকারীর চাহিদা মেটাতে বহু-অবধি লেনদেনকে সমর্থন করে
- ভিজ্যুয়াল ইন্টারফেস বিশ্লেষণের জন্য ক্রয় / বিক্রয় সংকেত স্বজ্ঞাতভাবে প্রদর্শন করে
- পরিষ্কার কোড কাঠামো, বজায় রাখা এবং আরও বিকাশ করা সহজ
কৌশলগত ঝুঁকি
- পার্শ্ববর্তী বাজারে অত্যধিক ট্রেডিং সংকেত তৈরি করতে পারে
- দ্রুত প্রবণতা বিপরীতের সময় সম্ভাব্য সংকেত বিলম্ব
- অনুপযুক্ত প্যারামিটার সেটিংস হারিয়েছে ট্রেডিং সুযোগ হতে পারে
- বাজারের উচ্চ অস্থিরতার সময় মিথ্যা সংকেত দেখা দিতে পারে
- ঝুঁকি নিয়ন্ত্রণের জন্য যথাযথ স্টপ লস সেটিং প্রয়োজন
কৌশল অপ্টিমাইজেশান নির্দেশাবলী
- সিগন্যালের নির্ভরযোগ্যতা উন্নত করতে এমএসিডি বা ইএমএর মতো প্রবণতা মূল্যায়ন সূচক প্রবর্তন করুন
- সিগন্যালের গুণমান উন্নত করতে ভলিউম ফ্যাক্টর যুক্ত করুন
- ঝুঁকি ব্যবস্থাপনা অপ্টিমাইজ করার জন্য গতিশীল স্টপ-লস প্রক্রিয়া বাস্তবায়ন
- কৌশল স্থিতিশীলতার জন্য অভিযোজিত পরামিতি অপ্টিমাইজেশন সিস্টেম বিকাশ
- লেনদেনের সময়সূচী অপ্টিমাইজ করার জন্য বাজারের অস্থিরতার সূচক অন্তর্ভুক্ত করার বিষয়টি বিবেচনা করুন
সংক্ষিপ্তসার
কৌশলটি আরএসআই এবং স্টোকাস্টিক আরএসআই এর সুবিধাগুলি একত্রিত করে একটি নির্ভরযোগ্য ট্রেডিং সিস্টেম তৈরি করে। দ্বৈত সংকেত নিশ্চিতকরণ প্রক্রিয়া কার্যকরভাবে মিথ্যা সংকেত হ্রাস করে, যখন নমনীয় পরামিতি সেটিংগুলি শক্তিশালী অভিযোজনযোগ্যতা সরবরাহ করে। ক্রমাগত অপ্টিমাইজেশন এবং উন্নতির মাধ্যমে, কৌশলটি বিভিন্ন বাজারের অবস্থার মধ্যে স্থিতিশীল কর্মক্ষমতা বজায় রাখতে প্রতিশ্রুতিবদ্ধ।
/*backtest
start: 2024-11-16 00:00:00
end: 2024-12-15 08:00:00
period: 1h
basePeriod: 1h
exchanges: [{"eid":"Futures_Binance","currency":"BTC_USDT"}]
*/

//@version=5
strategy("BTC Buy & Sell Strategy (RSI & Stoch RSI)", overlay=true)

// Input Parameters
rsi_length = input.int(14, title="RSI Length")
stoch_length = input.int(14, title="Stochastic Length")
stoch_smooth_k = input.int(3, title="Stochastic %K Smoothing")
stoch_smooth_d = input.int(3, title="Stochastic %D Smoothing")

// Threshold Inputs
rsi_buy_threshold = input.float(35, title="RSI Buy Threshold")
stoch_buy_threshold = input.float(20, title="Stochastic RSI Buy Threshold")
rsi_sell_threshold = input.float(70, title="RSI Sell Threshold")
stoch_sell_threshold = input.float(80, title="Stochastic RSI Sell Threshold")

use_weekly_data = input.bool(false, title="Use Weekly Data", tooltip="Enable to use weekly timeframe for calculations.")

// Timeframe Configuration
timeframe = use_weekly_data ? "W" : timeframe.period

// Calculate RSI and Stochastic RSI
rsi_value = request.security(syminfo.tickerid, timeframe, ta.rsi(close, rsi_length))
stoch_rsi_k_raw = request.security(syminfo.tickerid, timeframe, ta.stoch(close, high, low, stoch_length))
stoch_rsi_k = ta.sma(stoch_rsi_k_raw, stoch_smooth_k)
stoch_rsi_d = ta.sma(stoch_rsi_k, stoch_smooth_d)

// Define Buy and Sell Conditions
buy_signal = (rsi_value < rsi_buy_threshold) and (stoch_rsi_k < stoch_buy_threshold)
sell_signal = (rsi_value > rsi_sell_threshold) and (stoch_rsi_k > stoch_sell_threshold)

// Strategy Execution
if buy_signal
    strategy.entry("Long", strategy.long, comment="Buy Signal")

if sell_signal
    strategy.close("Long", comment="Sell Signal")

// Plot Buy and Sell Signals
plotshape(buy_signal, style=shape.labelup, location=location.belowbar, color=color.green, title="Buy Signal", size=size.small, text="BUY")
plotshape(sell_signal, style=shape.labeldown, location=location.abovebar, color=color.red, title="Sell Signal", size=size.small, text="SELL")

// Plot RSI and Stochastic RSI for Visualization
hline(rsi_buy_threshold, "RSI Buy Threshold", color=color.green)
hline(rsi_sell_threshold, "RSI Sell Threshold", color=color.red)

plot(rsi_value, color=color.blue, linewidth=2, title="RSI Value")
plot(stoch_rsi_k, color=color.purple, linewidth=2, title="Stochastic RSI K")
plot(stoch_rsi_d, color=color.orange, linewidth=1, title="Stochastic RSI D")
- মাল্টি-ইন্ডিকেটর কোন্টিটেটিভ ট্রেডিং কৌশল - সুপার ইন্ডিকেটর ৭-ইন-১ কৌশল
- মাল্টি-ইন্ডিকেটর ট্রেন্ড অনুসরণ করে আরএসআই ওভারকপ্ট/ওভারসোল্ড কুইন্টেটিভ ট্রেডিং স্ট্র্যাটেজি
- কৌশল অনুসরণ করে ডাবল মুভিং গড় চ্যানেল ট্রেন্ড
- এসএএমএ-আরএসআই-এমএসিডি মাল্টি-ইন্ডিক্টর ডায়নামিক লিমিট অর্ডার ট্রেডিং কৌশল
- মাল্টি-টাইমফ্রেম ইএমএ ক্রস হাই-উইন রেট ট্রেন্ড অনুসরণকারী কৌশল (অ্যাডভান্সড)
- জি-চ্যানেল এবং ইএমএ-র উপর ভিত্তি করে পরিমাণগত দীর্ঘ-সংক্ষিপ্ত স্যুইচিং কৌশল
- ডায়নামিক ডুয়াল মুভিং এভারেজ ক্রসওভার কংক্রিটেটিভ ট্রেডিং স্ট্র্যাটেজি
- মাল্টি-ইন্ডিকেটর কম্প্রিহেনসিভ ট্রেডিং স্ট্র্যাটেজিঃ ইমপুটাম, ওভারকপ/ওভারসোল্ড এবং ভোল্টেবিলিটির নিখুঁত সমন্বয়
- ৫২-সপ্তাহের উচ্চ/নিম্ন এক্সটেনশন বিশ্লেষণ সিস্টেমের সাথে মাল্টি-লেভেল ডায়নামিক এমএসিডি ট্রেন্ড অনুসরণকারী কৌশল
- মাল্টি-স্ট্র্যাটেজি টেকনিক্যাল অ্যানালিসিস ট্রেডিং সিস্টেম
- ঝুঁকি ব্যবস্থাপনা সহ কৌশল অনুসরণ করে ডাবল চলমান গড় প্রবণতা
- ট্রিপল সুপারট্রেন্ড এবং বোলিংজার ব্যান্ডস মাল্টি-ইন্ডিক্টর ট্রেন্ড অনুসরণকারী কৌশল
- মাল্টি-ট্রেন্ডলাইন ব্রেকআউট ইম্পোমেন্টাম কোন্টিটেটিভ স্ট্র্যাটেজি
- RSI Momentum এবং ADX ট্রেন্ড শক্তি ভিত্তিক মূলধন ব্যবস্থাপনা সিস্টেম
- মাল্টি-টাইমফ্রেম লিকুইডিটি পিভট হিটম্যাপ কৌশল
- ATR-ভিত্তিক লাভ এবং স্টপ লস নিয়ে একাধিক সময়সীমার ট্রেন্ড অনুসরণকারী কৌশল
- অ্যাডাপ্টিভ ট্রেলিং স্টপ সহ উন্নত ট্রেন্ড অনুসরণকারী কৌশল
- RSI ইম্পোমেন্টাম ফিল্টার সহ কৌশল অনুসরণ করে মাল্টি-টেকনিক্যাল ইন্ডিকেটর ট্রেন্ড
- ডায়নামিক রিস্ক-ম্যানেজড এক্সপোনেনশিয়াল মুভিং এভারেজ ক্রসওভার কৌশল
- ডুয়াল এক্সপোনেনশিয়াল মুভিং মিডিয়ার এবং আপেক্ষিক শক্তি সূচক ক্রসওভার কৌশল
- ডায়নামিক রেঞ্জ ফিল্টার সহ উন্নত পরিমাণগত প্রবণতা ক্যাপচার কৌশল
- ট্রেডিং ভিউ সিগন্যাল এক্সিকিউশন পলিসি (বিল্ট-ইন HTTP পরিষেবা সংস্করণ)
- আরএসআই এবং এমএসিডি সংহতকরণের উপর ভিত্তি করে উন্নত পাঁচ দিনের ক্রস-অ্যানালিসিস কৌশল
- ডুয়াল আরএসআই সূচকগুলির উপর ভিত্তি করে অ্যাডাপ্টিভ রেঞ্জ ট্রেডিং সিস্টেম
- ডায়নামিক ডুয়াল সুপারট্রেন্ড ভলিউম-প্রাইস কৌশল
- ব্ল্যাক সোয়ান ভোল্টেবিলিটি এবং চলমান গড় ক্রসওভার মোমেন্টাম ট্র্যাকিং কৌশল
- বোলিংজার ব্যান্ড এবং সুপারট্রেন্ডের সংমিশ্রণ সহ স্মার্ট ভোলাটিলিটি রেঞ্জ ট্রেডিং কৌশল
- ডায়নামিক স্টপ-লস সিস্টেমের সাথে কৌশল অনুসরণ করে মাল্টি-ইন্ডিক্টর সিনার্জিস্টিক ট্রেন্ড
- বোলিংজার ব্যান্ডস ইম্পুটাম ব্রেকআউট অ্যাডাপ্টিভ ট্রেন্ড স্ট্র্যাটেজি অনুসরণ
- এমএসিডি-এটিআর বাস্তবায়নের মাধ্যমে উন্নত গড় বিপরীতমুখী কৌশল