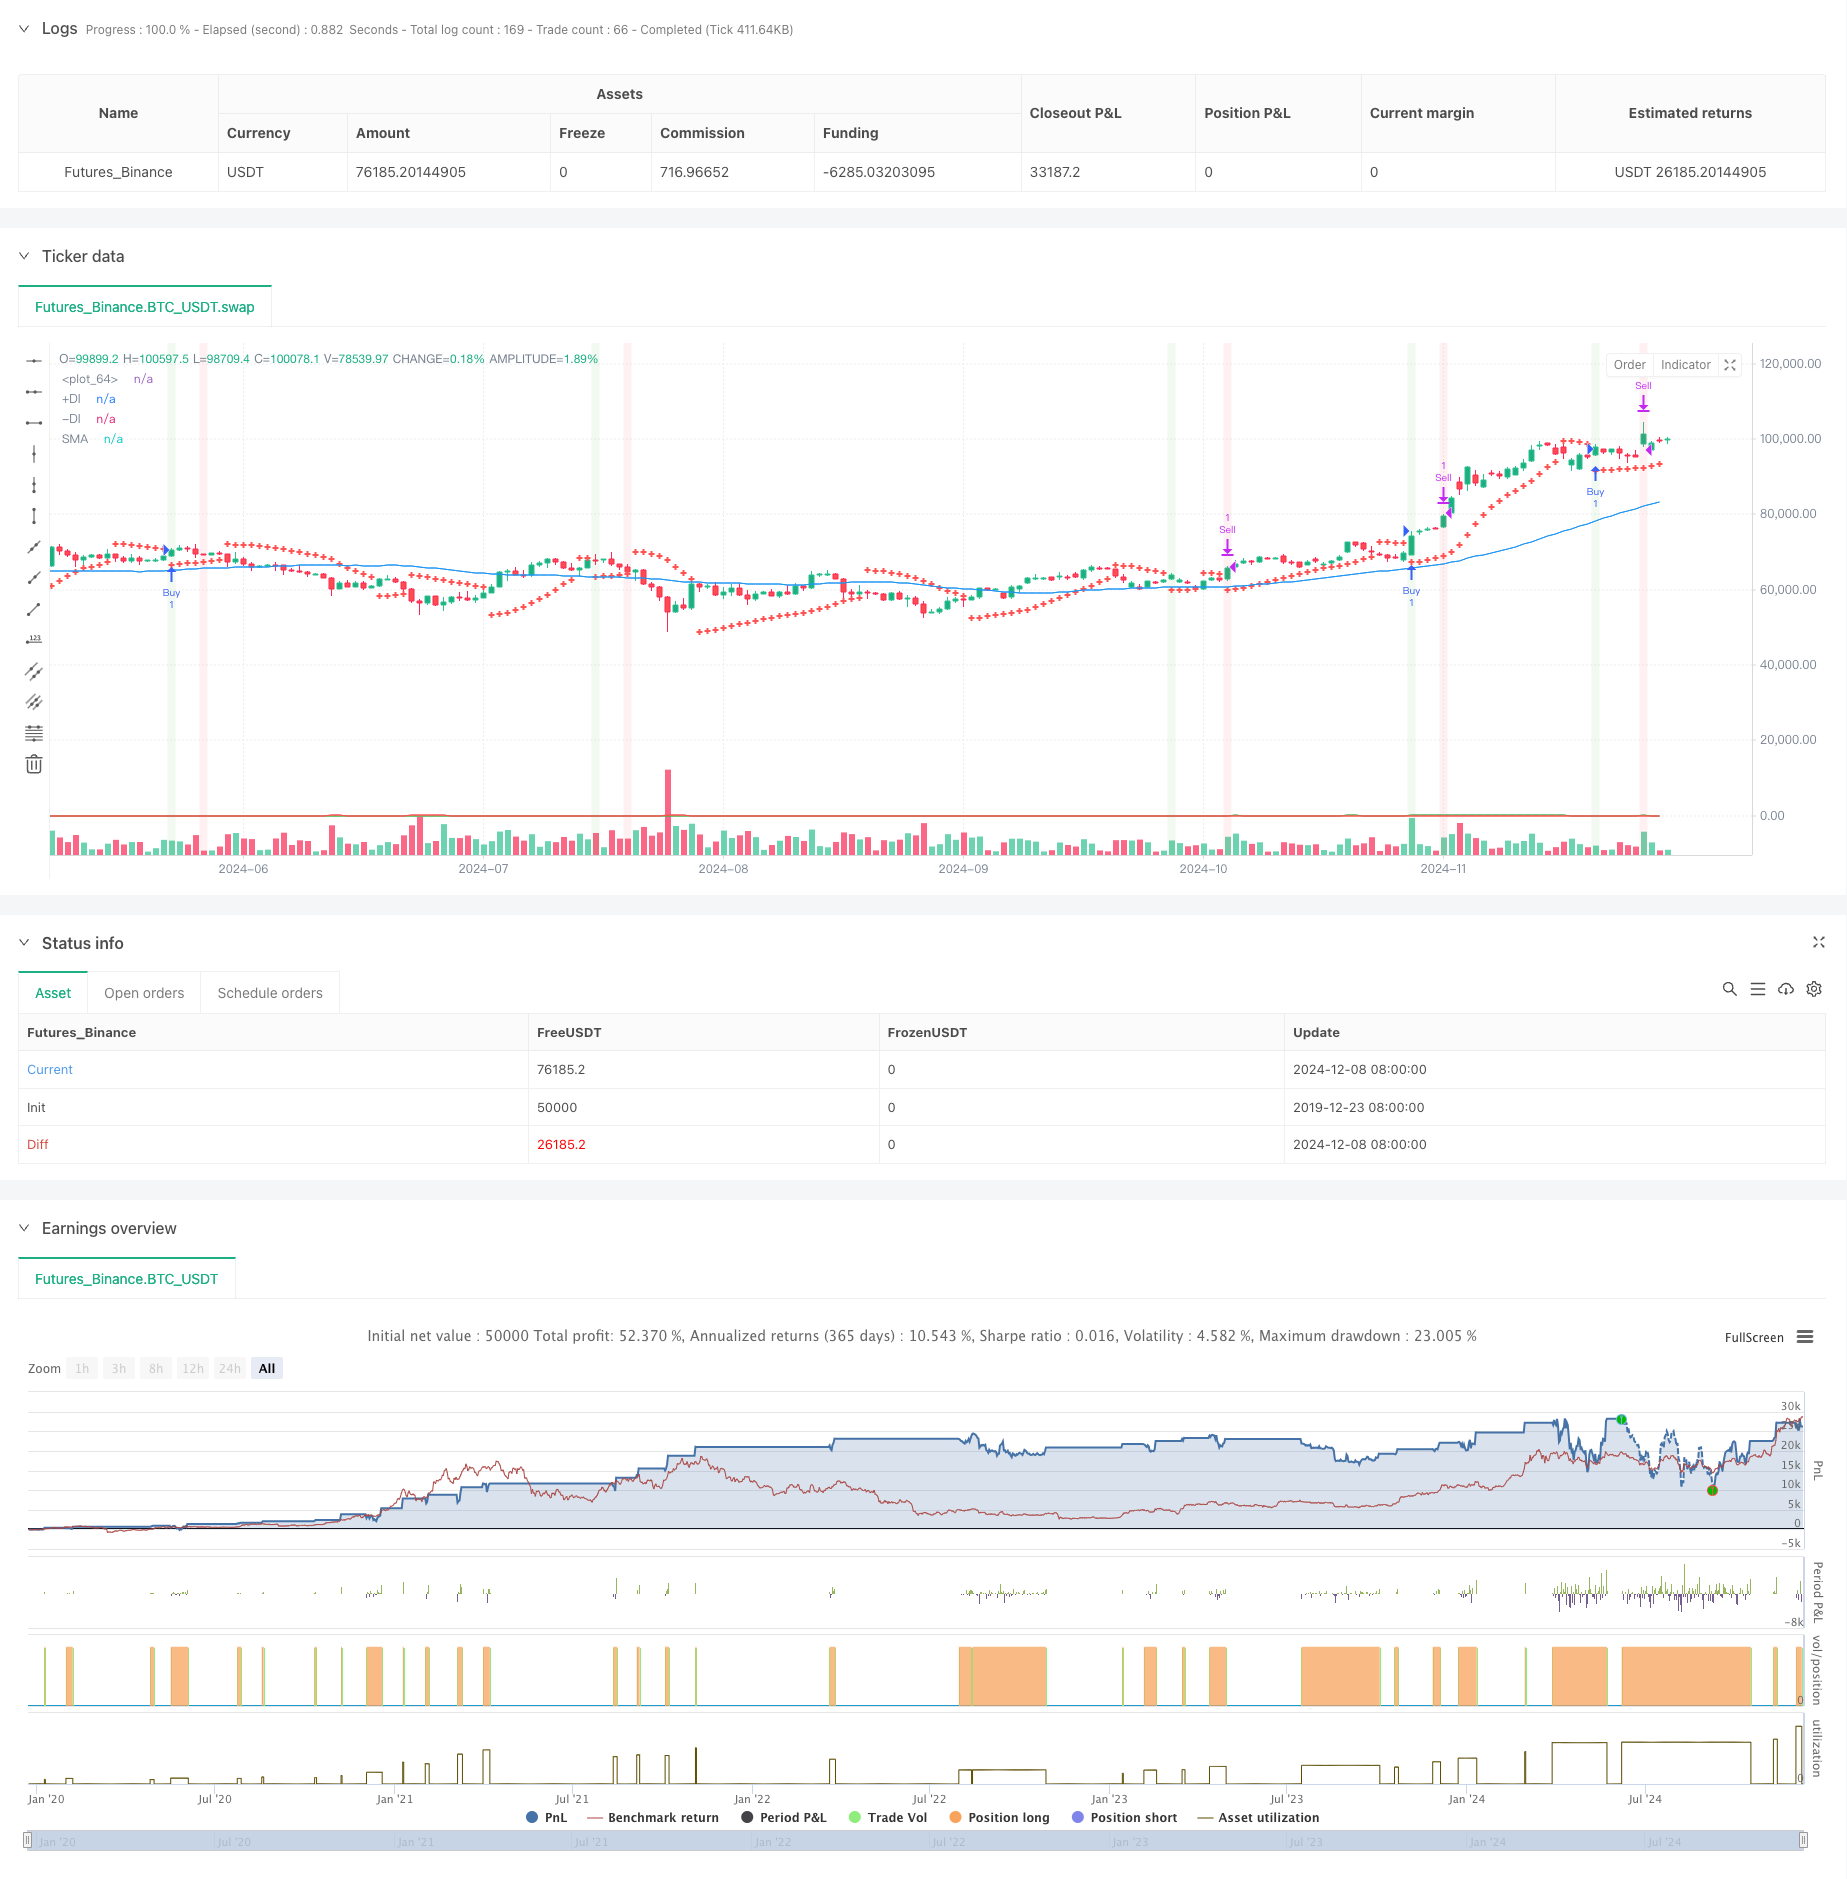
Überblick
Die Strategie ist ein Trend-Tracking-Trading-System, das mehrere technische Indikatoren kombiniert. Es verwendet hauptsächlich die Parabolic Line Shift Indicator (SAR), den Moving Average (SMA) und den Directional Momentum Indicator (DMI) zur Ermittlung der Markttrends und des Eintrittszeitpunkts und optimiert den Ausstieg durch Prozentsatzstopps und MACD-Rückgängigkeiten. Die Kernidee der Strategie ist es, nach einem starken Trend einzutreten und rechtzeitig auszutreten, wenn das vorgegebene Gewinnziel erreicht oder ein Trendwende-Signal auftritt.
Strategieprinzip
Die Strategie nutzt mehrschichtige Filtermechanismen zur Bestätigung von Handelssignalen:
- Erste Handelssignale durch Kreuzung von SAR-Indikatoren
- Verwenden Sie die 50-Zyklus-SMA, um die Gesamttrendrichtung zu bestimmen
- Verwendung von DMI-Indikatoren zur Bestätigung der Trendstärke und -richtung
- Eintrittsvoraussetzungen müssen gleichzeitig erfüllt sein: der Preis trägt den SAR, der Preis liegt über dem SMA und der DMI zeigt einen mehrseitigen Trend
- Doppelmechanismus: Zielgewinn von 3% oder MACD-Dead-Fork-Signal
- ATR-Indikator als Referenz für die Marktvolatilität
Strategische Vorteile
- Multi-Technik-Kennzahlen-Kreuzüberprüfung, um Falschmeldungen wirksam zu reduzieren
- Erhöhung der Erfolgsrate durch Trend-Tracking und Dynamometer
- Die Strategie der festen Prozentsätze sorgt für einen stabilen Gewinn.
- Der MACD verzichtet auf einen Ausgang, um sich von einer Trendwende abzuwenden
- Strategieparameter können flexibel an unterschiedliche Marktmerkmale angepasst werden
- Die ATR dient zur Volatilitätsüberwachung und als Referenz für die Marktlage.
Strategisches Risiko
- Mehrere Anzeigen können zu Signalverzögerungen führen
- Die Fixed-Percentage-Stopper könnten bei einem starken Trend vorzeitig aussteigen
- Keine Stop-Loss-Mechanismen erhöhen die Risikogruppe
- Das könnte zu viele Falschsignale in den OTC-Märkten bedeuten.
- DMI-Indikator könnte in einem wackligen Markt falsche Signale abgeben
Richtung der Strategieoptimierung
- Einführung von Adaptive Stop-Mechanismen, wie beispielsweise ATR-basierter dynamischer Stop-Loss
- Entwicklung eines Volatilitätsfilters zur Anpassung der Haltungsgröße während hoher Volatilität
- Optimierung der MACD-Parameter zur Verbesserung der Genauigkeit bei der Trendwende
- Fügen Sie einen Lautstärkebestätigungsmechanismus hinzu, um die Signalzuverlässigkeit zu verbessern
- Entwicklung eines dynamischen Stop-Loss-Mechanismus, der die Zielmarge an Marktschwankungen anpasst
Zusammenfassen
Die Strategie baut durch die synchronische Zusammenarbeit von mehreren technischen Indikatoren ein relativ vollständiges Trend-Tracking-Handelssystem auf. Ihr Vorteil liegt in der Zuverlässigkeit der Signalerkennung und der Flexibilität der Risikokontrolle. Obwohl ein gewisses Rückstandsrisiko besteht, hat die Strategie durch die Optimierung der Parameter und die Einbindung in eine dynamische Management-Mechanik eine gute Anwendung.
/*backtest
start: 2019-12-23 08:00:00
end: 2024-12-09 08:00:00
period: 1d
basePeriod: 1d
exchanges: [{"eid":"Futures_Binance","currency":"BTC_USDT"}]
*/

//@version=5
strategy("Swing Trading Strategy with DMI", overlay=true)

// Define parameters
sarStart = input.float(0.02, title="SAR Start")
sarIncrement = input.float(0.02, title="SAR Increment")
sarMax = input.float(0.2, title="SAR Max")
atrLength = input.int(10, title="ATR Length")
macdShort = input.int(12, title="MACD Short Length")
macdLong = input.int(26, title="MACD Long Length")
macdSignal = input.int(9, title="MACD Signal Length")
smaLength = input.int(50, title="SMA Length")
dmiLength = input.int(14, title="DMI Length")
adxSmoothing = input.int(14, title="ADX Smoothing") // Smoothing period for ADX
targetProfitPercentage = input.float(3.0, title="Target Profit Percentage")

// Calculate SAR
sar = ta.sar(sarStart, sarIncrement, sarMax)

// Calculate ATR
atr = ta.atr(atrLength)

// Calculate MACD
[macdLine, macdSignalLine, _] = ta.macd(close, macdShort, macdLong, macdSignal)

// Calculate SMA
sma = ta.sma(close, smaLength)
bullishTrend = close > sma

// Calculate DMI
[plusDI, minusDI, adx] = ta.dmi(dmiLength, adxSmoothing) // Specify ADX smoothing period

// Determine if DMI is bullish
dmiBullish = plusDI > minusDI

// Define buy signal
buySignal = ta.crossover(close, sar) and bullishTrend and dmiBullish

// Track buy price and position state
var float buyPrice = na
var bool inPosition = false

// Enter position
if (buySignal and not inPosition)
    buyPrice := close
    inPosition := true
    strategy.entry("Buy", strategy.long)

// Define target price (3% above the buy price)
targetPrice = na(buyPrice) ? na : buyPrice * (1 + targetProfitPercentage / 100)

// Define MACD sell signal
macdSellSignal = ta.crossunder(macdLine, macdSignalLine)

// Define sell signal
sellSignal = inPosition and (close >= targetPrice or macdSellSignal)

// Exit position
if (sellSignal)
    inPosition := false
    strategy.exit("Sell", "Buy", limit=targetPrice)

// Plot SAR on the chart
plot(sar, color=color.red, style=plot.style_cross, linewidth=2)

// Plot SMA (optional, for visualizing the trend)
plot(sma, color=color.blue, title="SMA")

// Plot DMI +DI and -DI
plot(plusDI, color=color.green, title="+DI")
plot(minusDI, color=color.red, title="-DI")

// Plot buy signal on the chart
//plotshape(series=buySignal, location=location.belowbar, color=color.green, style=shape.labelup, text="BUY")

// Plot sell signal on the chart
//plotshape(series=sellSignal, location=location.abovebar, color=color.red, style=shape.labeldown, text="SELL")

// Optional: Plot background color for buy and sell signals
bgcolor(buySignal ? color.new(color.green, 90) : na, title="Buy Signal Background")
bgcolor(sellSignal ? color.new(color.red, 90) : na, title="Sell Signal Background")