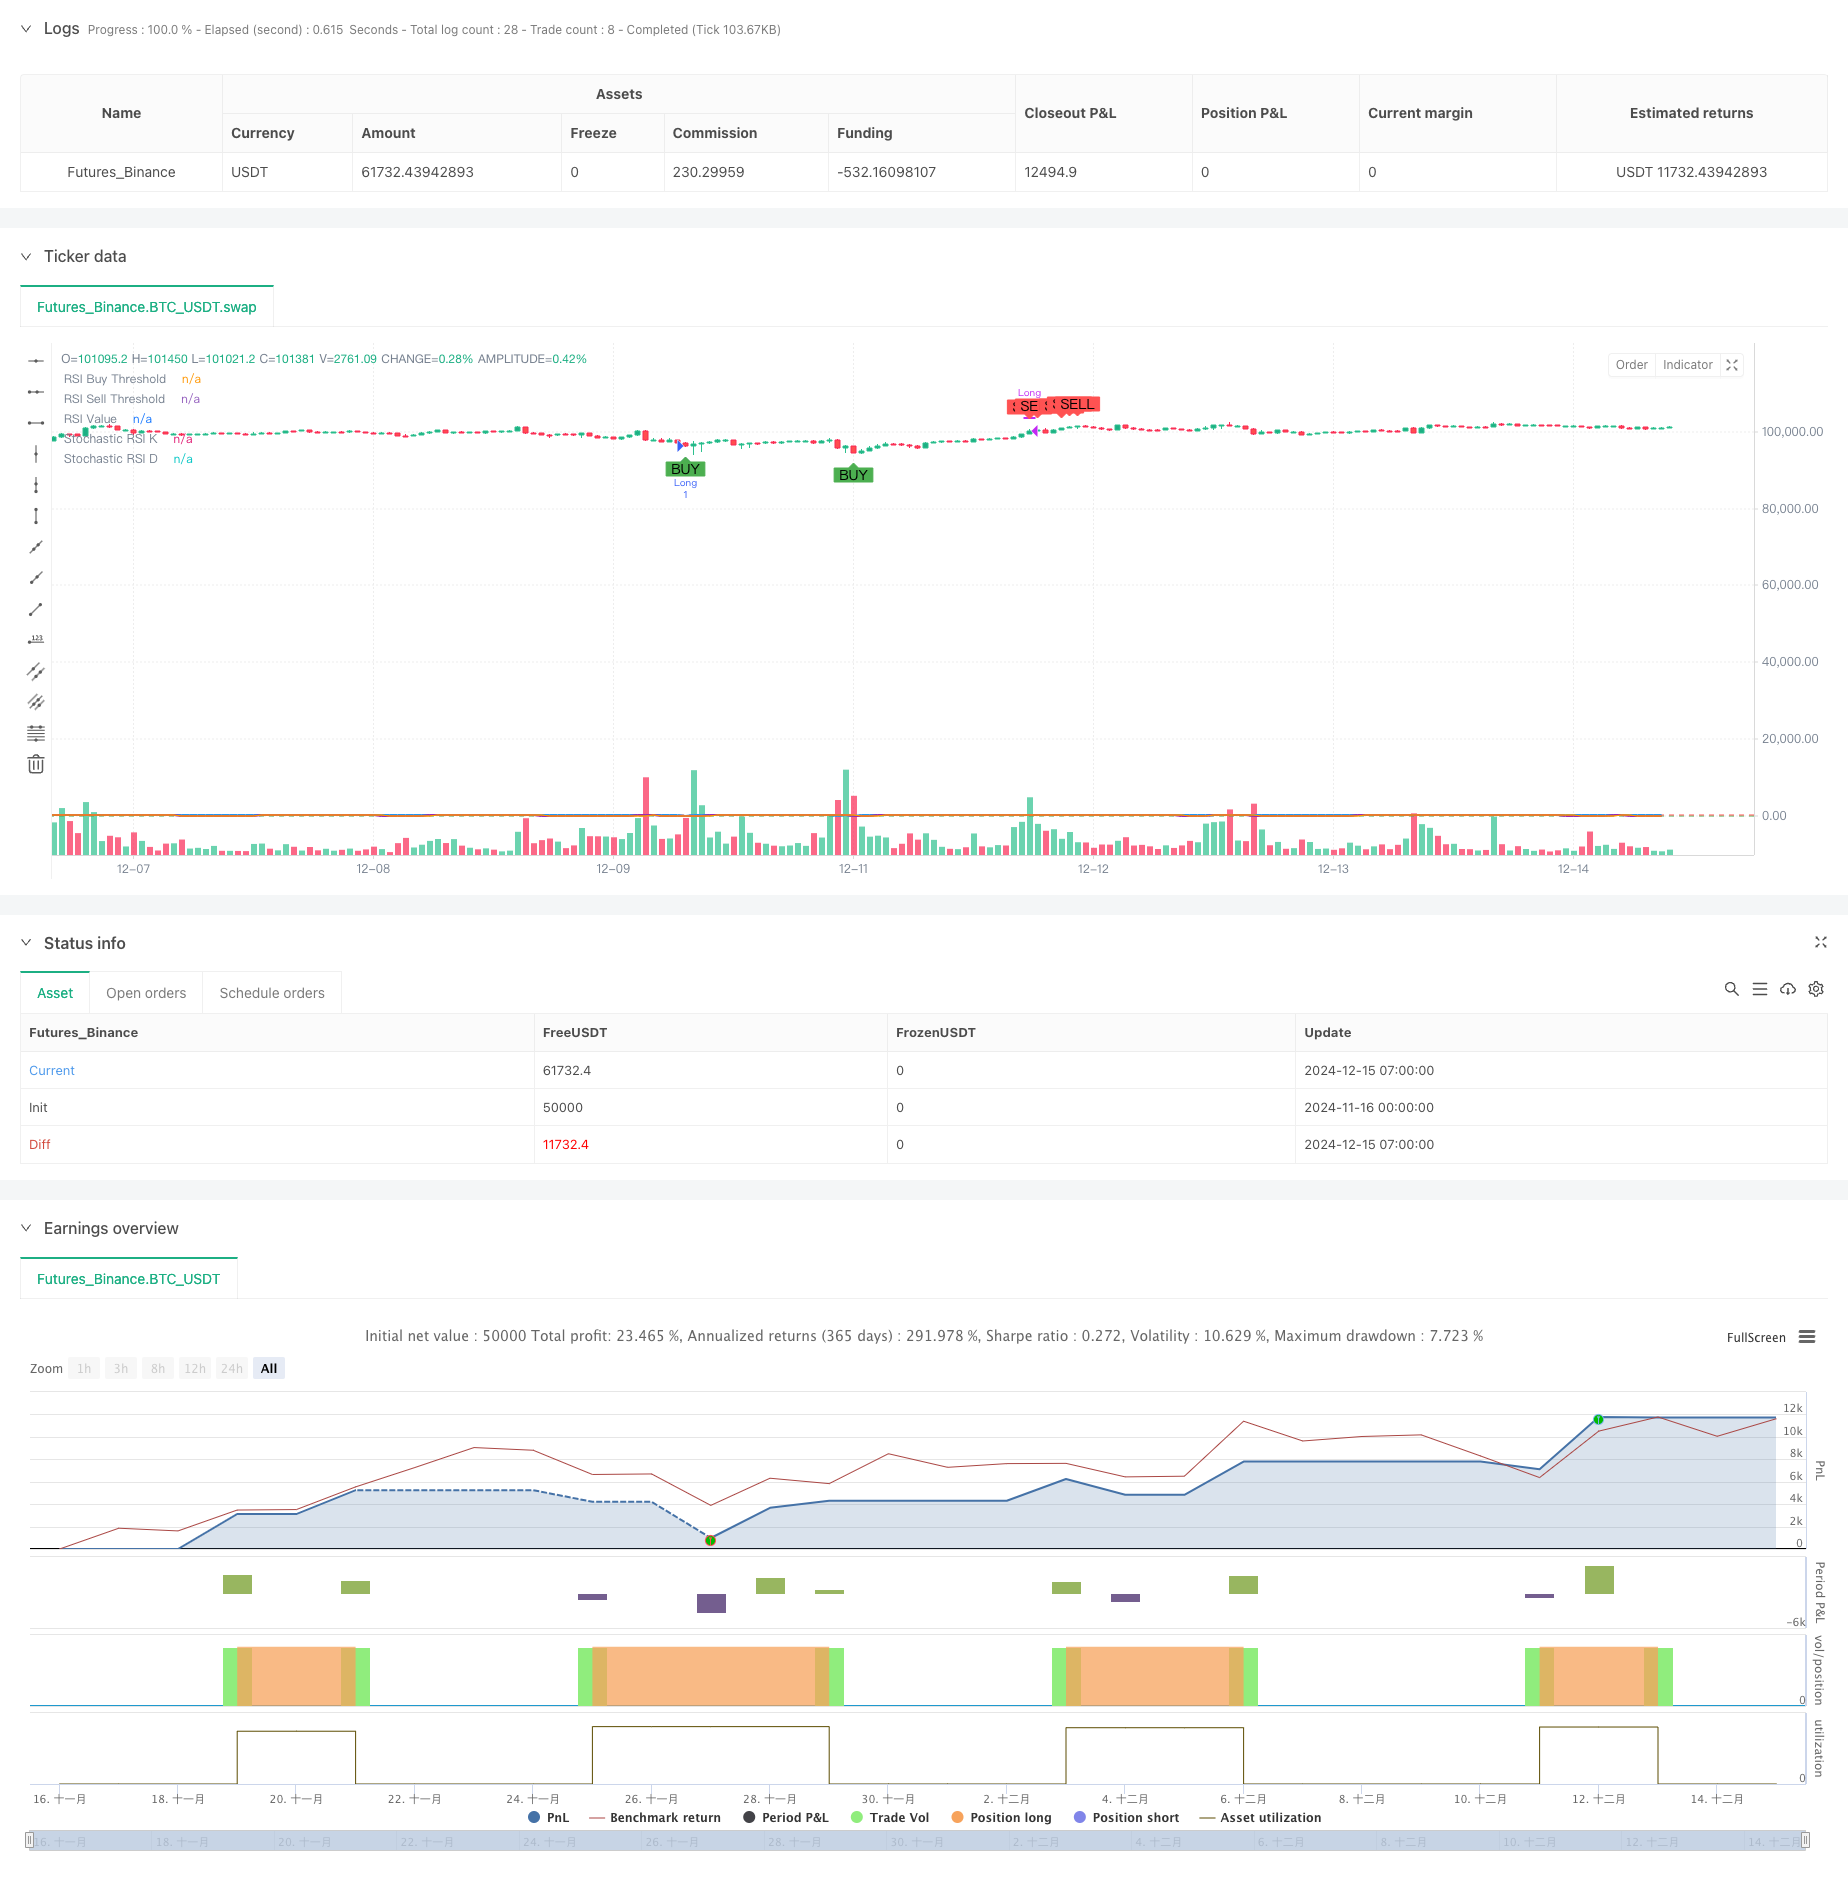
Strategie für den Handel mit Dual Momentum-Oszillatoren im intelligenten Timing
Schriftsteller:ChaoZhang, Datum: 2024-12-17 14:36:46Tags:RSISMAEMAMACD

Übersicht
Diese Strategie ist ein intelligentes Handelssystem, das auf zwei Dynamikindikatoren basiert: RSI und Stochastic RSI. Es identifiziert Marktüberkauf- und Überverkaufszustände, indem es Signale von zwei Dynamik-Oszillatoren kombiniert und potenzielle Handelsmöglichkeiten erfasst. Das System unterstützt die Periodenanpassung und kann die Handelszyklen flexibel an unterschiedliche Marktumgebungen anpassen.
Strategieprinzip
Die Kernlogik der Strategie beruht auf folgenden Schlüsselelementen: 1. Verwendet den 14-Perioden-RSI-Indikator, um die Preisdynamik zu berechnen 2. Benutzt den 14-Perioden-Stochastischen RSI zur sekundären Bestätigung 3. Trigger kaufen Signal, wenn der RSI unter 35 und Stochastic RSI unter 20 ist 4. Trigger verkaufen Signal, wenn der RSI über 70 und Stochastic RSI über 80 ist 5. Wird auf den stochastischen RSI eine 3-Perioden-SMA-Gleichung für die Signalstabilität angewendet 6. Unterstützt das Wechseln zwischen täglichen und wöchentlichen Zeitrahmen
Strategische Vorteile
- Doppelsignalbestätigungsmechanismus reduziert die Störungen durch falsches Signal erheblich
- Indikatorparameter können flexibel an die Marktvolatilität angepasst werden
- SMA-Gleichung verringert effektiv das Signalgeräusch
- Unterstützung des mehrjährigen Handels, um den Bedürfnissen verschiedener Anleger gerecht zu werden
- Visuelle Schnittstelle zeigt intuitiv Kauf/Verkauf-Signale für die Analyse an
- Klares Code-Struktur, leicht zu pflegen und weiterzuentwickeln
Strategische Risiken
- Kann in seitlichen Märkten übermäßige Handelssignale erzeugen
- Potenzielle Signalverzögerung bei schnellen Trendumkehrungen
- Falsche Einstellungen von Parametern können zu verpassten Handelsmöglichkeiten führen
- Bei hoher Marktvolatilität können falsche Signale auftreten
- Erfordert eine angemessene Einstellung von Stop-Loss für die Risikokontrolle
Strategieoptimierungsrichtlinien
- Einführung von Trendbeurteilungsindikatoren wie MACD oder EMA zur Verbesserung der Signalverlässlichkeit
- Zusätzliche Lautstärkungsfaktoren zur Verbesserung der Signalqualität
- Einführung dynamischer Stop-Loss-Mechanismen zur Optimierung des Risikomanagements
- Entwicklung eines anpassungsfähigen Parameteroptimierungssystems für die Strategie-Stabilität
- Erwägen Sie die Einbeziehung von Marktvolatilitätsindikatoren zur Optimierung des Handelszeitpunkts
Zusammenfassung
Die Strategie baut ein zuverlässiges Handelssystem auf, indem sie die Vorteile von RSI und Stochastic RSI kombiniert. Der Dual-Signal-Bestätigungsmechanismus reduziert effektiv falsche Signale, während flexible Parameter-Einstellungen eine starke Anpassungsfähigkeit bieten. Durch kontinuierliche Optimierung und Verbesserung zeigt sich die Strategie vielversprechend bei der Aufrechterhaltung einer stabilen Performance unter verschiedenen Marktbedingungen.
/*backtest
start: 2024-11-16 00:00:00
end: 2024-12-15 08:00:00
period: 1h
basePeriod: 1h
exchanges: [{"eid":"Futures_Binance","currency":"BTC_USDT"}]
*/

//@version=5
strategy("BTC Buy & Sell Strategy (RSI & Stoch RSI)", overlay=true)

// Input Parameters
rsi_length = input.int(14, title="RSI Length")
stoch_length = input.int(14, title="Stochastic Length")
stoch_smooth_k = input.int(3, title="Stochastic %K Smoothing")
stoch_smooth_d = input.int(3, title="Stochastic %D Smoothing")

// Threshold Inputs
rsi_buy_threshold = input.float(35, title="RSI Buy Threshold")
stoch_buy_threshold = input.float(20, title="Stochastic RSI Buy Threshold")
rsi_sell_threshold = input.float(70, title="RSI Sell Threshold")
stoch_sell_threshold = input.float(80, title="Stochastic RSI Sell Threshold")

use_weekly_data = input.bool(false, title="Use Weekly Data", tooltip="Enable to use weekly timeframe for calculations.")

// Timeframe Configuration
timeframe = use_weekly_data ? "W" : timeframe.period

// Calculate RSI and Stochastic RSI
rsi_value = request.security(syminfo.tickerid, timeframe, ta.rsi(close, rsi_length))
stoch_rsi_k_raw = request.security(syminfo.tickerid, timeframe, ta.stoch(close, high, low, stoch_length))
stoch_rsi_k = ta.sma(stoch_rsi_k_raw, stoch_smooth_k)
stoch_rsi_d = ta.sma(stoch_rsi_k, stoch_smooth_d)

// Define Buy and Sell Conditions
buy_signal = (rsi_value < rsi_buy_threshold) and (stoch_rsi_k < stoch_buy_threshold)
sell_signal = (rsi_value > rsi_sell_threshold) and (stoch_rsi_k > stoch_sell_threshold)

// Strategy Execution
if buy_signal
    strategy.entry("Long", strategy.long, comment="Buy Signal")

if sell_signal
    strategy.close("Long", comment="Sell Signal")

// Plot Buy and Sell Signals
plotshape(buy_signal, style=shape.labelup, location=location.belowbar, color=color.green, title="Buy Signal", size=size.small, text="BUY")
plotshape(sell_signal, style=shape.labeldown, location=location.abovebar, color=color.red, title="Sell Signal", size=size.small, text="SELL")

// Plot RSI and Stochastic RSI for Visualization
hline(rsi_buy_threshold, "RSI Buy Threshold", color=color.green)
hline(rsi_sell_threshold, "RSI Sell Threshold", color=color.red)

plot(rsi_value, color=color.blue, linewidth=2, title="RSI Value")
plot(stoch_rsi_k, color=color.purple, linewidth=2, title="Stochastic RSI K")
plot(stoch_rsi_d, color=color.orange, linewidth=1, title="Stochastic RSI D")
- Mehrindikator-Quantitative Handelsstrategie - Superindikator 7-in-1-Strategie
- Mehrindikatortrend mit RSI-Überkauft/Überverkauft
- Doppel gleitender Durchschnittskanaltrend nach Strategie
- Handelsstrategie für dynamische Multi-Indikator-Limitorder mit SMA-RSI-MACD
- Mehrzeitrahmen-EMA-Trend mit hoher Gewinnrate nach Strategie (Advanced)
- Quantitative lang-kurze Umschaltstrategie auf Basis von G-Kanal und EMA
- Dynamische Doppel gleitende Durchschnitts-Quantitative Handelsstrategie
- Multi-Indikator umfassende Handelsstrategie: Perfekte Kombination von Dynamik, Überkauf/Überverkauf und Volatilität
- Multi-Level Dynamic MACD Trend Following Strategy mit einem 52-Wochen-Hoch-/Niedrigverlängerungs-Analysesystem
- Multi-Strategie-Technische Analyse Handelssystem
- Doppel gleitender Durchschnittstrend nach Strategie mit Risikomanagement
- Triple Supertrend und Bollinger Bands Multi-Indikator Trend nach Strategie
- Quantitative Strategie für die Dynamik eines Multi-Trendline-Ausbruchs
- RSI-Momentum und ADX-Strength-Trend-basiertes Kapitalmanagementsystem
- Strategie für die Ermittlung der Liquidität im Pivot-Heatmap
- Mehrzeitrahmen-Trend nach Strategie mit ATR-basierter Gewinn- und Stop-Loss-Strategie
- Erweiterte Trendfolgestrategie mit adaptiver Trailing-Stop
- Multi-Technischer Indikator Trend nach Strategie mit RSI-Impulsfilter
- Dynamische Risikomanagement-Exponential Moving Average Crossover-Strategie
- Dual Exponential Moving Average und Relative Strength Index Crossover-Strategie
- Erweiterte Strategie zur Erfassung quantitativer Trends mit Dynamic Range Filter
- TradingView Signal-Ausführungspolitik (eingebettete HTTP-Dienstversion)
- Erweiterte Fünf-Tage-Kreuzanalyse-Strategie auf der Grundlage der Integration von RSI und MACD
- Adaptives Handelssystem auf Basis von doppelten RSI-Indikatoren
- Dynamische Doppelt-Supertrend-Volumen-Preis-Strategie
- Strategie zur Verfolgung der Volatilität des Schwarzen Schwanen und des gleitenden Durchschnitts
- Intelligente Handelsstrategie für Volatilitätsbereiche, die Bollinger-Bänder und SuperTrend kombiniert
- Synergetischer Trend mit mehreren Indikatoren nach Strategie mit dynamischem Stop-Loss-System
- Bollinger Bands Momentum Breakout Adaptiver Trend nach Strategie
- Erweiterte Mittelumkehrstrategie mit MACD-ATR-Implementierung