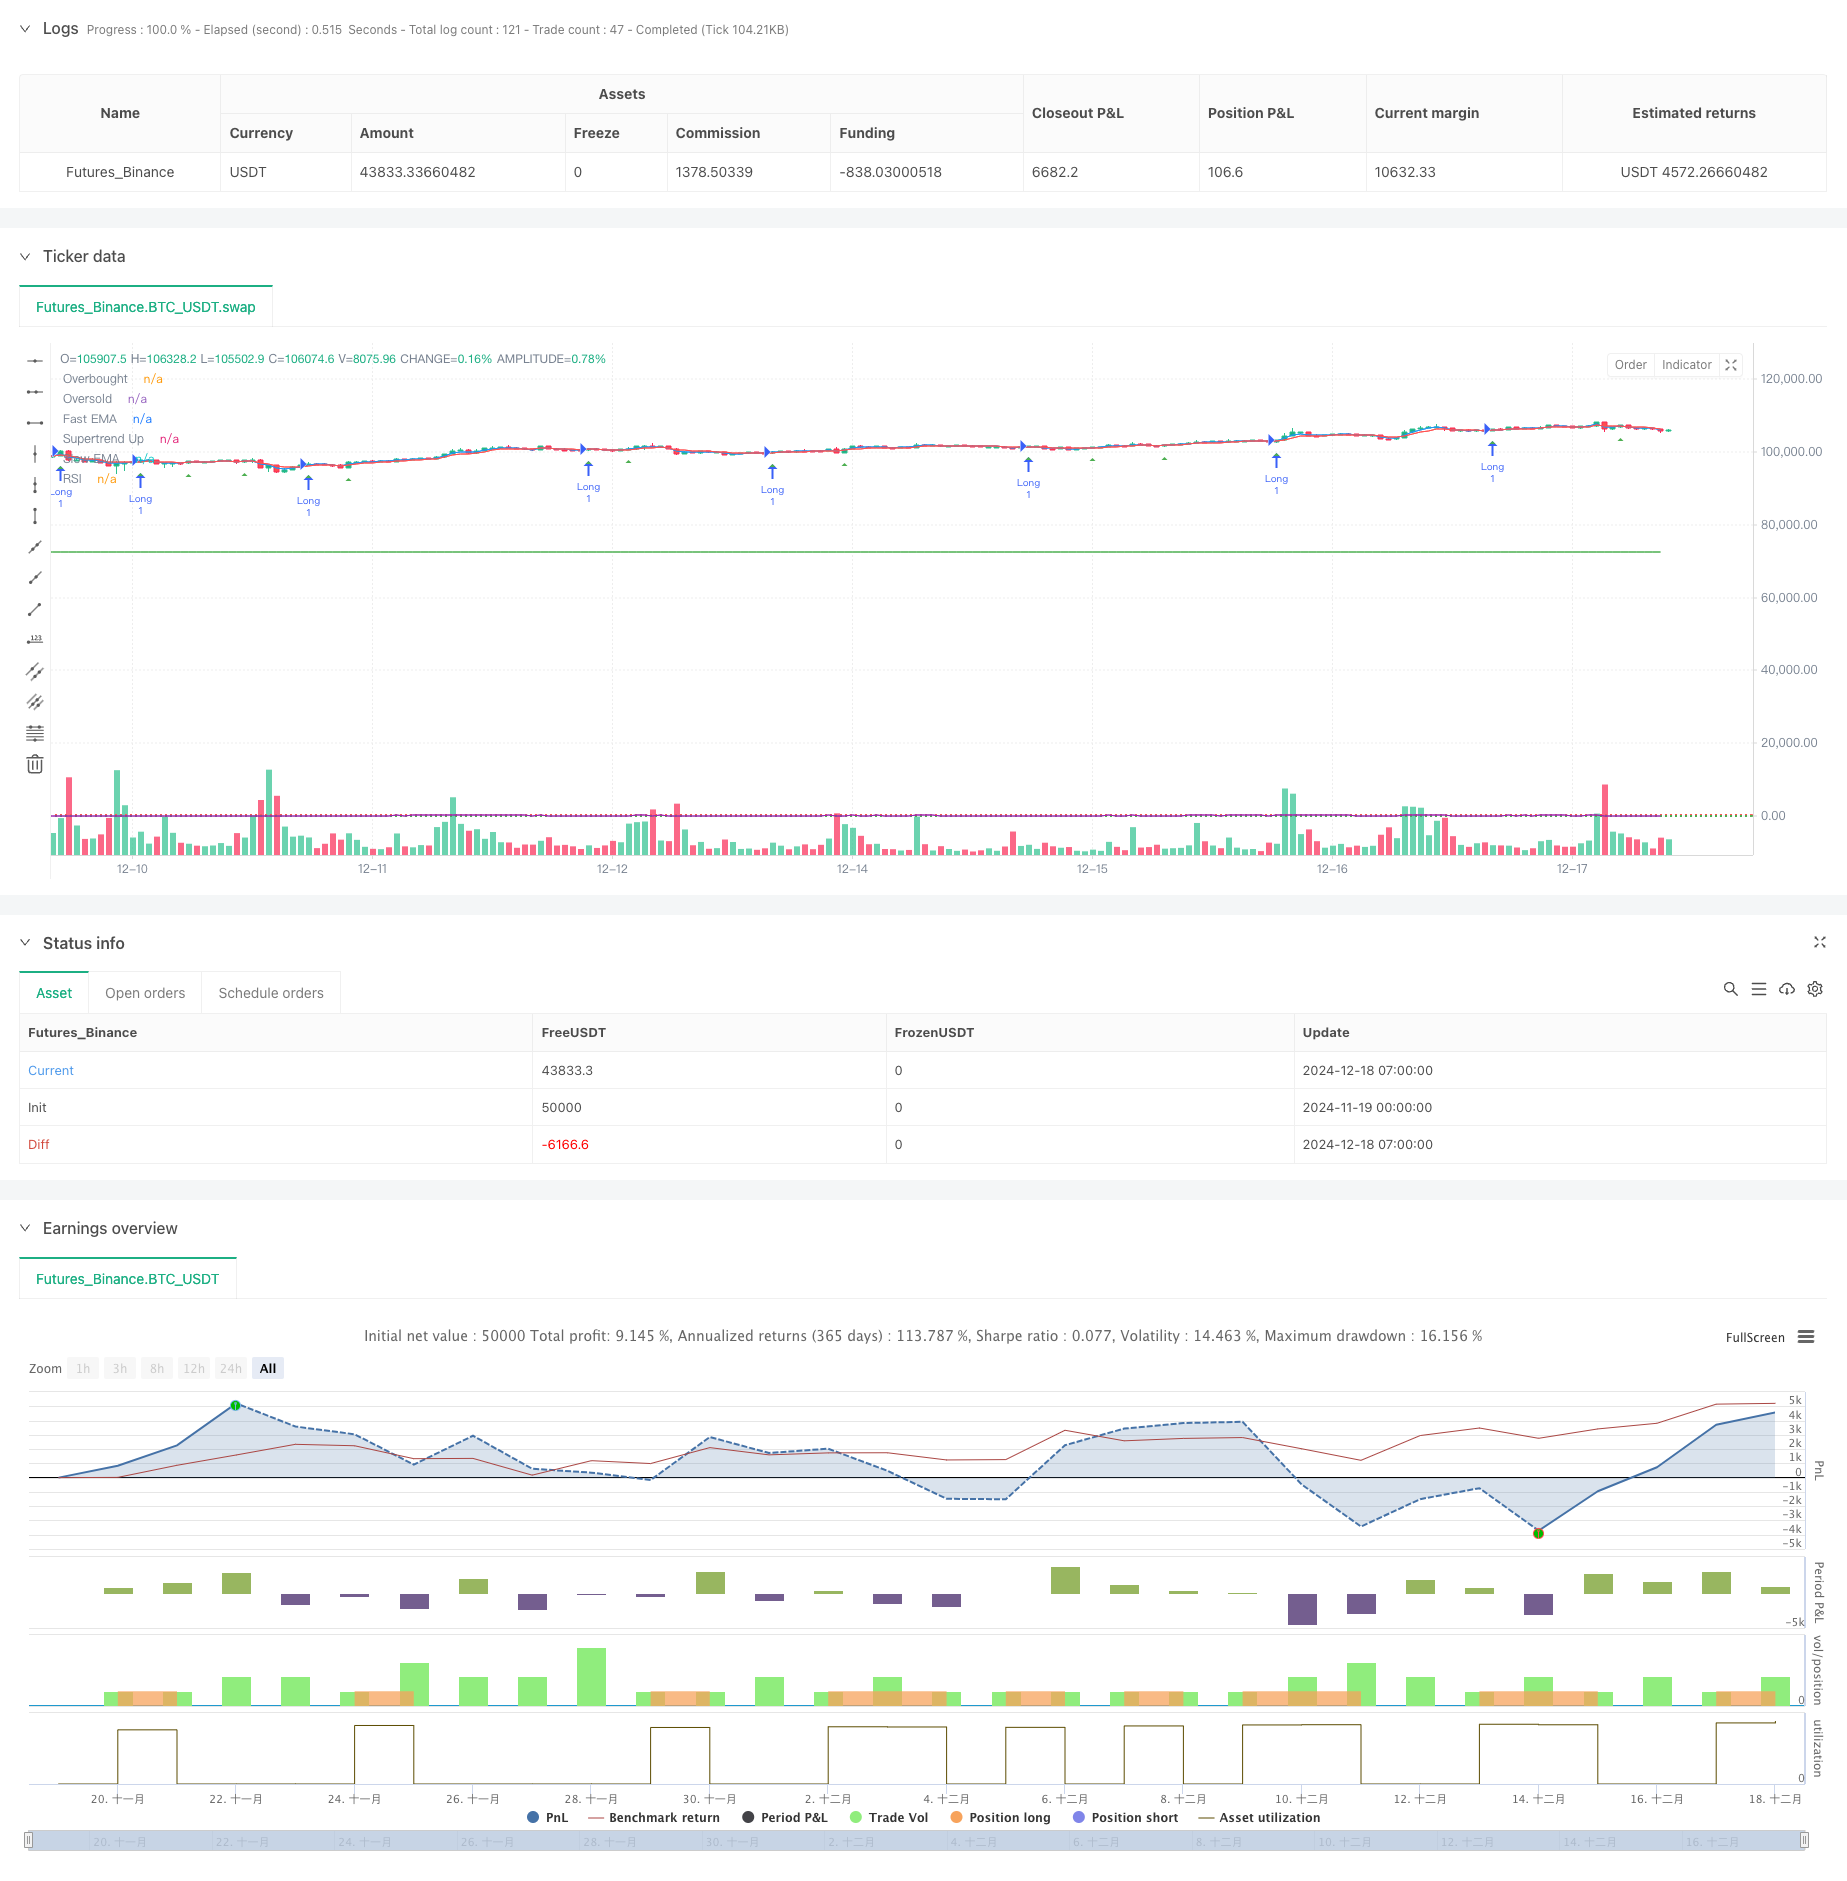
Überblick
Dies ist eine Trend-Tracking-Strategie, die mehrere technische Indikatoren kombiniert, die hauptsächlich schnelle und langsame Index-Moving Averages (EMA) -Kreuzungen, Supertrend-Trend-Indikatoren und relativ starke RSI-Indikatoren verwendet, um Handelschancen zu identifizieren. Die Strategie erhöht die Dynamik-Filterung auf der Grundlage des Trend-Trackings durch die organische Kombination von Indikatoren, während ATR verwendet wird, um die Stop-Loss-Position dynamisch anzupassen, um ein vollständiges Handelssystem zu erreichen.
Strategieprinzip
Die Strategie verwendet drei Filtermechanismen, um Handelssignale zu identifizieren:
- Die EMA-Kreuzungssysteme werden verwendet, um kurzfristige Trendänderungen zu erfassen. Sie erzeugen ein Mehrwertsignal, wenn ein schneller EMA über eine langsamere EMA geht, und ein Fehlwertsignal, wenn ein niedriger EMA über eine schnelle EMA geht.
- Der Supertrend-Indikator basiert auf der Berechnung von ATR-dynamischen Unterstützungs- / Widerstandslinien, um die Richtung des Gesamttrends zu bestimmen. Übertrieben ist nur erlaubt, wenn der Preis oberhalb der Supertrend-Linie liegt, und Untertrieben ist nur erlaubt, wenn er unterhalb der Linie liegt.
- Der RSI-Indikator dient dazu, überkaufte oder überverkaufte Marktsituationen zu filtern. Überkaufen ist nur erlaubt, wenn der RSI nicht in die Überkaufzone gelangt ist, und Kaufen ist nur erlaubt, wenn er nicht in die Überverkaufszone gelangt ist.
Die Strategie beinhaltet auch eine ATR-basierte dynamische Stop-Loss-Stopp-System, das die Risikomanagement-Parameter automatisch an die Marktvolatilität anpasst. Gleichzeitig wird die Handelsdauer durch einen Zeitfilter begrenzt, um den Handel während der niedrigen Liquidität zu vermeiden.
Strategische Vorteile
- Die Kombination von mehreren technischen Indikatoren bietet ein zuverlässigeres Handelssignal und verhindert die möglichen falschen Signale eines einzelnen Indikators.
- Die dynamische Stop-Loss-Einstellung ist in der Lage, sich an unterschiedliche Marktschwankungen anzupassen und den Handel bei größerer Volatilität mehr Luft zu geben.
- Der RSI-Filter reduziert das Risiko, in extreme Marktsituationen einzutreten.
- Die Zeitfilterfunktion ermöglicht es dem Händler, sich auf bestimmte Handelszeiten zu konzentrieren und zu verhindern, dass die Handelszeiten ineffizient sind.
Strategisches Risiko
- Mehrfache Filterbedingungen können dazu führen, dass potenzielle Handelschancen verpasst werden.
- In schnelllebigen Märkten kann ein Stop-Loss leicht berührt werden.
- Übermäßige Optimierung der Parameter kann zu Problemen mit der Überpassung führen.
- Hochfrequente Transaktionen können zu höheren Transaktionskosten führen.
Richtung der Strategieoptimierung
- Die Erhöhung des Umsatzvolumens kann als zusätzliche Bestätigung in Betracht gezogen werden.
- Die Einführung von Anpassungsmechanismen für die Anpassung von Parametern ermöglicht eine bessere Anpassung der Strategie an unterschiedliche Marktbedingungen.
- Ein Trendstärkenfilter wird hinzugefügt, um übermäßigen Handel in schwachen Märkten zu vermeiden.
- Entwicklung eines intelligenten Positionsmanagementsystems, das den Anteil der Positionen an die Marktentwicklung anpasst.
Zusammenfassen
Die Strategie baut durch die Kombination mehrerer technischer Kennzahlen und Filterbedingungen ein relativ vollständiges Handelssystem auf. Ihre Kernvorteile liegen in der Mehrfachbestätigungsmechanik und dem dynamischen Risikomanagement, aber auch in der Optimierung der Parameter und der Kosten für den Handel. Durch kontinuierliche Optimierung und Verbesserung wird die Strategie eine stabile Leistung in verschiedenen Marktumgebungen aufweisen.
/*backtest
start: 2024-11-19 00:00:00
end: 2024-12-18 08:00:00
period: 1h
basePeriod: 1h
exchanges: [{"eid":"Futures_Binance","currency":"BTC_USDT"}]
*/

//@version=5
strategy(title="Supertrend + EMA Crossover with RSI Filter", shorttitle="ST_EMA_RSI", overlay=true)

// Input parameters for EMA
fastEMA          = input.int(3,  title="Fast EMA Period", minval=1)
slowEMA          = input.int(6,  title="Slow EMA Period", minval=1)
atrLength        = input.int(3,  title="ATR Length", minval=1)

// Using a fixed multiplier for Supertrend calculation
stMultiplier = 1

// Stop loss and take profit multipliers
stopLossATR      = input.float(2.5, title="Stop Loss ATR Multiplier", minval=0.1, step=0.1)
takeProfitATR    = input.float(4,   title="Take Profit ATR Multiplier", minval=0.1, step=0.1)

// RSI inputs
rsiLength      = input.int(10, title="RSI Length", minval=1)
rsiOverbought  = input.float(65, title="RSI Overbought Level", minval=50.0, maxval=100.0)
rsiOversold    = input.float(30.0, title="RSI Oversold Level",   minval=0.0, maxval=50.0)

// Declare the RSI plot toggle input as a global variable
bool rsiPlotEnabled = input.bool(true, title="Show RSI in separate panel")

// Time filter inputs
i_startTime = input(title="Start Filter", defval=timestamp("01 Jan 2023 13:30 +0000"), group="Time Filter", tooltip="Start date & time to begin searching for setups")
i_endTime   = input(title="End Filter",   defval=timestamp("28 Apr 2099 19:30 +0000"), group="Time Filter", tooltip="End date & time to stop searching for setups")

// Date/time filtering logic
inDateRange = true

// Calculate EMAs
fastEMALine = ta.ema(close, fastEMA)
slowEMALine = ta.ema(close, slowEMA)

// Calculate ATR
atr = ta.atr(atrLength)

// Calculate Supertrend using fixed multiplier
up = high - (stMultiplier * atr)
dn = low +  (stMultiplier * atr)

var float trendUp = na
var float trendDown = na
var int trend = na

trendUp   := na(trendUp[1])   ? up : (close[1] > trendUp[1]   ? math.min(up, trendUp[1])   : up)
trendDown := na(trendDown[1]) ? dn : (close[1] < trendDown[1] ? math.max(dn, trendDown[1]) : dn)

trend := close > nz(trendUp[1]) ? 1 : close < nz(trendDown[1]) ? -1 : nz(trend[1], 1)
supertrend = trend == 1 ? trendUp : trendDown

// Calculate RSI
myRSI = ta.rsi(close, rsiLength)

// Entry conditions with RSI filter
longEntryCondition  = ta.crossover(fastEMALine, slowEMALine) and (trend == 1) and (myRSI < rsiOverbought)
shortEntryCondition = ta.crossunder(fastEMALine, slowEMALine) and (trend == -1) and (myRSI > rsiOversold)

// Strategy entries
if inDateRange and longEntryCondition and strategy.position_size <= 0
    strategy.entry("Long", strategy.long)

if inDateRange and shortEntryCondition and strategy.position_size >= 0
    strategy.entry("Short", strategy.short)

// Stops and targets
if strategy.position_size > 0
    longStopLoss   = strategy.position_avg_price - stopLossATR * atr
    longTakeProfit = strategy.position_avg_price + takeProfitATR * atr
    strategy.exit("Long SL/TP", "Long", stop=longStopLoss, limit=longTakeProfit)

if strategy.position_size < 0
    shortStopLoss   = strategy.position_avg_price + stopLossATR * atr
    shortTakeProfit = strategy.position_avg_price - takeProfitATR * atr
    strategy.exit("Short SL/TP", "Short", stop=shortStopLoss, limit=shortTakeProfit)

// Plot EMAs and Supertrend
plot(fastEMALine, title="Fast EMA", color=color.new(color.blue, 0))
plot(slowEMALine, title="Slow EMA", color=color.new(color.red, 0))
plot(trend == 1 ? supertrend : na, title="Supertrend Up", color=color.green, style=plot.style_linebr)
plot(trend == -1 ? supertrend : na, title="Supertrend Down", color=color.red, style=plot.style_linebr)

// Plot RSI and hlines
plot(rsiPlotEnabled ? myRSI : na, title="RSI", color=color.new(color.purple, 0))
hline(rsiOverbought, "Overbought", color=color.red, linestyle=hline.style_dotted)
hline(rsiOversold,   "Oversold",   color=color.green, linestyle=hline.style_dotted)

// Plot entry signals
plotshape(longEntryCondition, title="Long Entry Signal", style=shape.triangleup, location=location.belowbar, size=size.tiny, color=color.new(color.green, 0))
plotshape(shortEntryCondition, title="Short Entry Signal", style=shape.triangledown, location=location.abovebar, size=size.tiny, color=color.new(color.red, 0))