Overview
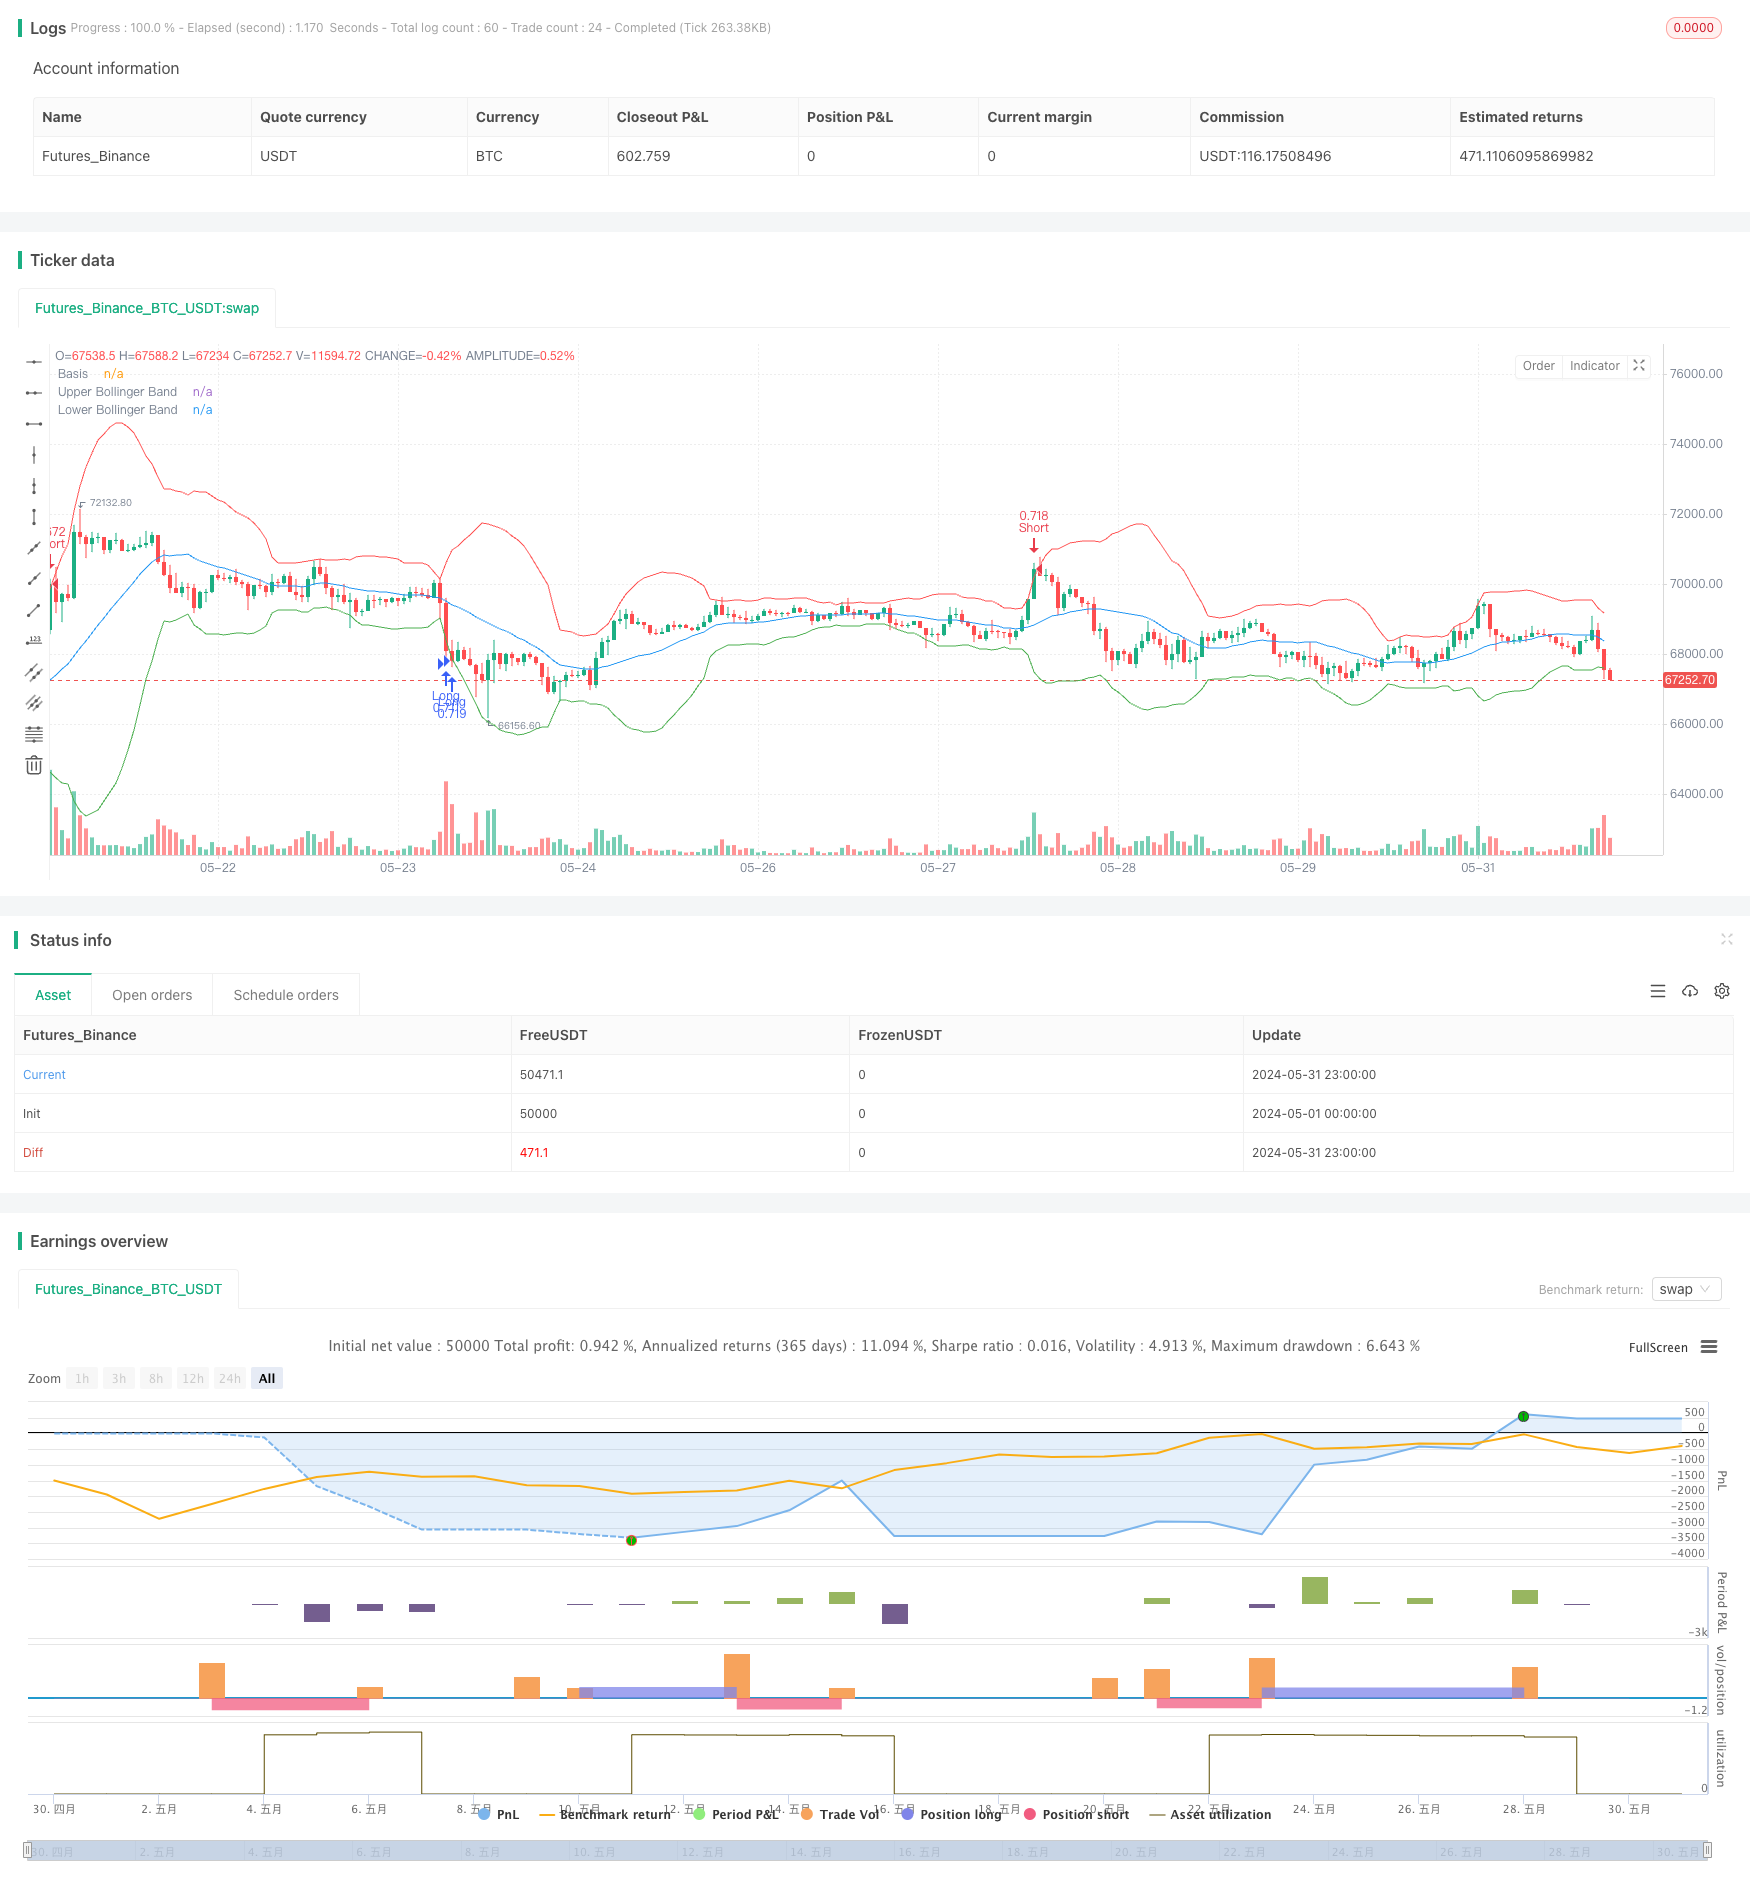
This strategy combines three technical indicators: Bollinger Bands, Relative Strength Index (RSI), and Stochastic RSI. By analyzing price volatility and momentum, it aims to identify overbought and oversold market conditions to determine optimal entry and exit points. The strategy simulates options trading with 20x leverage, sets a 0.60% take-profit and a 0.25% stop-loss, and limits trading to once per day to manage risk.
Strategy Principle
The core of this strategy lies in using Bollinger Bands, RSI, and Stochastic RSI to assess market conditions. Bollinger Bands consist of a middle band (20-period simple moving average), an upper band (3 standard deviations above the middle band), and a lower band (3 standard deviations below the middle band), measuring price volatility. RSI is a momentum oscillator used to identify overbought and oversold conditions, with a 14-period length in this strategy. Stochastic RSI applies the Stochastic Oscillator formula to RSI values, also using a 14-period length.
A long signal is triggered when the RSI is below 34, the Stochastic RSI is below 20, and the close price is at or below the lower Bollinger Band. A short signal is triggered when the RSI is above 66, the Stochastic RSI is above 80, and the close price is at or above the upper Bollinger Band. The strategy uses 20x leverage to simulate options trading, with a 0.60% take-profit and a 0.25% stop-loss. Furthermore, it limits trading to once per day to control risk.
Strategy Advantages
- Multi-indicator approach: The strategy considers both price volatility (Bollinger Bands) and momentum (RSI and Stochastic RSI), providing a more comprehensive market analysis.
- Risk management: The strategy sets clear take-profit and stop-loss levels and limits trading to once per day, effectively managing risk exposure.
- Adaptability: By adjusting parameters such as the standard deviation multiplier for Bollinger Bands and the thresholds for RSI and Stochastic RSI, the strategy can adapt to various market conditions.
Strategy Risks
- Market risk: The strategy’s performance depends on market conditions and may underperform during unclear trends or extremely high volatility.
- Parameter sensitivity: The strategy’s effectiveness relies on the quality of chosen parameters, and improper settings may lead to suboptimal performance.
- Leverage risk: The strategy employs 20x leverage, which can amplify gains but also magnify losses. In extreme market conditions, high leverage may result in significant losses.
Strategy Optimization Directions
- Dynamic parameter adjustment: Dynamically adjust parameters such as the standard deviation multiplier for Bollinger Bands and the thresholds for RSI and Stochastic RSI based on changing market conditions to adapt to different environments.
- Additional indicators: Consider incorporating other technical indicators like MACD or ADX to enhance the strategy’s reliability and stability.
- Optimize take-profit and stop-loss: Through backtesting and optimization, find the optimal take-profit and stop-loss ratios to maximize returns while managing risk.
- Improve money management: Explore more advanced money management techniques, such as the Kelly Criterion, to optimize the strategy’s long-term performance.
Summary
This strategy combines Bollinger Bands, RSI, and Stochastic RSI to identify optimal entry and exit points by leveraging price volatility and momentum information. It sets clear take-profit and stop-loss levels and controls the number of daily trades to manage risk. Despite its advantages, the strategy faces challenges such as market risk, parameter sensitivity, and leverage risk. Further optimization can be achieved through dynamic parameter adjustment, incorporating additional indicators, optimizing take-profit and stop-loss, and improving money management techniques.
/*backtest
start: 2024-05-01 00:00:00
end: 2024-05-31 23:59:59
period: 1h
basePeriod: 15m
exchanges: [{"eid":"Futures_Binance","currency":"BTC_USDT"}]
*/

//@version=5
strategy("Bollinger Bands + RSI + Stochastic RSI Strategy with OTM Options", overlay=true)
// Define leverage factor (e.g., 20x leverage for OTM options)
leverage = 1
// Bollinger Bands
length = 20
deviation = 3
basis = ta.sma(close, length)
dev = ta.stdev(close, length)
upper = basis + deviation * dev
lower = basis - deviation * dev
// RSI
rsi_length = 14
rsi = ta.rsi(close, rsi_length)
// Stochastic RSI
stoch_length = 14
stoch_k = ta.stoch(close, close, close, stoch_length)
// Entry condition with Bollinger Bands
longCondition = rsi < 34 and stoch_k < 20 and close <= lower
shortCondition = rsi > 66 and stoch_k > 80 and close >= upper
// Plot Bollinger Bands
plot(basis, color=color.blue, title="Basis")
plot(upper, color=color.red, title="Upper Bollinger Band")
plot(lower, color=color.green, title="Lower Bollinger Band")
// Track if a trade has been made today
var int lastTradeDay = na
// Options Simulation: Take-Profit and Stop-Loss Conditions
profitPercent = 0.01    // 1% take profit
lossPercent = 0.002  // 0.2% stop loss
// Entry Signals
if (dayofmonth(timenow) != dayofmonth(lastTradeDay))
    if (longCondition)
        longTakeProfitPrice = close * (1 + profitPercent)
        longStopLossPrice = close * (1 - lossPercent)
        strategy.entry("Long", strategy.long, qty=leverage * strategy.equity / close)
        strategy.exit("Take Profit Long", from_entry="Long", limit=longTakeProfitPrice, stop=longStopLossPrice)
        lastTradeDay := dayofmonth(timenow)
    if (shortCondition)
        shortTakeProfitPrice = close * (1 - profitPercent)
        shortStopLossPrice = close * (1 + lossPercent)
        strategy.entry("Short", strategy.short, qty=leverage * strategy.equity / close)
        strategy.exit("Take Profit Short", from_entry="Short", limit=shortTakeProfitPrice, stop=shortStopLossPrice)
        lastTradeDay := dayofmonth(timenow)