Overview
This strategy is a comprehensive trading system that combines support and resistance lines, moving average crossovers, and price breakouts. It utilizes the crossover of short-term and long-term moving averages to determine market trends, while using dynamic support and resistance lines to identify key price levels. When the price breaks through these key levels and the moving averages signal, the strategy executes buy or sell operations. This approach aims to capture trend changes in the market while reducing the risk of false signals through multiple confirmations.
Strategy Principles
Moving Average Crossover: The strategy uses 9-period and 21-period Simple Moving Averages (SMA). A bullish signal is generated when the short-term SMA crosses above the long-term SMA, and a bearish signal when it crosses below.
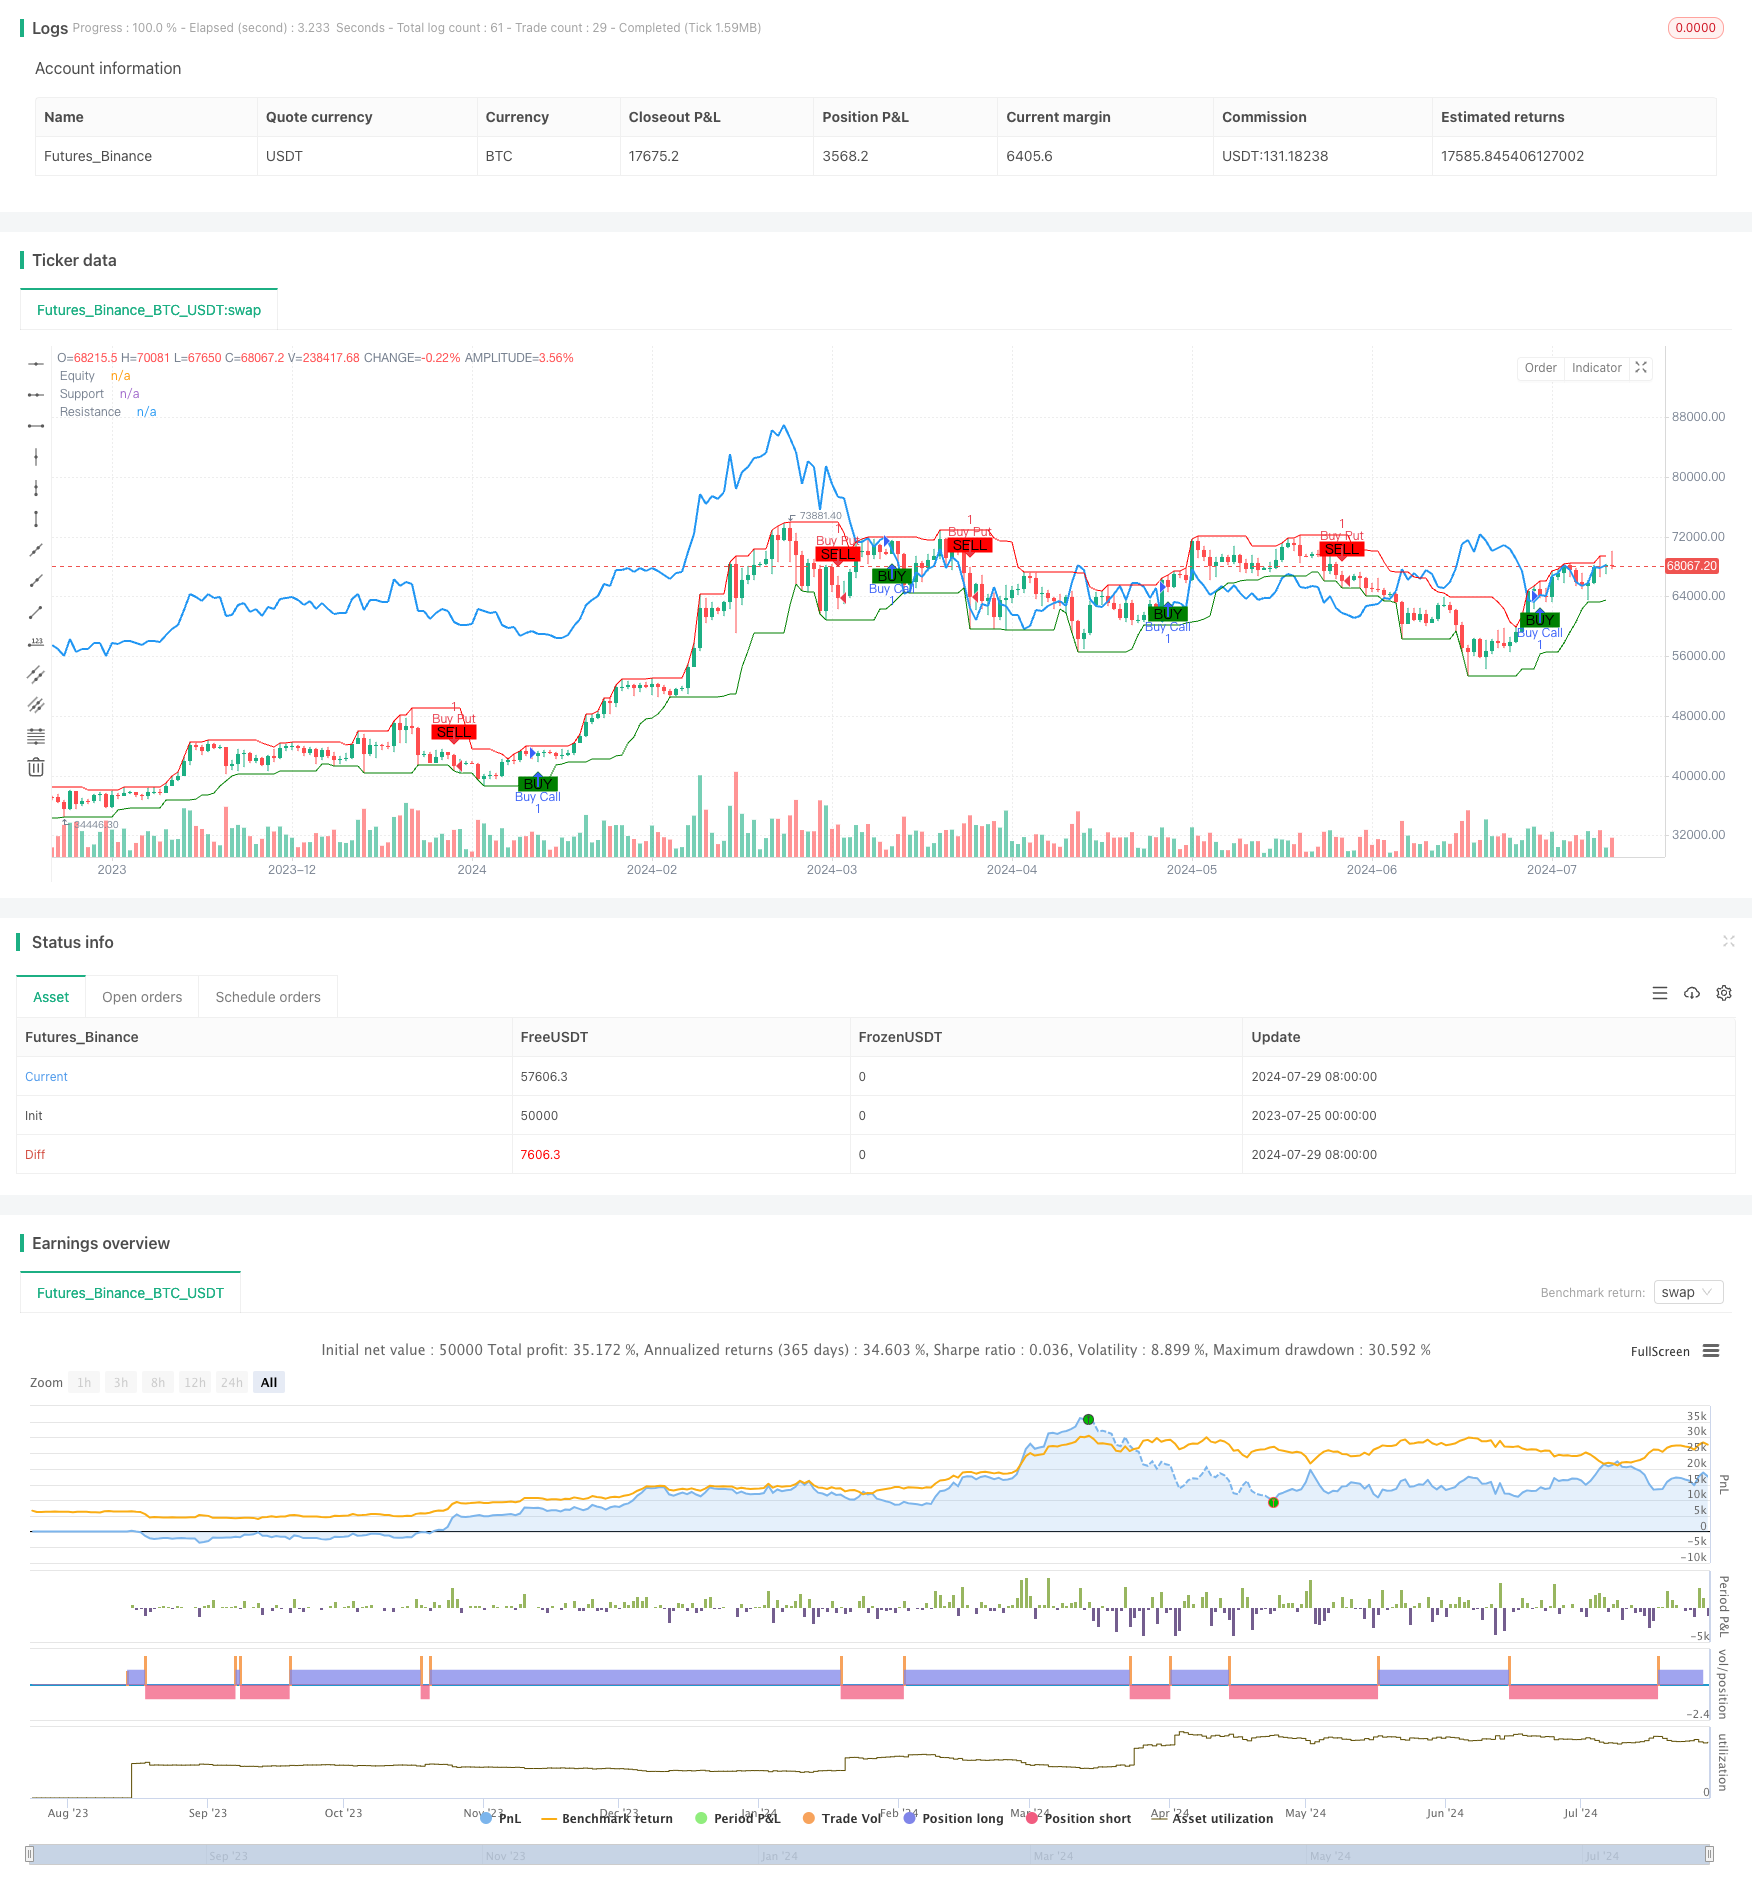
Dynamic Support and Resistance Lines: The strategy calculates dynamic support and resistance levels using the lowest and highest prices within a 9-period window. These levels continually adjust with market fluctuations, providing reference points that closely reflect current market conditions.
Price Confirmation: In addition to moving average crossovers, the strategy requires the price to be above or below key levels. Specifically, a buy signal requires the closing price to be above the support level, while a sell signal requires it to be below the resistance level.
Signal Generation: Trading signals are only generated when both the moving average crossover and price confirmation criteria are met. This multiple confirmation mechanism helps reduce false signals.
Trade Execution: The strategy enters a long position on a buy signal and a short position on a sell signal. It also closes existing positions when opposite signals appear.
Strategy Advantages
Multiple Confirmation Mechanism: By combining moving average crossovers and price breakouts, the strategy reduces the likelihood of false signals, enhancing trade reliability.
Dynamic Market Adaptation: The use of dynamic support and resistance lines allows the strategy to adapt to different market environments, whether trending or range-bound.
Trend Following: Moving average crossovers help capture medium to long-term trends, enabling the strategy to profit from strong market movements.
Risk Management: The strategy incorporates a degree of risk control by promptly closing positions when opposite signals appear.
Visualization: The strategy annotates support and resistance lines and trading signals on the chart, allowing traders to intuitively understand market dynamics and strategy logic.
Strategy Risks
Frequent Trading in Ranging Markets: In sideways markets, moving averages may frequently cross, leading to excessive trading and unnecessary transaction costs.
Lag: Moving averages are inherently lagging indicators and may miss trading opportunities in the early stages of trend reversals.
False Breakout Risk: Situations where price briefly breaks through support or resistance lines before retracing may lead to false signals.
Lack of Stop-Loss Mechanism: The current strategy does not have explicit stop-loss settings, potentially exposing it to significant risk in extreme market conditions.
Over-reliance on Technical Indicators: The strategy is entirely based on technical indicators, neglecting other important factors such as fundamentals and market sentiment.
Strategy Optimization Directions
Introduce Volatility Filter: Consider adding an ATR (Average True Range) indicator to adjust trading parameters or pause trading during high volatility, adapting to different market environments.
Optimize Moving Average Parameters: Experiment with Exponential Moving Averages (EMA) or other types of moving averages to reduce lag. Also, optimize moving average periods through backtesting.
Add Trend Strength Confirmation: Incorporate indicators like RSI (Relative Strength Index) or ADX (Average Directional Index) to execute trades only when trends are clear, reducing false signals in ranging markets.
Implement Stricter Entry Conditions: Require price not only to break through support/resistance lines but also to maintain a certain distance or duration, filtering out short-term false breakouts.
Add Stop-Loss and Profit-Taking Mechanisms: Set stop-loss points based on ATR or fixed percentages, and introduce trailing stops or support/resistance-based profit-taking mechanisms for better risk control and profit locking.
Consider Volume Factors: Use volume as additional confirmation for trading signals, executing trades only when volume supports the move, to improve signal reliability.
Optimize Support/Resistance Line Calculation: Experiment with longer-term high/low points or incorporate Fibonacci retracement levels to determine more meaningful support and resistance levels.
Introduce Time Filters: Consider market time characteristics, such as avoiding volatile periods at market open and close, or executing the strategy only during specific trading sessions.
Conclusion
The Dynamic Support-Resistance Breakout Moving Average Crossover Strategy is a trading system that integrates multiple technical analysis concepts. By combining moving average crossovers and dynamic support and resistance lines, this strategy aims to capture market trend changes while enhancing trade signal reliability through multiple confirmation mechanisms. Although the strategy boasts advantages such as strong adaptability and built-in risk control, it still faces challenges like frequent trading in ranging markets and inherent lag.
To further optimize the strategy, consider introducing volatility filters, optimizing moving average parameters, adding trend strength confirmation, and other methods. Additionally, implementing stricter entry conditions, perfecting stop-loss and profit-taking mechanisms, and considering volume factors could significantly improve the strategy’s effectiveness.
Finally, it’s crucial to recognize that no strategy is perfect or suitable for all market environments. Traders using this strategy should combine it with their own risk tolerance and market insights, continuously backtesting and optimizing to adapt to ever-changing market conditions. Moreover, this strategy should be part of an overall trading system, integrated with other analysis methods and risk management techniques to achieve long-term stable returns in the financial markets.
/*backtest
start: 2023-07-25 00:00:00
end: 2024-07-30 00:00:00
period: 1d
basePeriod: 1h
exchanges: [{"eid":"Futures_Binance","currency":"BTC_USDT"}]
*/

//@version=5
strategy("Bank Nifty Intraday Strategy", overlay=true)

// Input parameters
shortPeriod = input.int(9, title="Short Moving Average Period")
longPeriod = input.int(21, title="Long Moving Average Period")
resistanceColor = input.color(color.red, title="Resistance Line Color")
supportColor = input.color(color.green, title="Support Line Color")
lineWidth = input.int(1, title="Line Width", minval=1, maxval=5)
buySignalColor = input.color(color.green, title="Buy Signal Color")
sellSignalColor = input.color(color.red, title="Sell Signal Color")

// Calculate moving averages
shortMA = ta.sma(close, shortPeriod)
longMA = ta.sma(close, longPeriod)

// Detecting Support and Resistance
support = ta.lowest(low, shortPeriod)
resistance = ta.highest(high, shortPeriod)

// Plotting support and resistance lines
plot(support, color=supportColor, linewidth=lineWidth, title="Support")
plot(resistance, color=resistanceColor, linewidth=lineWidth, title="Resistance")

// Buy and Sell signals based on crossover and crossunder
buySignal = ta.crossover(shortMA, longMA) and close > support
sellSignal = ta.crossunder(shortMA, longMA) and close < resistance

// Plotting Buy and Sell signals
plotshape(series=buySignal, title="Buy Signal", location=location.belowbar, color=buySignalColor, style=shape.labelup, text="BUY", size=size.small)
plotshape(series=sellSignal, title="Sell Signal", location=location.abovebar, color=sellSignalColor, style=shape.labeldown, text="SELL", size=size.small)

// Execution logic for strategy
if (buySignal)
    strategy.entry("Buy Call", strategy.long)
if (sellSignal)
    strategy.entry("Buy Put", strategy.short)

// Exit conditions
if (strategy.opentrades > 0)
    strategy.close("Buy Call", when=sellSignal)
if (strategy.opentrades < 0)
    strategy.close("Buy Put", when=buySignal)

// Plotting profit and loss on chart
plot(strategy.equity, title="Equity", color=color.blue, linewidth=2)