Supertrend and EMA Crossover Quantitative Trading Strategy
Author: ChaoZhang, Date: 2024-07-31 14:43:38Tags: STEMAATR
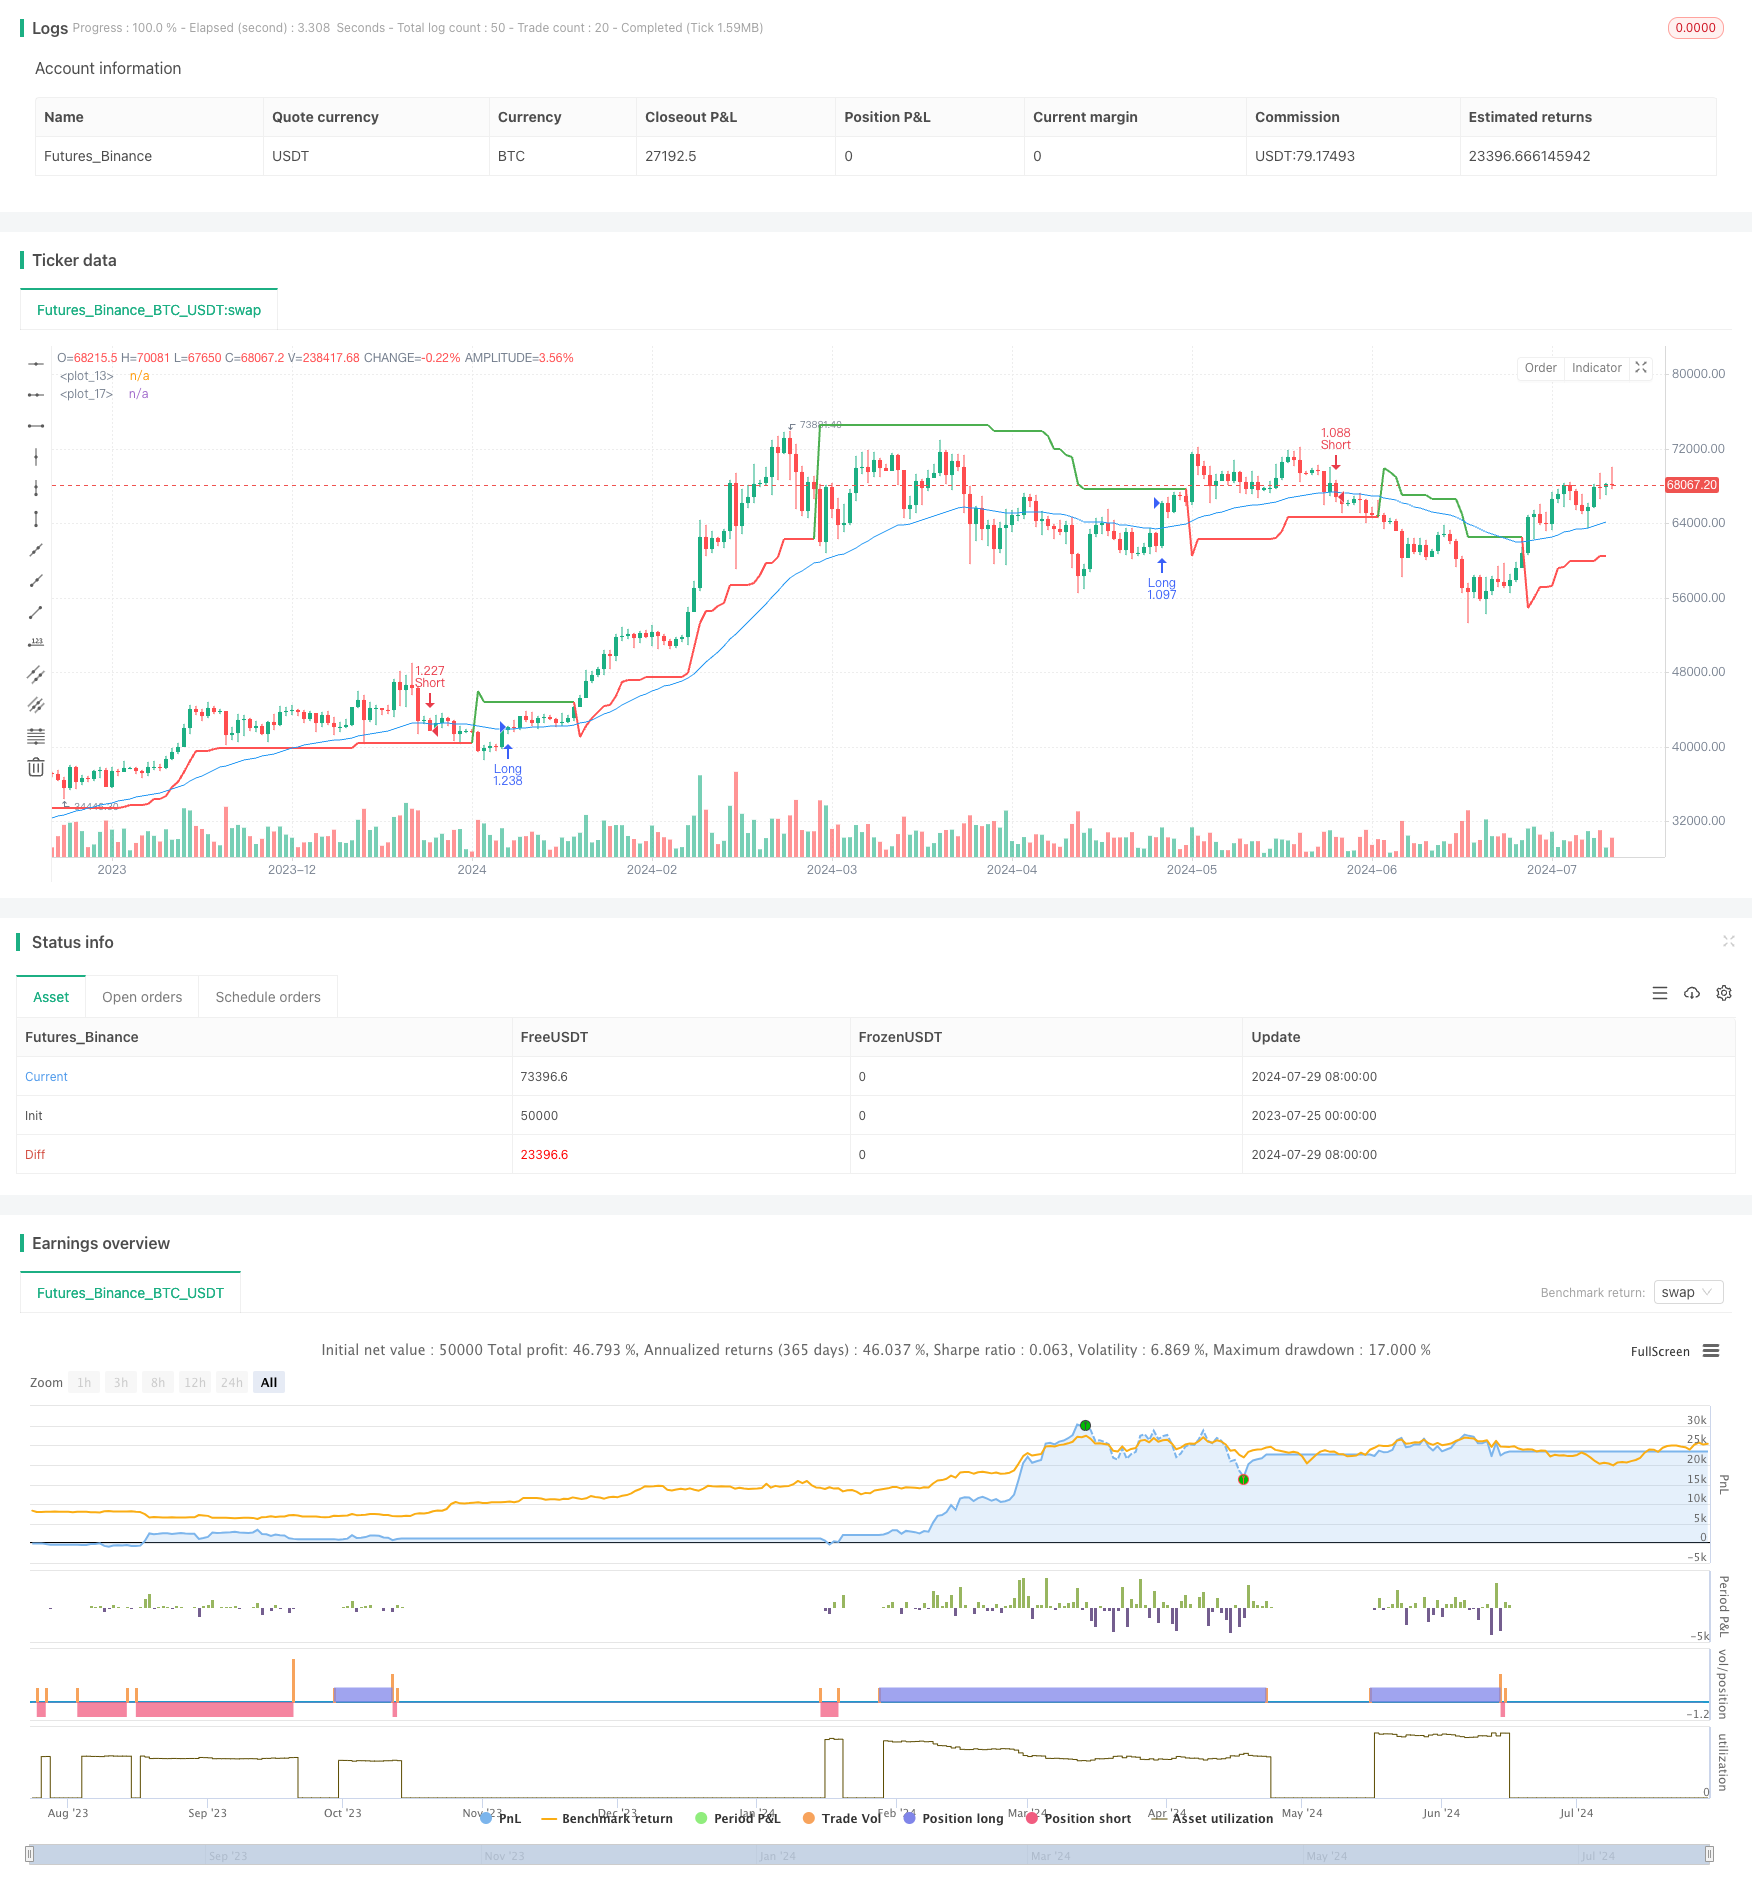
Overview
This article introduces a quantitative trading strategy based on the Supertrend indicator and Exponential Moving Average (EMA) crossover. The strategy combines the advantages of trend following and moving average crossovers, aiming to capture market trends and execute trades at trend reversals. The strategy uses the Supertrend indicator to identify the overall trend direction while utilizing a 44-period EMA as a reference line for entry and exit points. By setting 1% take profit and stop loss levels, the strategy effectively controls risk and locks in profits.
Strategy Principles
Supertrend Indicator Calculation:
- Uses a 10-period ATR (Average True Range) and a factor of 3.0 to calculate the Supertrend.
- The Supertrend direction is used to determine the overall trend (positive for uptrend, negative for downtrend).
44-period EMA Calculation:
- Calculates the Exponential Moving Average using 44 periods of closing prices.
Entry Conditions:
- Long Entry: Price crosses above the 44 EMA and Supertrend direction is positive.
- Short Entry: Price crosses below the 44 EMA and Supertrend direction is negative.
Exit Conditions:
- Uses the strategy.exit function to set 1% take profit and 1% stop loss.
- Long: Take profit at 101% of entry price, stop loss at 99% of entry price.
- Short: Take profit at 99% of entry price, stop loss at 101% of entry price.
Position Management:
- Uses strategy.risk.max_position_size(1) to limit maximum position size to 1.
Strategy Advantages
Combination of Trend Following and Moving Average Crossover:
- Supertrend provides overall trend direction, reducing counter-trend trades.
- EMA crossover offers more precise entry timing, improving trade success rate.
Risk Control:
- Fixed percentage take profit and stop loss effectively control risk for each trade.
- Maximum position size limit prevents excessive leverage.
High Adaptability:
- Can be adapted to different markets and timeframes by adjusting Supertrend and EMA parameters.
Automated Trading:
- Strategy can be automatically executed on the TradingView platform, reducing manual intervention.
Clear Trading Signals:
- Entry and exit conditions are well-defined, easy to understand and execute.
Strategy Risks
Poor Performance in Ranging Markets:
- May generate frequent false signals in sideways or choppy markets, leading to consecutive losses.
Lagging Nature:
- Both EMA and Supertrend are lagging indicators, potentially missing early stages of trends.
Limitations of Fixed Take Profit and Stop Loss:
- 1% fixed take profit and stop loss may not be suitable for all market conditions, especially in highly volatile markets.
Over-reliance on Technical Indicators:
- Doesn’t consider fundamental factors and market sentiment, may underperform during significant news or events.
Drawdown Risk:
- 1% stop loss may lead to premature exit from favorable trades in strong trends.
Strategy Optimization Directions
Dynamic Take Profit and Stop Loss:
- Consider using ATR or volatility percentages to set dynamic take profit and stop loss levels to adapt to different market conditions.
Add Filters:
- Introduce volume, volatility, or other technical indicators as additional filtering conditions to reduce false signals.
Multi-Timeframe Analysis:
- Incorporate trend analysis from higher timeframes to improve trade direction accuracy.
Parameter Optimization:
- Backtest different Supertrend and EMA parameters using historical data to find the optimal combination.
Incorporate Fundamental Analysis:
- Consider important economic data releases or company earnings reports, adjusting the strategy during specific periods.
Improve Position Management:
- Implement more sophisticated position sizing strategies, such as percentage of account equity or Kelly criterion.
Add Trend Strength Filter:
- Use ADX or similar indicators to assess trend strength, trading only in strong trends.
Conclusion
The Supertrend and EMA Crossover Quantitative Trading Strategy is an automated trading system that combines trend following with moving average crossovers. By using the Supertrend indicator to identify overall trend direction and the 44-period EMA crossover for specific entry and exit signals, the strategy aims to capture medium to long-term market trends. The 1% fixed take profit and stop loss settings provide a risk management framework for the strategy but may also limit its performance in highly volatile markets.
The main advantages of this strategy lie in its clear trading logic and automated execution capability, making it suitable for investors seeking a systematic trading approach. However, the strategy also has potential risks, such as poor performance in ranging markets and over-reliance on technical indicators.
To further enhance the strategy’s robustness and adaptability, consider introducing dynamic take profit and stop loss mechanisms, multi-timeframe analysis, additional filtering conditions, and more sophisticated position management techniques. Additionally, incorporating fundamental analysis and market sentiment indicators may help improve the overall performance of the strategy.
In conclusion, this is a basic but potentially powerful quantitative trading strategy that, with continuous optimization and testing, could become a reliable automated trading system. Investors using this strategy should fully understand its strengths and limitations, making appropriate adjustments based on individual risk tolerance and market conditions.
/*backtest
start: 2023-07-25 00:00:00
end: 2024-07-30 00:00:00
period: 1d
basePeriod: 1h
exchanges: [{"eid":"Futures_Binance","currency":"BTC_USDT"}]
*/

// This Pine Script™ code is subject to the terms of the Mozilla Public License 2.0 at https://mozilla.org/MPL/2.0/
// © ANKITKEDIA2022

//@version=5
strategy("Supertrend and 44 EMA Strategy", overlay=true, default_qty_type=strategy.percent_of_equity, default_qty_value=100)

// Inputs for Supertrend
atrPeriod = input.int(10, title="ATR Period")
factor = input.float(3.0, title="Factor")

// Supertrend calculation
[supertrend, direction] = ta.supertrend(factor, atrPeriod)
plot(supertrend, color=direction > 0 ? color.green : color.red, linewidth=2)

// 44 EMA calculation
ema44 = ta.ema(close, 44)
plot(ema44, color=color.blue, linewidth=1)

// Entry and exit conditions
longCondition = ta.crossover(close, ema44) and direction > 0
shortCondition = ta.crossunder(close, ema44) and direction < 0

// Target and Stop Loss
strategy.risk.max_position_size(1)
targetPercent = 0.01
stopPercent = 0.01

if (longCondition)
    strategy.entry("Long", strategy.long)
    strategy.exit("Take Profit/Stop Loss", from_entry="Long", limit=close * (1 + targetPercent), stop=close * (1 - stopPercent))

if (shortCondition)
    strategy.entry("Short", strategy.short)
    strategy.exit("Take Profit/Stop Loss", from_entry="Short", limit=close * (1 - targetPercent), stop=close * (1 + stopPercent))
- Adaptive Trend Following Dynamic Trend Recognition Trading Strategy
- Volatility and Linear Regression-based Long-Short Market Regime Optimization Strategy
- EMA Dynamic Trend Following Trading Strategy
- Multi-Indicator Trend Following Strategy with Dynamic Channel and Moving Average Trading System
- Enhanced Multi-Indicator Momentum Trading Strategy
- Multi-EMA Cross with Oscillator and Dynamic Support/Resistance Trading Strategy
- K Consecutive Candles Bull Bear Strategy
- Triple EMA Crossover Strategy
- Keltner Channels EMA ATR Strategy
- ATR and EMA-based Dynamic Take Profit and Stop Loss Adaptive Strategy
- Dual Moving Average Crossover Strategy with Daily Profit Target
- Dynamic Stop-Loss Moving Average Crossover Strategy
- MACD-ATR-EMA Multi-Indicator Dynamic Trend Following Strategy
- RSI Momentum Divergence Breakout Strategy
- Multi-Indicator Synergy Long-Term Trading Strategy
- Golden Momentum Capture Strategy: Multi-Timeframe Exponential Moving Average Crossover System
- Triple Supertrend Crossover Strategy
- Advanced Multi-Timeframe Ichimoku Cloud Trading Strategy with Dynamic Multidimensional Analysis
- Dual Moving Average Momentum Trading Strategy: Time-Optimized Trend Following System
- Enhanced EMA/WMA Crossover Strategy with Comprehensive Exit Conditions
- EMA, SMA, Moving Average Crossover, Momentum Indicator
- Comprehensive Trading System Combining SMA Crossover Strategy with Fair Value Gap Pullback
- Dynamic Support-Resistance Breakout Moving Average Crossover Strategy
- Dynamic Trend Following with Precision Take-Profit and Stop-Loss Strategy
- Ichimoku Kinko Hyo Trend Following and Support Resistance Strategy
- Bollinger Bands Mean Reversion Trading Strategy with Dynamic Support
- MORNING CANDLE BREAKOUT AND REVERSION STRATEGY
- Adaptive Trend Following Strategy Based on Fibonacci Retracement
- Advanced Markov Model Technical Indicator Fusion Trading Strategy
- Multi-Layer Volatility Band Trading Strategy