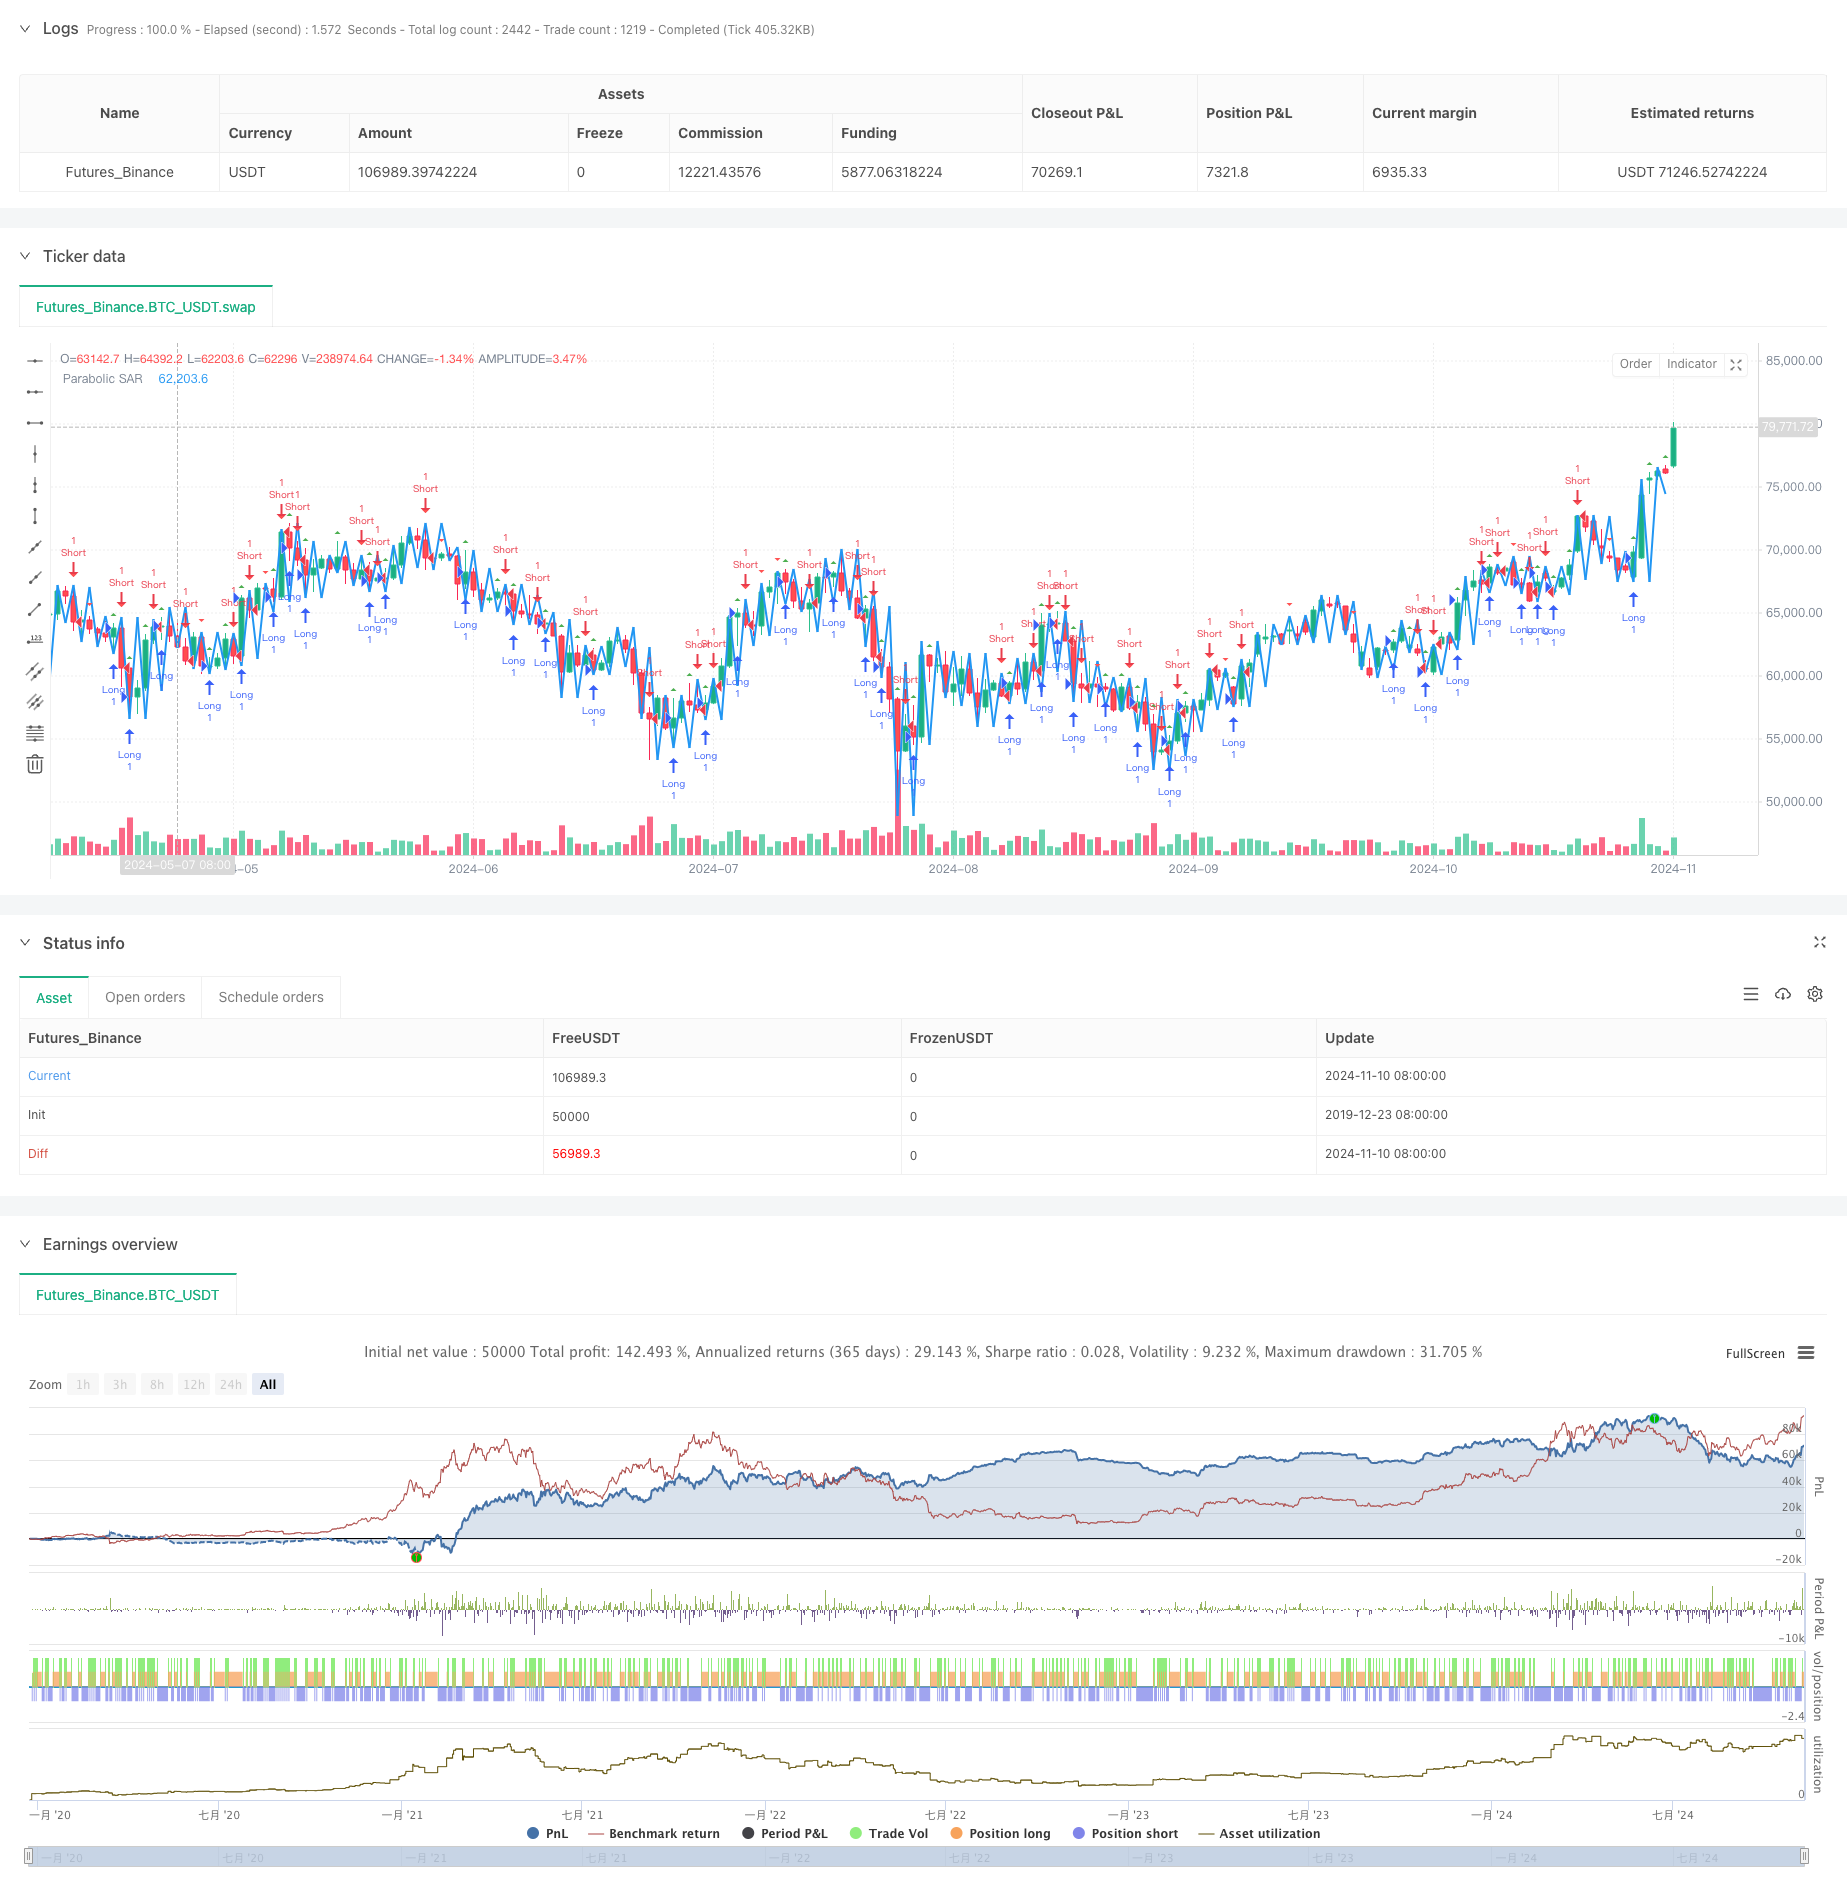
Parabolic SAR Divergence Trading Strategy
Author: ChaoZhang, Date: 2024-11-12 15:12:33Tags: SARPSAR

Overview
This strategy is a trading system based on divergence relationships between the Parabolic SAR indicator and price movement. By monitoring divergence phenomena between SAR indicator and price trends, it identifies potential trend reversal points to capture market turning opportunities. The strategy employs the classic Parabolic SAR indicator as its core technical indicator, combined with divergence analysis methods to construct a complete trend-following trading system.
Strategy Principles
The core logic includes several key elements:
- Uses Parabolic SAR indicator to track price trends, featuring dynamic adjustment of acceleration factors
- Detects divergence between price and SAR indicator through a set lookback period
- Triggers long signals when bullish divergence occurs (price makes new lows while SAR doesn’t)
- Triggers short signals when bearish divergence occurs (price makes new highs while SAR doesn’t)
- Marks trading signals on charts using shape.triangleup and shape.triangledown
- Integrates alert functionality to notify traders of trading signals promptly
Strategy Advantages
- Scientific Indicator Selection
- Parabolic SAR is a market-tested mature indicator
- Indicator parameters can be flexibly adjusted for different market characteristics
- Reliable Signal Mechanism
- Divergence signals have strong trend prediction capability
- Combines price and indicator trends to reduce false signals
- Complete System Design
- Includes comprehensive signal generation, execution, and monitoring mechanisms
- Integrates graphical interface and alert functions for easy operation
Strategy Risks
- Parameter Sensitivity
- Improper SAR parameter settings may lead to overtrading
- Divergence detection period selection affects signal quality
- Market Adaptability
- May generate false signals in volatile markets
- Frequent invalid signals may occur in ranging markets
- Insufficient Risk Control
- Lacks stop-loss mechanism
- No position management system
Strategy Optimization Directions
- Enhanced Signal Filtering
- Add trend filters to trade only in main trend direction
- Incorporate volume indicators to verify signal validity
- Improved Risk Control
- Add dynamic stop-loss mechanism
- Design position management system
- Optimized Parameter Adjustment
- Develop adaptive parameter system
- Dynamically adjust parameters based on market conditions
Summary
This is a trend-following strategy based on classic technical indicators, capturing market turning points through divergence analysis. The strategy design is clear, implementation methods are concise, and it has good operability. However, in practical application, it still needs optimization according to specific market characteristics, especially in risk control aspects. Through adding filtering mechanisms and improving the risk control system, this strategy has the potential to achieve more stable trading performance.
/*backtest
start: 2019-12-23 08:00:00
end: 2024-11-11 00:00:00
period: 1d
basePeriod: 1d
exchanges: [{"eid":"Futures_Binance","currency":"BTC_USDT"}]
*/

//@version=5
strategy("SAR Divergence Strategy", overlay=true)

// --- Inputs ---
length = input.int(14, title="SAR Length", minval=1)
accelerationFactor = input.float(0.02, title="Acceleration Factor", minval=0.01)
maximumFactor = input.float(0.2, title="Maximum Factor", minval=0.01)

// --- SAR Calculation ---
sar = ta.sar(length, accelerationFactor, maximumFactor)

// --- Divergence Detection ---
lookback = 5

// Bullish Divergence
bullCond = close[lookback] < close[lookback + 1] and sar[lookback] > sar[lookback + 1]

// Bearish Divergence
bearCond = close[lookback] > close[lookback + 1] and sar[lookback] < sar[lookback + 1]

// --- Strategy Logic ---
if (bullCond)
    strategy.entry("Long", strategy.long)

if (bearCond)
    strategy.entry("Short", strategy.short)

// --- Plotting ---
plot(sar, color=color.blue, linewidth=2, title="Parabolic SAR")

plotshape(bullCond, style=shape.triangleup, color=color.green, size=size.small, title="Bullish Divergence")
plotshape(bearCond, style=shape.triangledown, color=color.red, size=size.small, title="Bearish Divergence")

// --- Alerts ---
alertcondition(bullCond, title="Bullish SAR Divergence", message="Bullish Divergence detected")
alertcondition(bearCond, title="Bearish SAR Divergence", message="Bearish Divergence detected")
- SAR -high and low
- Parabolic SAR Buy And Sell
- Parabolic SAR
- EMA and Parabolic SAR Combination Strategy
- EMA SAR Medium-to-Long-Term Trend Following Strategy
- HIGH LOW SAR
- Enhanced Trend Following System: Dynamic Trend Identification Based on ADX and Parabolic SAR
- Multi-Indicator Synergy Long-Term Trading Strategy
- Multi-Order Breakout Trend Following Strategy
- PSAR and EMA-Based Quantitative Trading Strategy
- Adaptive RSI Oscillator Dynamic Trading Strategy with Threshold Optimization
- RSI and AO Synergistic Trend Following Quantitative Trading Strategy
- Adaptive Trend Momentum RSI Strategy with Moving Average Filter System
- Dual Moving Average Cross RSI Momentum Strategy with Risk-Reward Optimization System
- Multi-Indicator Crossover Dynamic Strategy System: A Quantitative Trading Model Based on EMA, RVI and Trading Signals
- RSI Dynamic Range Reversal Quantitative Strategy with Volatility Optimization Model
- Bollinger Bands Momentum Trend Following Quantitative Strategy
- Multi-Period Technical Analysis and Market Sentiment Trading Strategy
- Dynamic Holding Period Strategy Based on 123 Point Reversal Pattern
- Multi-Technical Indicator Crossover Momentum Quantitative Trading Strategy - Integration Analysis Based on EMA, RSI and ADX
- Combined Momentum SMA Crossover Strategy with Market Sentiment and Resistance Level Optimization System
- Multi-Period RSI Momentum and Triple EMA Trend Following Composite Strategy
- Multi-Moving Average Momentum Trend Following Strategy
- E9 Shark-32 Pattern Quantitative Price Breakout Strategy
- Open Market Exposure Dynamic Position Adjustment Quantitative Trading Strategy
- High Win Rate Trend Mean Reversion Trading Strategy
- Dual Moving Average RSI Trend Momentum Strategy
- Multi-Indicator Fusion Mean Reversion Trend Following Strategy
- Post-Open Breakout Trading Strategy with Dynamic ATR-Based Position Management
- Multi-Indicator Integration and Intelligent Risk Control Quantitative Trading System