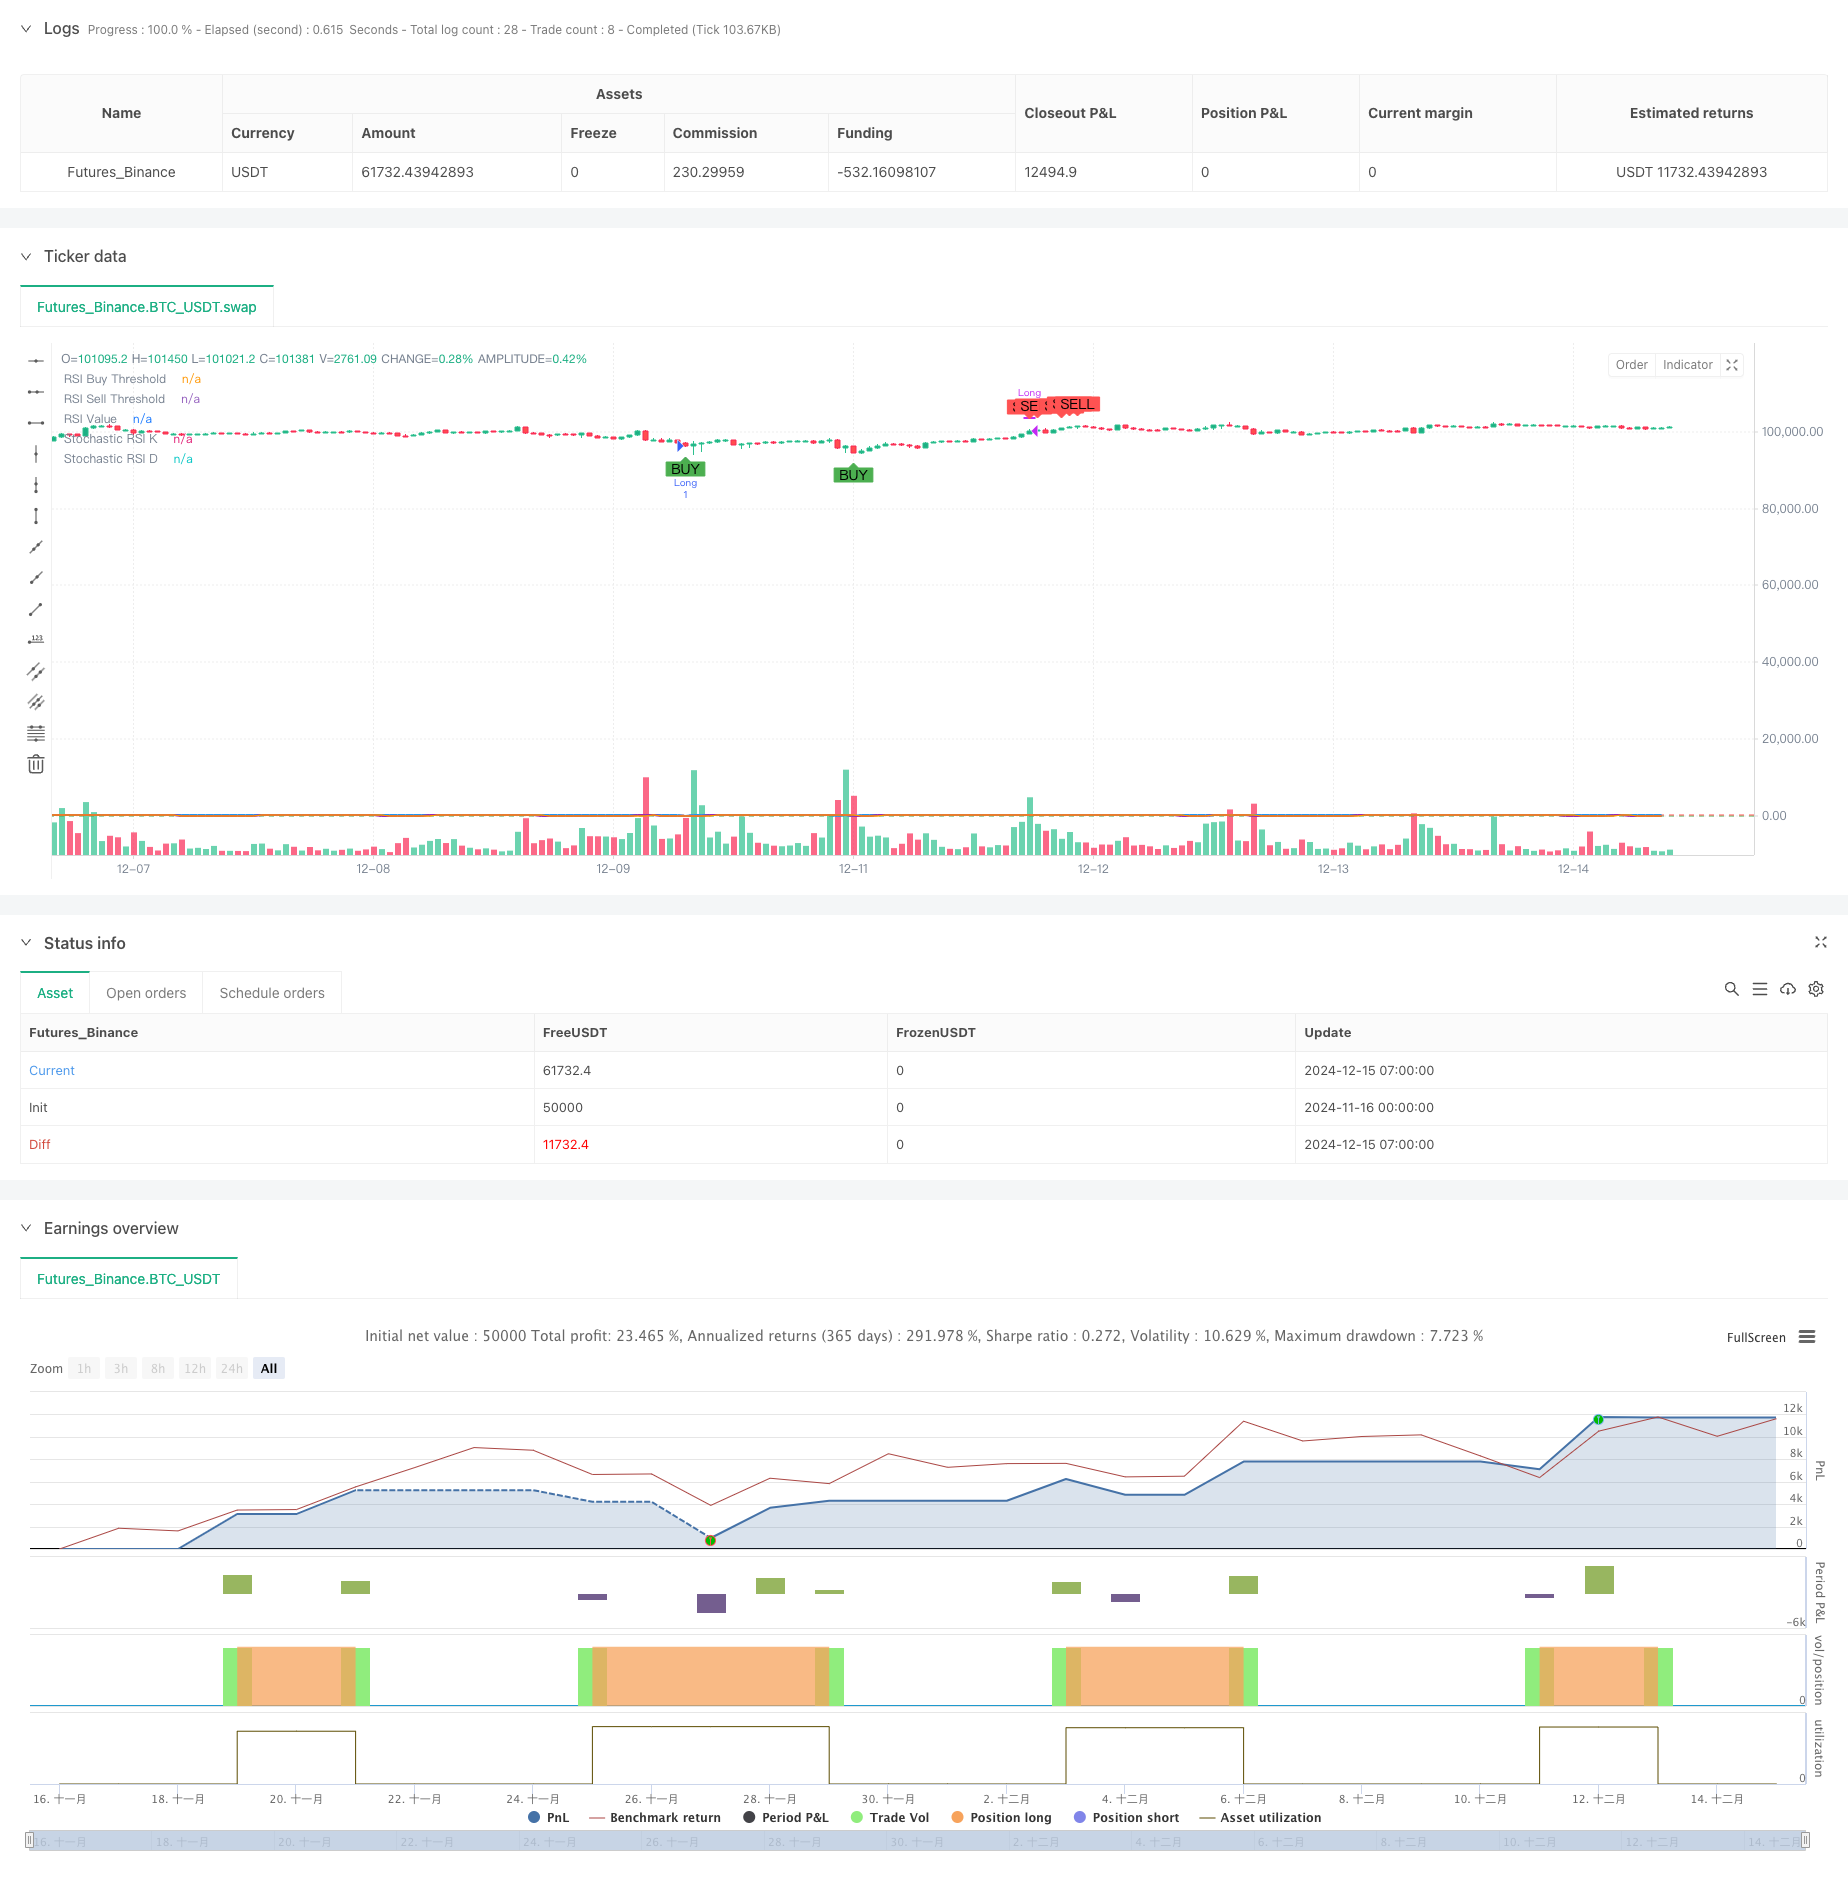
दोहरी गतिशीलता ऑसिलेटर स्मार्ट टाइमिंग ट्रेडिंग रणनीति
लेखक:चाओझांग, दिनांकः 2024-12-17 14:36:46टैगःआरएसआईएसएमएईएमएएमएसीडी

अवलोकन
यह रणनीति दो गति संकेतकः आरएसआई और स्टोकास्टिक आरएसआई पर आधारित एक बुद्धिमान ट्रेडिंग प्रणाली है। यह दो गति ऑसिलेटरों के संकेतों को मिलाकर, संभावित व्यापारिक अवसरों को कैप्चर करके बाजार के ओवरबॉट और ओवरसोल्ड स्थितियों की पहचान करती है। यह प्रणाली अवधि अनुकूलन का समर्थन करती है और विभिन्न बाजार वातावरण के अनुसार ट्रेडिंग चक्रों को लचीलापन से समायोजित कर सकती है।
रणनीतिक सिद्धांत
रणनीति का मूल तर्क निम्नलिखित प्रमुख तत्वों पर आधारित हैः 1. मूल्य गति की गणना करने के लिए 14-अवधि आरएसआई संकेतक का उपयोग करता है 2. द्वितीयक पुष्टि के लिए 14-अवधि स्टोकैस्टिक आरएसआई का उपयोग करता है 3. ट्रिगर खरीद संकेत जब आरएसआई 35 से नीचे है और स्टोकैस्टिक आरएसआई 20 से नीचे है 4. ट्रिगर सिग्नल बेचते हैं जब आरएसआई 70 से ऊपर है और स्टोकैस्टिक आरएसआई 80 से ऊपर है 5. सिग्नल स्थिरता के लिए स्टोकैस्टिक आरएसआई पर 3-अवधि एसएमए चिकनाई लागू करता है 6. दैनिक और साप्ताहिक समय सीमाओं के बीच स्विच करने का समर्थन करता है
रणनीतिक लाभ
- दोहरी सिग्नल पुष्टिकरण तंत्र झूठे सिग्नल हस्तक्षेप को काफी कम करता है
- सूचक मापदंडों को बाजार की अस्थिरता के अनुसार लचीले ढंग से समायोजित किया जा सकता है
- एसएमए चिकनाई प्रभावी रूप से संकेत शोर को कम करती है
- विभिन्न निवेशकों की जरूरतों को पूरा करने के लिए बहु-अवधि व्यापार का समर्थन करता है
- विजुअल इंटरफेस विश्लेषण के लिए सहज रूप से खरीद/बिक्री संकेत प्रदर्शित करता है
- स्पष्ट कोड संरचना, बनाए रखने और आगे विकसित करने में आसान
रणनीतिक जोखिम
- साइडवेज बाजारों में अत्यधिक ट्रेडिंग सिग्नल उत्पन्न कर सकता है
- तेजी से रुझान उलटने के दौरान संभावित संकेत विलंब
- अनुचित पैरामीटर सेटिंग्स से व्यापार के अवसरों को खोया जा सकता है
- उच्च बाजार अस्थिरता के दौरान झूठे संकेत हो सकते हैं
- जोखिम नियंत्रण के लिए उचित स्टॉप-लॉस सेटिंग्स की आवश्यकता होती है
रणनीति अनुकूलन दिशाएं
- संकेत की विश्वसनीयता में सुधार के लिए एमएसीडी या ईएमए जैसे रुझान आकलन संकेतकों को पेश करें
- सिग्नल की गुणवत्ता बढ़ाने के लिए वॉल्यूम कारक जोड़ें
- जोखिम प्रबंधन को अनुकूलित करने के लिए गतिशील स्टॉप-लॉस तंत्र लागू करें
- रणनीति स्थिरता के लिए अनुकूलनशील पैरामीटर अनुकूलन प्रणाली विकसित करना
- व्यापार के समय को अनुकूलित करने के लिए बाजार अस्थिरता संकेतकों को शामिल करने पर विचार करें
सारांश
यह रणनीति आरएसआई और स्टोकैस्टिक आरएसआई के लाभों को जोड़कर एक विश्वसनीय ट्रेडिंग प्रणाली का निर्माण करती है। दोहरी सिग्नल पुष्टि तंत्र प्रभावी रूप से झूठे संकेतों को कम करता है, जबकि लचीली पैरामीटर सेटिंग्स मजबूत अनुकूलन क्षमता प्रदान करती हैं। निरंतर अनुकूलन और सुधार के माध्यम से, रणनीति विभिन्न बाजार स्थितियों में स्थिर प्रदर्शन बनाए रखने में वादा करती है।
/*backtest
start: 2024-11-16 00:00:00
end: 2024-12-15 08:00:00
period: 1h
basePeriod: 1h
exchanges: [{"eid":"Futures_Binance","currency":"BTC_USDT"}]
*/

//@version=5
strategy("BTC Buy & Sell Strategy (RSI & Stoch RSI)", overlay=true)

// Input Parameters
rsi_length = input.int(14, title="RSI Length")
stoch_length = input.int(14, title="Stochastic Length")
stoch_smooth_k = input.int(3, title="Stochastic %K Smoothing")
stoch_smooth_d = input.int(3, title="Stochastic %D Smoothing")

// Threshold Inputs
rsi_buy_threshold = input.float(35, title="RSI Buy Threshold")
stoch_buy_threshold = input.float(20, title="Stochastic RSI Buy Threshold")
rsi_sell_threshold = input.float(70, title="RSI Sell Threshold")
stoch_sell_threshold = input.float(80, title="Stochastic RSI Sell Threshold")

use_weekly_data = input.bool(false, title="Use Weekly Data", tooltip="Enable to use weekly timeframe for calculations.")

// Timeframe Configuration
timeframe = use_weekly_data ? "W" : timeframe.period

// Calculate RSI and Stochastic RSI
rsi_value = request.security(syminfo.tickerid, timeframe, ta.rsi(close, rsi_length))
stoch_rsi_k_raw = request.security(syminfo.tickerid, timeframe, ta.stoch(close, high, low, stoch_length))
stoch_rsi_k = ta.sma(stoch_rsi_k_raw, stoch_smooth_k)
stoch_rsi_d = ta.sma(stoch_rsi_k, stoch_smooth_d)

// Define Buy and Sell Conditions
buy_signal = (rsi_value < rsi_buy_threshold) and (stoch_rsi_k < stoch_buy_threshold)
sell_signal = (rsi_value > rsi_sell_threshold) and (stoch_rsi_k > stoch_sell_threshold)

// Strategy Execution
if buy_signal
    strategy.entry("Long", strategy.long, comment="Buy Signal")

if sell_signal
    strategy.close("Long", comment="Sell Signal")

// Plot Buy and Sell Signals
plotshape(buy_signal, style=shape.labelup, location=location.belowbar, color=color.green, title="Buy Signal", size=size.small, text="BUY")
plotshape(sell_signal, style=shape.labeldown, location=location.abovebar, color=color.red, title="Sell Signal", size=size.small, text="SELL")

// Plot RSI and Stochastic RSI for Visualization
hline(rsi_buy_threshold, "RSI Buy Threshold", color=color.green)
hline(rsi_sell_threshold, "RSI Sell Threshold", color=color.red)

plot(rsi_value, color=color.blue, linewidth=2, title="RSI Value")
plot(stoch_rsi_k, color=color.purple, linewidth=2, title="Stochastic RSI K")
plot(stoch_rsi_d, color=color.orange, linewidth=1, title="Stochastic RSI D")
- बहु-सूचक मात्रात्मक ट्रेडिंग रणनीति - सुपर सूचक 7-इन-1 रणनीति
- आरएसआई ओवरबॉट/ओवरसोल्ड क्वांटिटेटिव ट्रेडिंग स्ट्रेटेजी के साथ मल्टी-इंडिकेटर ट्रेंड फॉलो करना
- दोहरी चलती औसत चैनल ट्रेंड रणनीति का पालन करना
- एसएमए-आरएसआई-एमएसीडी बहु-निर्देशक गतिशील सीमा आदेश व्यापार रणनीति
- बहु-समय सीमा ईएमए क्रॉस उच्च लाभ दर की प्रवृत्ति रणनीति के बाद (उन्नत)
- जी-चैनल और ईएमए पर आधारित मात्रात्मक दीर्घकालिक स्विचिंग रणनीति
- गतिशील दोहरी चलती औसत क्रॉसओवर मात्रात्मक ट्रेडिंग रणनीति
- मल्टी-इंडिकेटर व्यापक ट्रेडिंग रणनीतिः गति, ओवरबॉट/ओवरसोल्ड और अस्थिरता का सही संयोजन
- 52 सप्ताह के उच्च/निम्न विस्तार विश्लेषण प्रणाली के साथ बहु-स्तरीय गतिशील एमएसीडी ट्रेंड फॉलो रणनीति
- बहु-रणनीति तकनीकी विश्लेषण व्यापार प्रणाली
- जोखिम प्रबंधन के साथ रणनीति के बाद दोहरी चलती औसत प्रवृत्ति
- ट्रिपल सुपरट्रेंड और बोलिंगर बैंड्स मल्टी-इंडिकेटर ट्रेंड फॉलोिंग स्ट्रेटेजी
- बहु-ट्रेंडलाइन ब्रेकआउट गतिमानता मात्रात्मक रणनीति
- आरएसआई गति और एडीएक्स ट्रेंड स्ट्रेंथ आधारित पूंजी प्रबंधन प्रणाली
- बहु-समय-सीमा तरलता पिवोट हीटमैप रणनीति
- एटीआर-आधारित लाभ लेने और हानि रोकने के साथ रणनीति के बाद बहु-समय सीमा प्रवृत्ति
- अनुकूलन ट्रेलिंग स्टॉप के साथ उन्नत ट्रेंड फॉलोइंग रणनीति
- आरएसआई गति फ़िल्टर के साथ बहु-तकनीकी संकेतक प्रवृत्ति रणनीति का पालन करना
- गतिशील जोखिम-प्रबंधित घातीय चलती औसत क्रॉसओवर रणनीति
- दोहरी घातीय चलती औसत और सापेक्ष शक्ति सूचकांक क्रॉसओवर रणनीति
- गतिशील रेंज फ़िल्टर के साथ उन्नत मात्रात्मक प्रवृत्ति कैप्चर रणनीति
- ट्रेडिंग व्यू सिग्नल निष्पादन नीति (निर्मित HTTP सेवा संस्करण)
- आरएसआई और एमएसीडी एकीकरण पर आधारित उन्नत पांच दिवसीय क्रॉस-विश्लेषण रणनीति
- दोहरे आरएसआई संकेतकों पर आधारित अनुकूलनशील रेंज ट्रेडिंग प्रणाली
- गतिशील दोहरी सुपरट्रेंड वॉल्यूम-मूल्य रणनीति
- ब्लैक स्वान अस्थिरता और चलती औसत क्रॉसओवर गति ट्रैकिंग रणनीति
- बोलिंजर बैंड और सुपरट्रेंड को जोड़ने वाली बुद्धिमान अस्थिरता रेंज ट्रेडिंग रणनीति
- गतिशील स्टॉप-लॉस प्रणाली के साथ रणनीति के बाद बहु-सूचक सामंजस्यपूर्ण प्रवृत्ति
- बोलिंगर बैंड्स गति ब्रेकआउट अनुकूलन प्रवृत्ति रणनीति का पालन करना
- एमएसीडी-एटीआर कार्यान्वयन के साथ उन्नत औसत प्रतिवर्तन रणनीति