RSI Dinamis Drawdown Stop-Loss Strategi
Penulis:ChaoZhang, Tanggal: 2024-06-07 15:47:51Tag:RSIMA

Gambaran umum
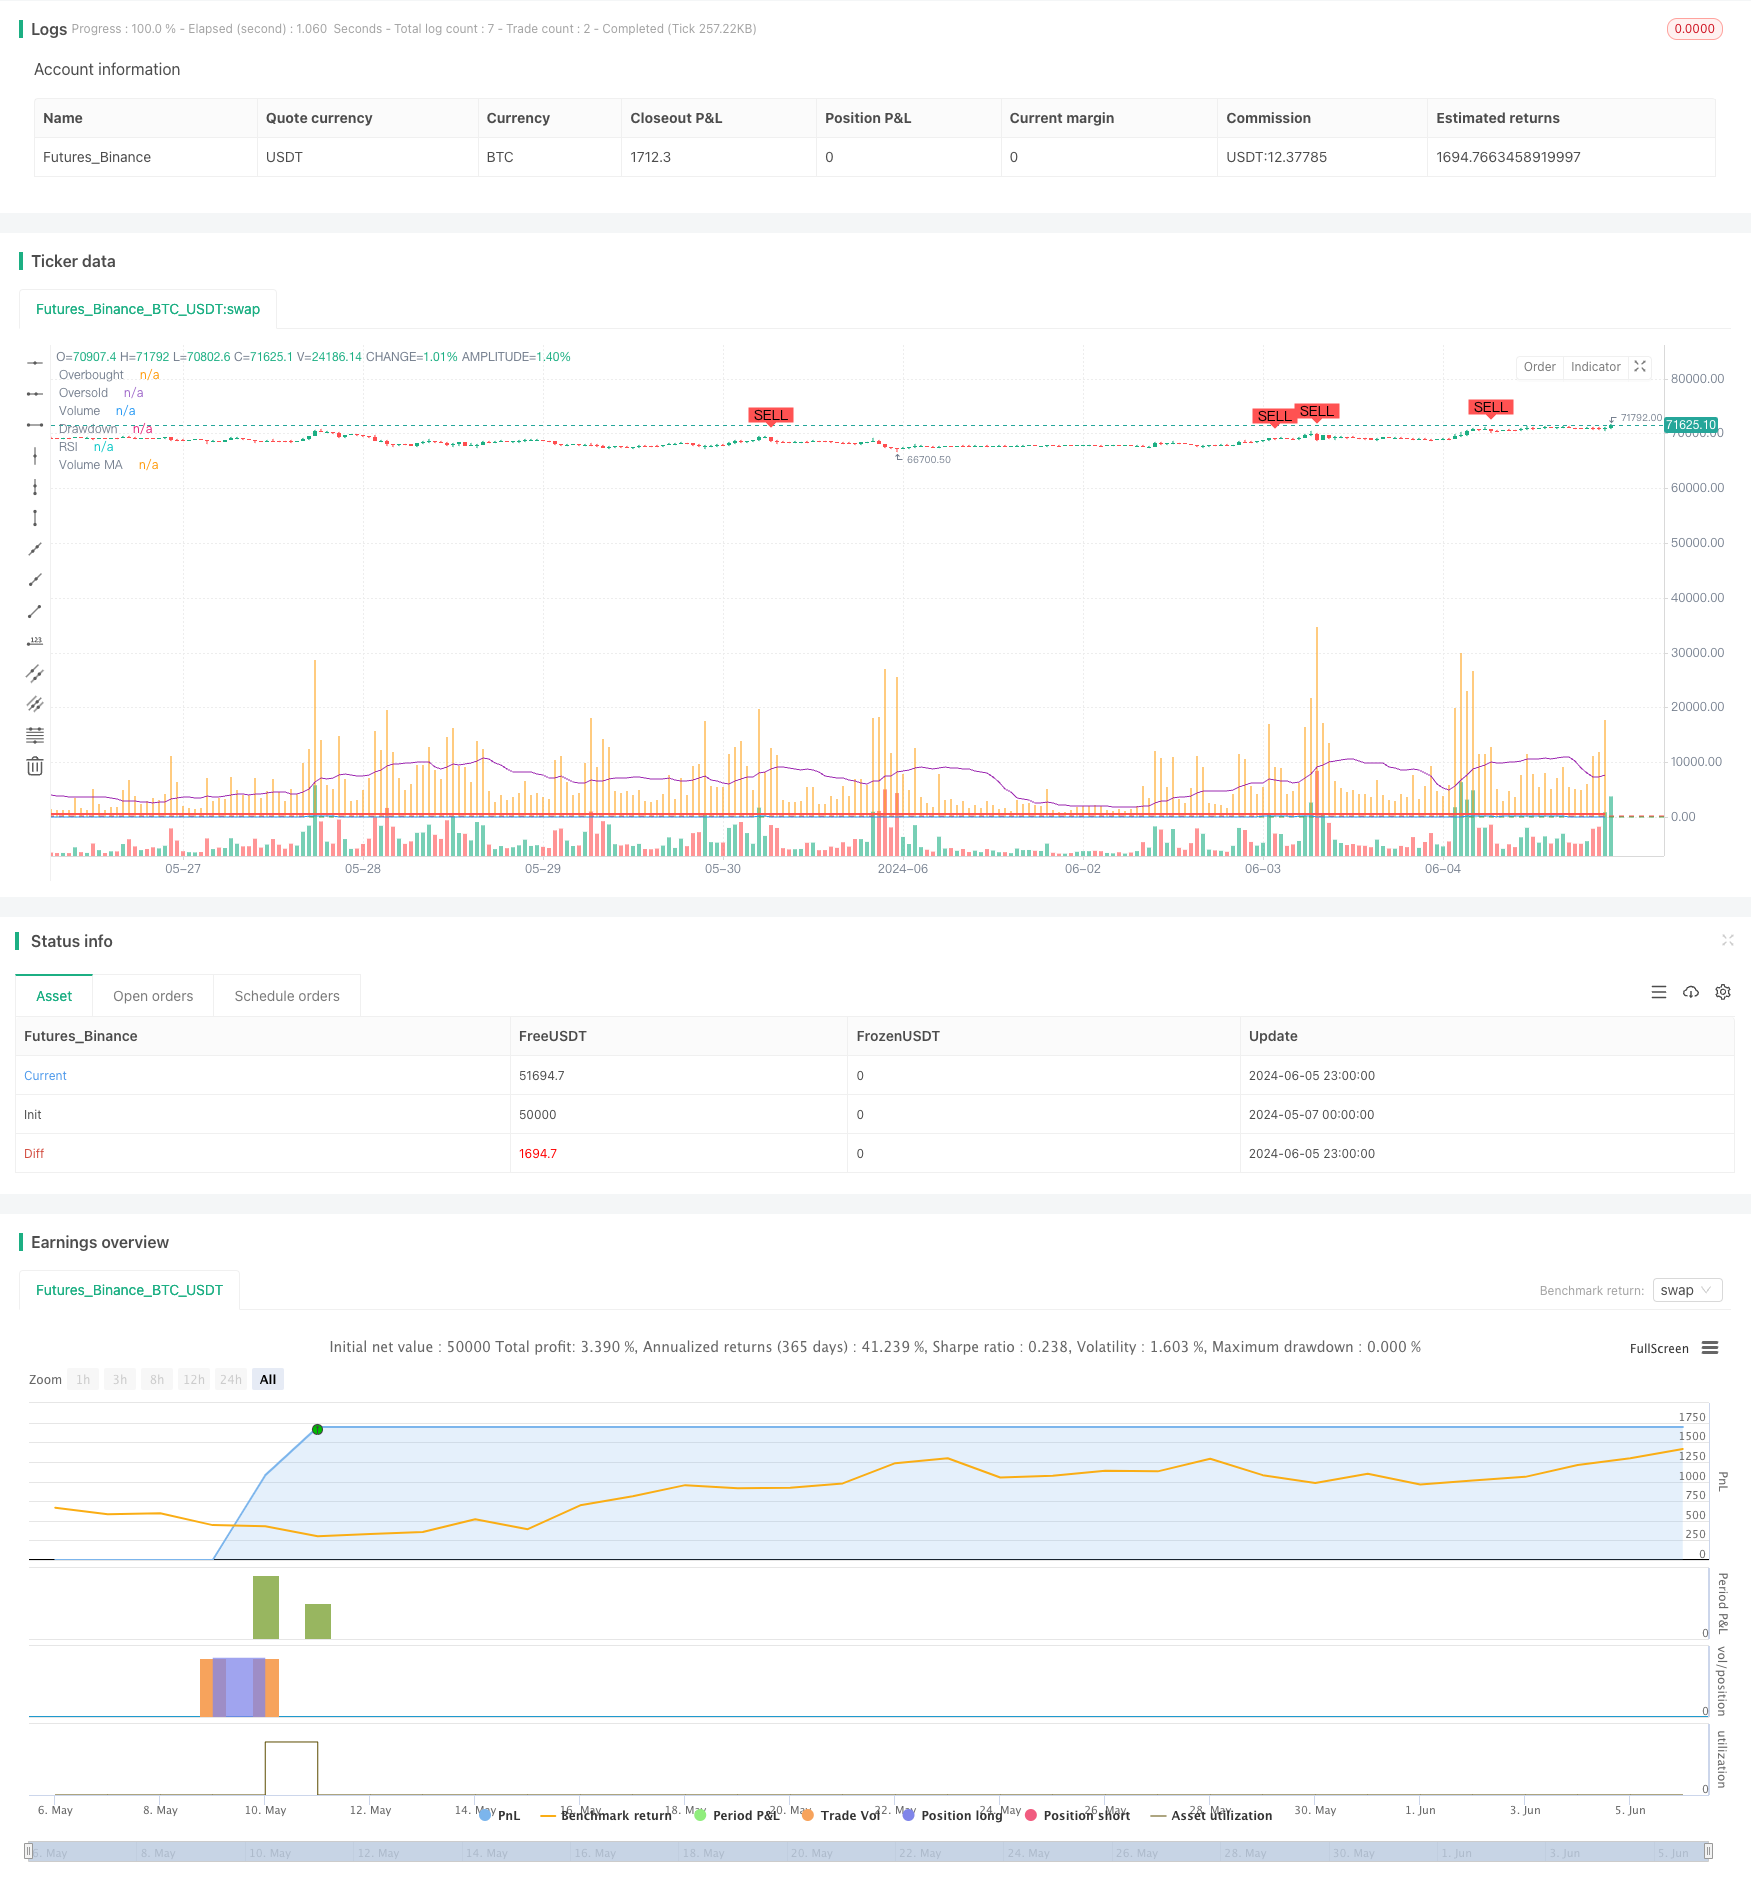
Strategi ini didasarkan pada Metodologi Wyckoff, menggabungkan Indeks Kekuatan Relatif (RSI) dan Rata-rata Gerak Volume (Volume MA) untuk mengidentifikasi fase akumulasi dan distribusi pasar, menghasilkan sinyal beli dan jual.
Prinsip Strategi
- Menghitung indikator RSI dan Volume Moving Average.
- Ketika RSI melintasi area oversold dan volume lebih besar dari Volume MA, ia mengidentifikasi fase akumulasi pasar dan menghasilkan sinyal beli.
- Ketika RSI melintasi di bawah area overbought dan volume lebih besar dari Volume MA, ia mengidentifikasi fase distribusi pasar dan menghasilkan sinyal jual.
- Strategi ini secara bersamaan melacak jumlah maksimum ekuitas akun dan penarikan saat ini.
- Posisi beli ditutup selama fase distribusi atau ketika penarikan melebihi penarikan maksimum, sementara posisi jual ditutup selama fase akumulasi atau ketika penarikan melebihi penarikan maksimum.
Keuntungan Strategi
- Dengan menggabungkan indikator RSI dan indikator volume, strategi dapat menangkap fase akumulasi dan distribusi pasar dengan lebih akurat.
- Mekanisme stop loss penarikan dinamis secara efektif mengontrol penarikan maksimum strategi, mengurangi risiko strategi secara keseluruhan.
- Cocok untuk data frekuensi tinggi 5 menit, memungkinkan respons cepat terhadap perubahan pasar dan penyesuaian posisi yang tepat waktu.
Risiko Strategi
- Indikator RSI dan volume dapat menghasilkan sinyal yang menyesatkan dalam kondisi pasar tertentu, yang mengarah pada keputusan perdagangan yang salah oleh strategi.
- Penentuan ambang batas maksimum pengambilan harus disesuaikan sesuai dengan karakteristik pasar dan preferensi risiko pribadi; pengaturan yang tidak tepat dapat menyebabkan penutupan posisi dini atau risiko yang berlebihan.
- Strategi ini dapat menghasilkan sinyal perdagangan yang sering di pasar yang bergolak, meningkatkan biaya perdagangan.
Arah Optimasi Strategi
- Pertimbangkan untuk memperkenalkan indikator teknis lainnya seperti MACD, Bollinger Bands, dll, untuk meningkatkan keakuratan sinyal strategi.
- Mengoptimalkan parameter RSI dan indikator volume, seperti menyesuaikan panjang RSI, ambang overbought/oversold, dll., untuk menyesuaikan dengan kondisi pasar yang berbeda.
- Selain penarikan stop-loss, sertakan mekanisme stop-loss atau perlindungan keuntungan untuk lebih mengendalikan risiko dan mengunci keuntungan.
Ringkasan
Strategi Stop-Loss Dynamic Drawdown RSI mengidentifikasi fase akumulasi dan distribusi pasar dengan menggabungkan indikator RSI dan volume sambil menggunakan mekanisme stop-loss drawdown dinamis untuk mengendalikan risiko. Strategi ini mempertimbangkan tren pasar dan manajemen risiko, membuatnya praktis sampai batas tertentu. Namun, kinerja strategi tergantung pada pilihan parameter indikator dan karakteristik pasar, yang membutuhkan optimasi dan penyesuaian terus menerus untuk meningkatkan stabilitas dan profitabilitasnya.
/*backtest
start: 2024-05-07 00:00:00
end: 2024-06-06 00:00:00
period: 1h
basePeriod: 15m
exchanges: [{"eid":"Futures_Binance","currency":"BTC_USDT"}]
*/

//@version=5
strategy("Wyckoff Methodology Strategy with Max Drawdown", overlay=true)

// Define input parameters
length = input(14, title="RSI Length")
overbought = input(70, title="RSI Overbought Level")
oversold = input(30, title="RSI Oversold Level")
volume_length = input(20, title="Volume MA Length")
initial_capital = input(10000, title="Initial Capital")
max_drawdown = input(500, title="Max Drawdown")

// Calculate RSI
rsi = ta.rsi(close, length)

// Calculate Volume Moving Average
vol_ma = ta.sma(volume, volume_length)

// Identify Accumulation Phase
accumulation = ta.crossover(rsi, oversold) and volume > vol_ma

// Identify Distribution Phase
distribution = ta.crossunder(rsi, overbought) and volume > vol_ma

// Plot RSI
hline(overbought, "Overbought", color=color.red)
hline(oversold, "Oversold", color=color.green)
plot(rsi, title="RSI", color=color.blue)

// Plot Volume and Volume Moving Average
plot(volume, title="Volume", color=color.orange, style=plot.style_histogram)
plot(vol_ma, title="Volume MA", color=color.purple)

// Variables to track drawdown
var float max_equity = initial_capital
var float drawdown = 0.0

// Update max equity and drawdown
current_equity = strategy.equity
if (current_equity > max_equity)
    max_equity := current_equity
drawdown := max_equity - current_equity

// Generate Buy and Sell Signals
if (accumulation and drawdown < max_drawdown)
    strategy.entry("Buy", strategy.long)
if (distribution and drawdown < max_drawdown)
    strategy.entry("Sell", strategy.short)

// Plot Buy and Sell signals on chart
plotshape(series=accumulation, location=location.belowbar, color=color.green, style=shape.labelup, title="Buy Signal", text="BUY")
plotshape(series=distribution, location=location.abovebar, color=color.red, style=shape.labeldown, title="Sell Signal", text="SELL")

// Close positions if drawdown exceeds max drawdown
if (drawdown >= max_drawdown)
    strategy.close_all("Max Drawdown Exceeded")

// Set strategy exit conditions
strategy.close("Buy", when=distribution or drawdown >= max_drawdown)
strategy.close("Sell", when=accumulation or drawdown >= max_drawdown)

// Display drawdown on chart
plot(drawdown, title="Drawdown", color=color.red, linewidth=2, style=plot.style_stepline)
- Strategi pembelian pembalikan multi-konfirmasi
- Strategi TradingView Terbaik
- Tren Retracement Fibonacci Dinamis Lanjutan Strategi Perdagangan Kuantitatif
- MA, SMA, MA Slope, Trailing Stop Loss, Re-Entry
- Strategi Trading Rebound RSI Dinamis dengan Model Optimasi Stop-Loss
- Strategi Trading Jangka Pendek Berdasarkan Bollinger Band, Moving Average, dan RSI
- Strategi Momentum RSI Rata-rata Bergerak Ganda Berdasarkan EMA dan Trendline Breakouts
- RSI-ATR Momentum Volatilitas Strategi Perdagangan Gabungan
- Strategi lintas rata-rata bergerak multi-periode dan momentum RSI
- Strategi Kembali Selasa (Filter Akhir Pekan)
- BB Breakout Strategi
- VWAP dan RSI Dynamic Bollinger Bands Take Profit dan Stop Loss Strategi
- Chande-Kroll Stop Tren ATR Dinamis Mengikuti Strategi
- Strategi ini menghasilkan sinyal perdagangan berdasarkan aliran uang Chaikin (CMF)
- Strategi Pembalikan Bar Pin yang Difilter Tren
- Strategi perdagangan kuantitatif berdasarkan pola pembalikan pada level support dan resistance
- MA, SMA, MA Slope, Trailing Stop Loss, Re-Entry
- Strategi STI Crossover
- EMA Dual Moving Average Crossover Strategi
- Williams %R Strategi Penyesuaian TP/SL Dinamis
- Strategi Perdagangan VWAP dengan Deteksi Anomali Volume
- Strategi Kombinasi Supertrend dan EMA
- TGT Menurunkan Strategi Beli Berdasarkan Penurunan Harga
- Strategi tren ganda dengan EMA Crossover dan RSI Filter
- Strategi Kombinasi EMA dan Parabolic SAR
- Strategi Perdagangan Intraday Multi-Filter MACD dan RSI
- Strategi Perdagangan Arbitrage Berbasis Hubungan Harga Antara Dua Pasar
- Strategi Trading berbasis RSI dengan Take Profit dan Stop Loss berbasis Persentase
- Strategi Kombinasi MACD dan Martingale untuk Optimalisasi Perdagangan Panjang
- Elliott Wave Stochastic EMA Strategi