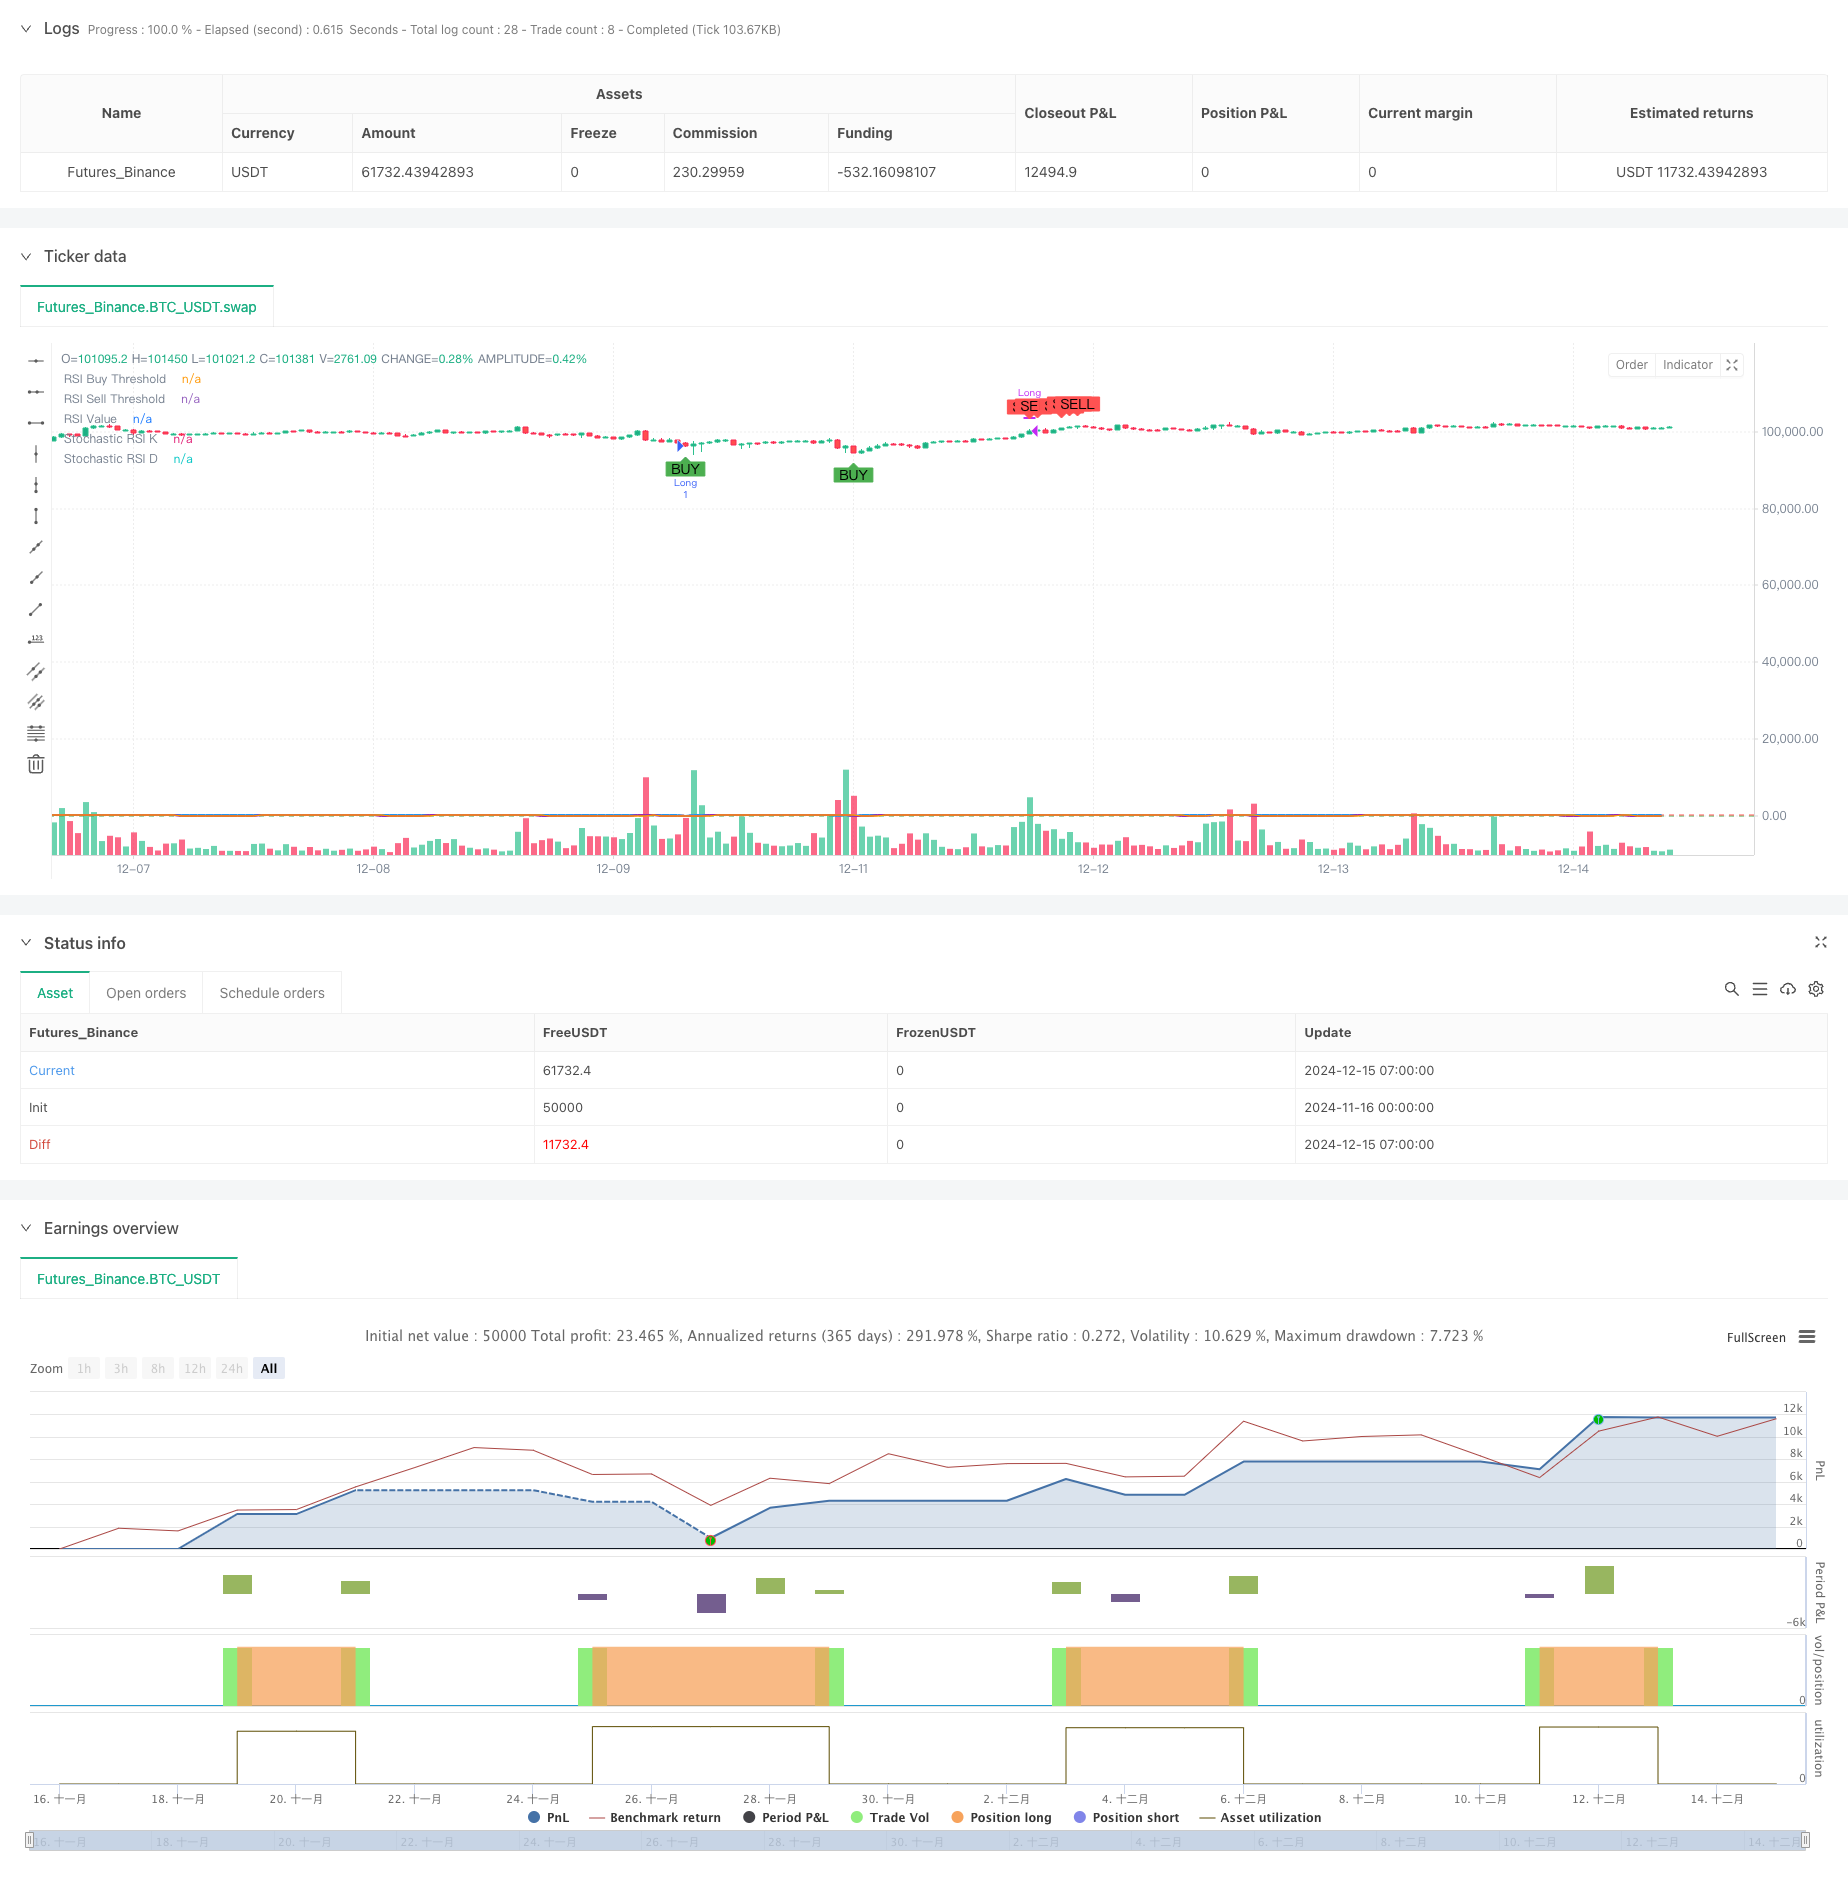
双勢オシレータースマートタイム取引戦略
作者: リン・ハーンチャオチャン開催日:2024年12月17日 14:36:46タグ:RSISMAエイママックド

概要
この戦略は,RSIとストカスティックRSIという2つのモメンタム指標に基づいたインテリジェントな取引システムである.このシステムは,2つのモメンタムオシレーターからのシグナルを組み合わせて,潜在的な取引機会を把握することによって,市場過剰購入および過剰販売状態を識別する.システムは期間適応をサポートし,異なる市場環境に応じて取引サイクルを柔軟に調整することができます.
戦略原則
戦略の基本論理は次の主要な要素に基づいています 1. 14 期間の RSI インディケーターを使用して価格の勢いを計算します. 2. 副次確認のために14期ストカスティックRSIを使用 3. RSIが35未満でストカストティックRSIが20未満のときに購入信号をトリガーします 4. RSI が 70 以上,ストカスティック RSI が 80 以上であるとき,トリガーはセールシグナルです 5. 信号安定性のためにストカスティックRSIに3期間のSMA平滑を適用する 6. 日々の時間枠と週間の時間枠の間の切り替えをサポート
戦略 の 利点
- 双重信号確認メカニズムにより 誤信号の干渉が著しく減少します
- 指標パラメータは市場の変動に柔軟に調整できます
- SMAのスムージングは信号ノイズを効果的に減少させる
- 複数の期間の取引をサポートし,異なる投資家のニーズを満たす
- 視覚インターフェースは,分析のために直感的に購入/販売信号を表示します
- 明確なコード構造,維持し,さらに開発しやすい
戦略リスク
- 横向市場で過剰な取引信号を生む可能性があります
- 急速なトレンド逆転時の潜在的な信号遅延
- パラメータの設定が正しくない場合,取引機会を逃す可能性があります.
- 市場波動が強い場合,誤った信号が発生する可能性があります.
- リスク管理のために適切なストップ・ロスの設定が必要です.
戦略の最適化方向
- 信号の信頼性を向上させるためにMACDやEMAのような傾向判断指標を導入する
- 音量因子を追加して信号品質を向上させる
- リスク管理を最適化するために動的なストップ・ロスのメカニズムを実施する
- 戦略の安定性のための適応パラメータ最適化システムを開発する
- 取引のタイミングを最適化するために市場変動指標を組み込むことを検討する
概要
この戦略は,RSIとストカスティックRSIの利点を組み合わせて信頼性の高い取引システムを構築する.ダブルシグナル確認メカニズムは誤ったシグナルを効果的に減少させ,柔軟なパラメータ設定は強い適応性を提供する.継続的な最適化と改善を通じて,この戦略はさまざまな市場条件で安定したパフォーマンスを維持する約束を示している.
/*backtest
start: 2024-11-16 00:00:00
end: 2024-12-15 08:00:00
period: 1h
basePeriod: 1h
exchanges: [{"eid":"Futures_Binance","currency":"BTC_USDT"}]
*/

//@version=5
strategy("BTC Buy & Sell Strategy (RSI & Stoch RSI)", overlay=true)

// Input Parameters
rsi_length = input.int(14, title="RSI Length")
stoch_length = input.int(14, title="Stochastic Length")
stoch_smooth_k = input.int(3, title="Stochastic %K Smoothing")
stoch_smooth_d = input.int(3, title="Stochastic %D Smoothing")

// Threshold Inputs
rsi_buy_threshold = input.float(35, title="RSI Buy Threshold")
stoch_buy_threshold = input.float(20, title="Stochastic RSI Buy Threshold")
rsi_sell_threshold = input.float(70, title="RSI Sell Threshold")
stoch_sell_threshold = input.float(80, title="Stochastic RSI Sell Threshold")

use_weekly_data = input.bool(false, title="Use Weekly Data", tooltip="Enable to use weekly timeframe for calculations.")

// Timeframe Configuration
timeframe = use_weekly_data ? "W" : timeframe.period

// Calculate RSI and Stochastic RSI
rsi_value = request.security(syminfo.tickerid, timeframe, ta.rsi(close, rsi_length))
stoch_rsi_k_raw = request.security(syminfo.tickerid, timeframe, ta.stoch(close, high, low, stoch_length))
stoch_rsi_k = ta.sma(stoch_rsi_k_raw, stoch_smooth_k)
stoch_rsi_d = ta.sma(stoch_rsi_k, stoch_smooth_d)

// Define Buy and Sell Conditions
buy_signal = (rsi_value < rsi_buy_threshold) and (stoch_rsi_k < stoch_buy_threshold)
sell_signal = (rsi_value > rsi_sell_threshold) and (stoch_rsi_k > stoch_sell_threshold)

// Strategy Execution
if buy_signal
    strategy.entry("Long", strategy.long, comment="Buy Signal")

if sell_signal
    strategy.close("Long", comment="Sell Signal")

// Plot Buy and Sell Signals
plotshape(buy_signal, style=shape.labelup, location=location.belowbar, color=color.green, title="Buy Signal", size=size.small, text="BUY")
plotshape(sell_signal, style=shape.labeldown, location=location.abovebar, color=color.red, title="Sell Signal", size=size.small, text="SELL")

// Plot RSI and Stochastic RSI for Visualization
hline(rsi_buy_threshold, "RSI Buy Threshold", color=color.green)
hline(rsi_sell_threshold, "RSI Sell Threshold", color=color.red)

plot(rsi_value, color=color.blue, linewidth=2, title="RSI Value")
plot(stoch_rsi_k, color=color.purple, linewidth=2, title="Stochastic RSI K")
plot(stoch_rsi_d, color=color.orange, linewidth=1, title="Stochastic RSI D")
関連性
- 多指標量的な取引戦略 - スーパー指標7対1戦略
- RSI 過剰購入/過剰売却量的な取引戦略の多指標トレンド
- 戦略をフォローするダブル移動平均チャネルトレンド
- SMA-RSI-MACD マルチインジケータ ダイナミック・リミット・オーダー・トレーディング・戦略
- 多期EMA横断高利率トレンド 戦略をフォローする (高度)
- GチャネルとEMAをベースにした定量的な長期短期間の切り替え戦略
- ダイナミック・ダブル・ムービング・平均・クロスオーバー・量子的取引戦略
- 多指標の包括的な取引戦略:モメンタム,過剰購入/過剰販売,および不安定性の完璧な組み合わせ
- マルチレベルダイナミックMACDトレンドフォロー戦略 52週間の高低延長分析システム
- 多戦略技術分析取引システム
もっと
- リスクマネジメントを含む戦略に従った二重移動平均傾向
- トリプル・スーパートレンドとボリンジャー・バンド 多指標トレンド 戦略をフォローする
- 多トレンドラインブレイクモメント量的な戦略
- RSIモメンタムとADXトレンド強度に基づく資本管理システム
- 多期流動性ピボットヒートマップ戦略
- ATRベースの取利益とストップ損失を伴う戦略をフォローする多期間の傾向
- アダプティブ トレイリングストップの先端トレンドフォロー戦略
- RSIモメントフィルタを搭載した戦略をフォローするマルチテクニカル指標傾向
- 動的リスク管理の指数関数移動平均のクロスオーバー戦略
- 双指数移動平均値と相対強度指標のクロスオーバー戦略
- ダイナミックレンジフィルターによる高度な定量的なトレンドキャプチャ戦略
- TradingView信号実行ポリシー (内蔵Httpサービス版)
- RSIとMACD統合に基づく高度な5日間のクロス分析戦略
- 2つのRSI指標に基づく適応範囲取引システム
- ダイナミック・ダブル・スーパートレンド・ボリューム・価格戦略
- ブラック・スワン・ボラティリティと移動平均のクロスオーバー・モメント・トラッキング戦略
- Bollinger Bands と SuperTrend を組み合わせるインテリジェント・ボラティリティ・レンジ・トレーディング・戦略
- ダイナミックストップ・ロスのシステムによる戦略をフォローする多指標シネージーシート
- ボリンジャー・バンド 勢い ブレイク 戦略をフォローする適応傾向
- MACD-ATRの実装による強化された平均逆転戦略