ダイナミック・トレンド・モメント・オプティマイゼーション・戦略
作者: リン・ハーンチャオチャン開催日:2024年12月20日 14:55:02タグ:RSIマックド

概要
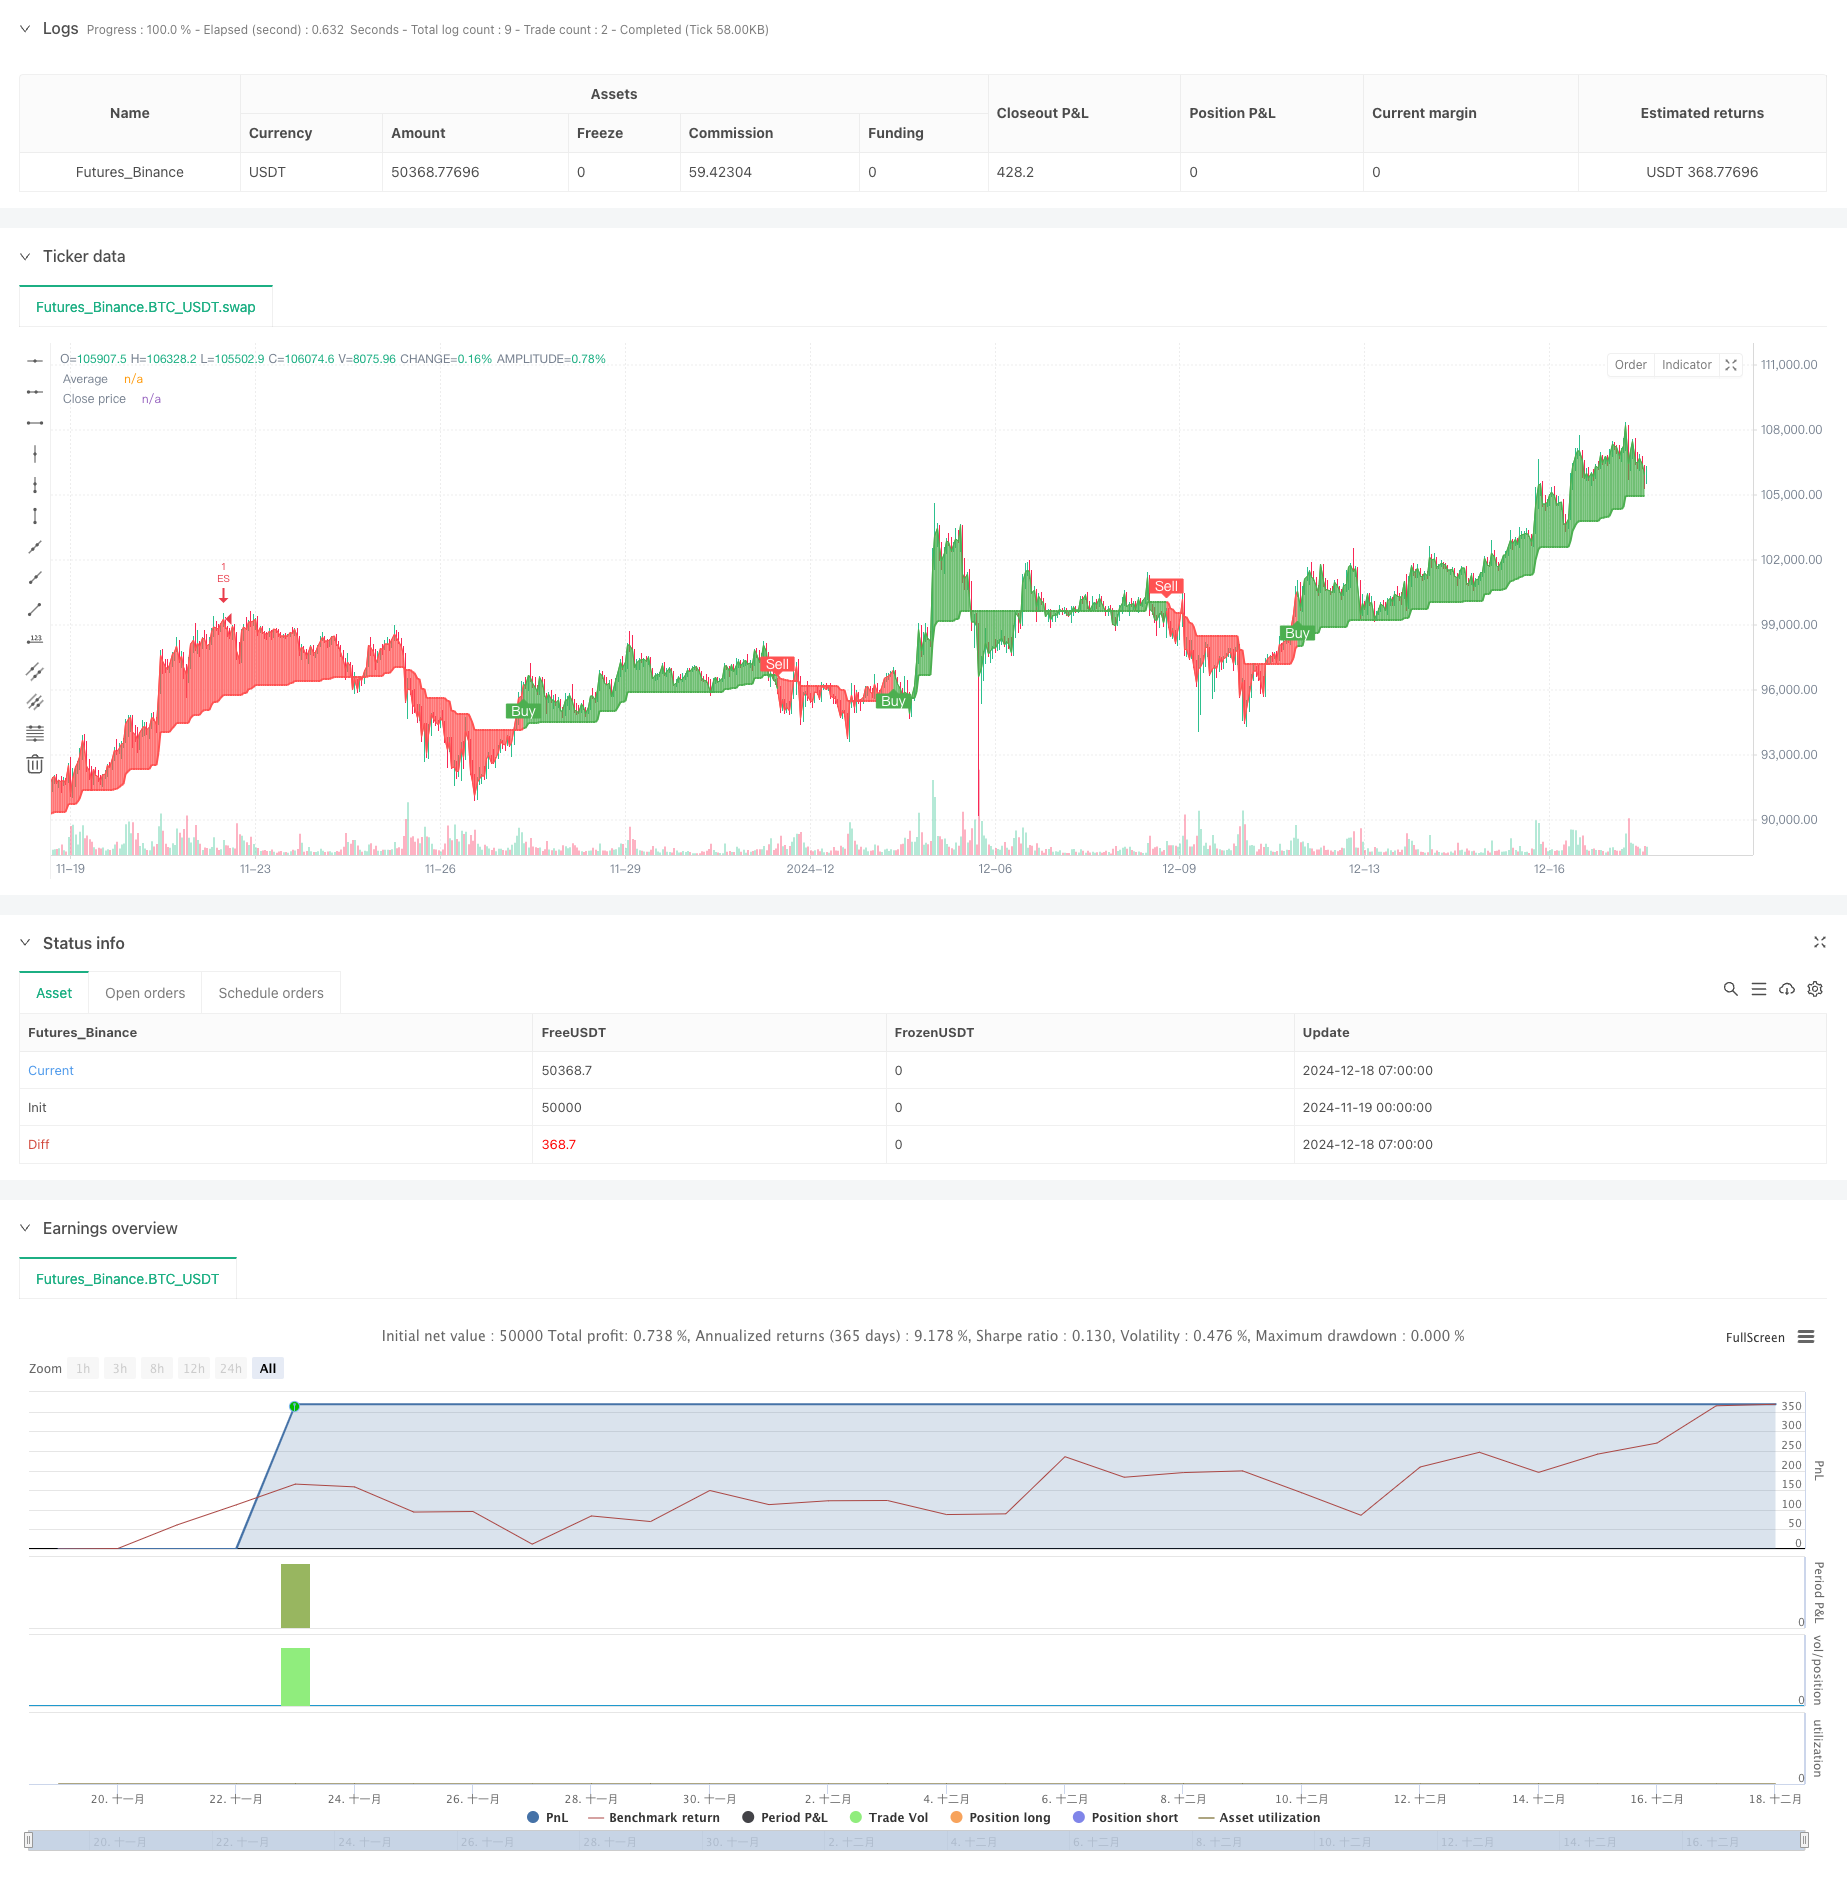
この戦略は,Gチャネル,RSI,MACD指標を統合した高度なトレンドフォローティングシステムである.モメンタム指標を組み合わせながら,サポートとレジスタンスゾーンを動的に計算することによって,高い確率の取引機会を特定する.コアは,より正確な信号生成のためにモメンタム変化を確認するために,RSIとMACDを使用して,市場傾向を決定するためにカスタムGチャネル指標を使用することにある.
戦略原則
この戦略は,シグナル信頼性を確保するために三重フィルタリングメカニズムを使用している.まず,Gチャネルは,指定された期間における最大値と最低値を計算することによって,サポートとレジスタンスゾーンを動的に構築する.価格がチャネルを突破すると,システムは潜在的なトレンド逆転点を特定する.次に,RSIインジケーターは,市場は過買いまたは過売状態にあるかどうかを確認し,より価値のある取引機会をフィルタリングするのに役立ちます.最後に,MACDインジケーターはヒストグラム値を通じてモメント方向と強さを確認します.すべての3つの条件を満たしたときにのみ取引信号が生成されます.
戦略 の 利点
- 多次元信号確認メカニズムは,取引の精度を大幅に向上させる.
- ダイナミックストップ・ロースとテイク・プロフィートの設定は,リスクを効果的に制御する
- Gチャネル
の適応性により,戦略は異なる市場環境に適応できます - ポジションと資金管理を含む包括的なリスク管理システム
- 分析と最適化のための取引信号を直感的に表示します
戦略リスク
- 不安定な市場において誤った信号を生む可能性があるため,市場環境の識別が必要である
- パラメータの最適化により,オーバーフィッティングリスクが生じる可能性があります.
- 多数の指標が高変動期間に遅延効果を生む可能性があります
- 誤ったストップ・ロスの配置は,過剰な引き上げにつながる可能性があります.
戦略の最適化方向
- 市場環境識別モジュールを導入し,異なる市場状態で異なるパラメータ設定を使用する
- 市場変動に基づくストップ・ロスのレベルを動的に調整するための適応性のあるストップ・ロスのメカニズムを開発する
- 信号信頼性を向上させるため,音量分析指標を追加する
- 遅延効果を減らすためにGチャネル計算方法を最適化
概要
この戦略は,複数の技術指標の包括的な使用を通じて完全な取引システムを構築する.その主な利点は,多次元信号確認メカニズムと包括的なリスク管理システムにある.継続的な最適化と改善を通じて,この戦略は,さまざまな市場環境で安定したパフォーマンスを維持する約束を示している.トレーダーは,ライブ取引の前に,異なるパラメータの組み合わせを徹底的にテストし,特定の市場特性に基づいて適切な調整を行うことをお勧めする.
/*backtest
start: 2024-11-19 00:00:00
end: 2024-12-18 08:00:00
period: 1h
basePeriod: 1h
exchanges: [{"eid":"Futures_Binance","currency":"BTC_USDT"}]
*/

//@version=6
strategy("VinSpace Optimized Strategy", shorttitle="VinSpace Magic", overlay=true, default_qty_type=strategy.percent_of_equity, default_qty_value=10)

// Input Parameters
length = input.int(100, title="Length")
src = input(close, title="Source")
stop_loss_pct = input.float(1, title="Stop Loss (%)") / 100
take_profit_pct = input.float(3, title="Take Profit (%)") / 100
rsi_length = input.int(14, title="RSI Length")
rsi_overbought = input.int(70, title="RSI Overbought")
rsi_oversold = input.int(30, title="RSI Oversold")
macd_short = input.int(12, title="MACD Short Length")
macd_long = input.int(26, title="MACD Long Length")
macd_signal = input.int(9, title="MACD Signal Length")

// ---- G-Channel Calculations ----
var float a = na
var float b = na

a := math.max(src, na(a[1]) ? src : a[1]) - (na(a[1]) ? 0 : (a[1] - b[1]) / length)
b := math.min(src, na(b[1]) ? src : b[1]) + (na(a[1]) ? 0 : (a[1] - b[1]) / length)
avg = (a + b) / 2

// ---- RSI Calculation ----
rsi = ta.rsi(src, rsi_length)

// ---- MACD Calculation ----
[macdLine, signalLine, _] = ta.macd(src, macd_short, macd_long, macd_signal)
macd_hist = macdLine - signalLine

// ---- Trend Detection Logic ----
crossup = b[1] < close[1] and b > close
crossdn = a[1] < close[1] and a > close
bullish = ta.barssince(crossdn) <= ta.barssince(crossup)
c = bullish ? color.new(color.green, 0) : color.new(color.red, 0)

// Plotting the Average
p1 = plot(avg, "Average", color=c, linewidth=2)
p2 = plot(close, "Close price", color=c, linewidth=1)

// Adjusted fill with transparency
fill(p1, p2, color=color.new(c, 90))

// ---- Buy and Sell Signals ----
showcross = input(true, title="Show Buy/Sell Labels")
plotshape(showcross and bullish and not bullish[1], location=location.belowbar, style=shape.labelup, color=color.green, size=size.small, text="Buy", textcolor=color.white, offset=-1)
plotshape(showcross and not bullish and bullish[1], location=location.abovebar, style=shape.labeldown, color=color.red, size=size.small, text="Sell", textcolor=color.white, offset=-1)

// ---- Entry and Exit Conditions ----
enterLong = bullish and rsi < rsi_oversold and macd_hist > 0
enterShort = not bullish and rsi > rsi_overbought and macd_hist < 0

// Exit Conditions
exitLong = ta.crossunder(close, avg) or rsi > rsi_overbought
exitShort = ta.crossover(close, avg) or rsi < rsi_oversold

// Position Size (example: 10% of equity)
posSize = 1

// Submit Entry Orders
if enterLong
    strategy.entry("EL", strategy.long, qty=posSize)

if enterShort
    strategy.entry("ES", strategy.short, qty=posSize)

// Submit Exit Orders
if exitLong
    strategy.close("EL")

if exitShort
    strategy.close("ES")

// Set Stop Loss and Take Profit for the trades
strategy.exit("Take Profit/Stop Loss Long", from_entry="EL", loss=stop_loss_pct * close, profit=take_profit_pct * close)
strategy.exit("Take Profit/Stop Loss Short", from_entry="ES", loss=stop_loss_pct * close, profit=take_profit_pct * close)
関連性
- ダルバスのボックス 脱出とリスク管理戦略
- 価格格差戦略 v1.0
- RSIとMACD統合に基づく高度な5日間のクロス分析戦略
- RSI と MACD の組み合わせた長期短期戦略
- トレンドをフォローするクラウド・モメンタム・ディバージェンスの戦略
- 多指標のダイバージェンス・トレーディング・戦略,適応性のある取利益とストップ・ロスを用いる
- ダイナミックストップ管理付きのRSI-MACDマルチシグナル取引システム
- MACD と RSI の組み合わせた長期取引戦略
- 複数の指標を備えた インテリジェントピラミッド戦略
- Bollinger Bands と RSI 統合による適応性振動トレンド取引戦略
もっと
- アダプティブ・EMA・ダイナミック・ポジション・ブレイクアウト・トレード・戦略
- 多指標動的取引最適化戦略
- ダイナミック・プロフィット・ロック (Dynamic Profit Lock) の量的な取引戦略を持つマルチ-SMAゾーンブレイク
- 動的波動傾向追跡戦略
- 量確認による構造の破裂 多条件のインテリジェント・トレーディング戦略
- 多指標動的ストップ・ロスの動向トレンド・トレード戦略
- Fibonacci リトレースメント レベルに基づく定量的な取引戦略を伴う多条件トレンド
- トレーディング戦略をフォローする多動平均傾向
- マルチフィルタートレンドブレークスルー スマート移動平均取引戦略
- ダイナミックなEMAの突破と逆転戦略
- 多レベルATHダイナミックトラッキングの3つのエントリー戦略
- 適応型VWAP帯とガーマンのクラスの波動性ダイナミック追跡戦略
- 多指標トレンド 取引オプションの追跡 EMAクロス戦略
- 複数の指標による変動取引のRSI-EMA-ATR戦略
- GチャネルとEMAをベースにした定量的な長期短期間の切り替え戦略
- リスクマネジメントを含む戦略に従った二重移動平均傾向
- トリプル・スーパートレンドとボリンジャー・バンド 多指標トレンド 戦略をフォローする
- 多トレンドラインブレイクモメント量的な戦略
- RSIモメンタムとADXトレンド強度に基づく資本管理システム
- 多期流動性ピボットヒートマップ戦略