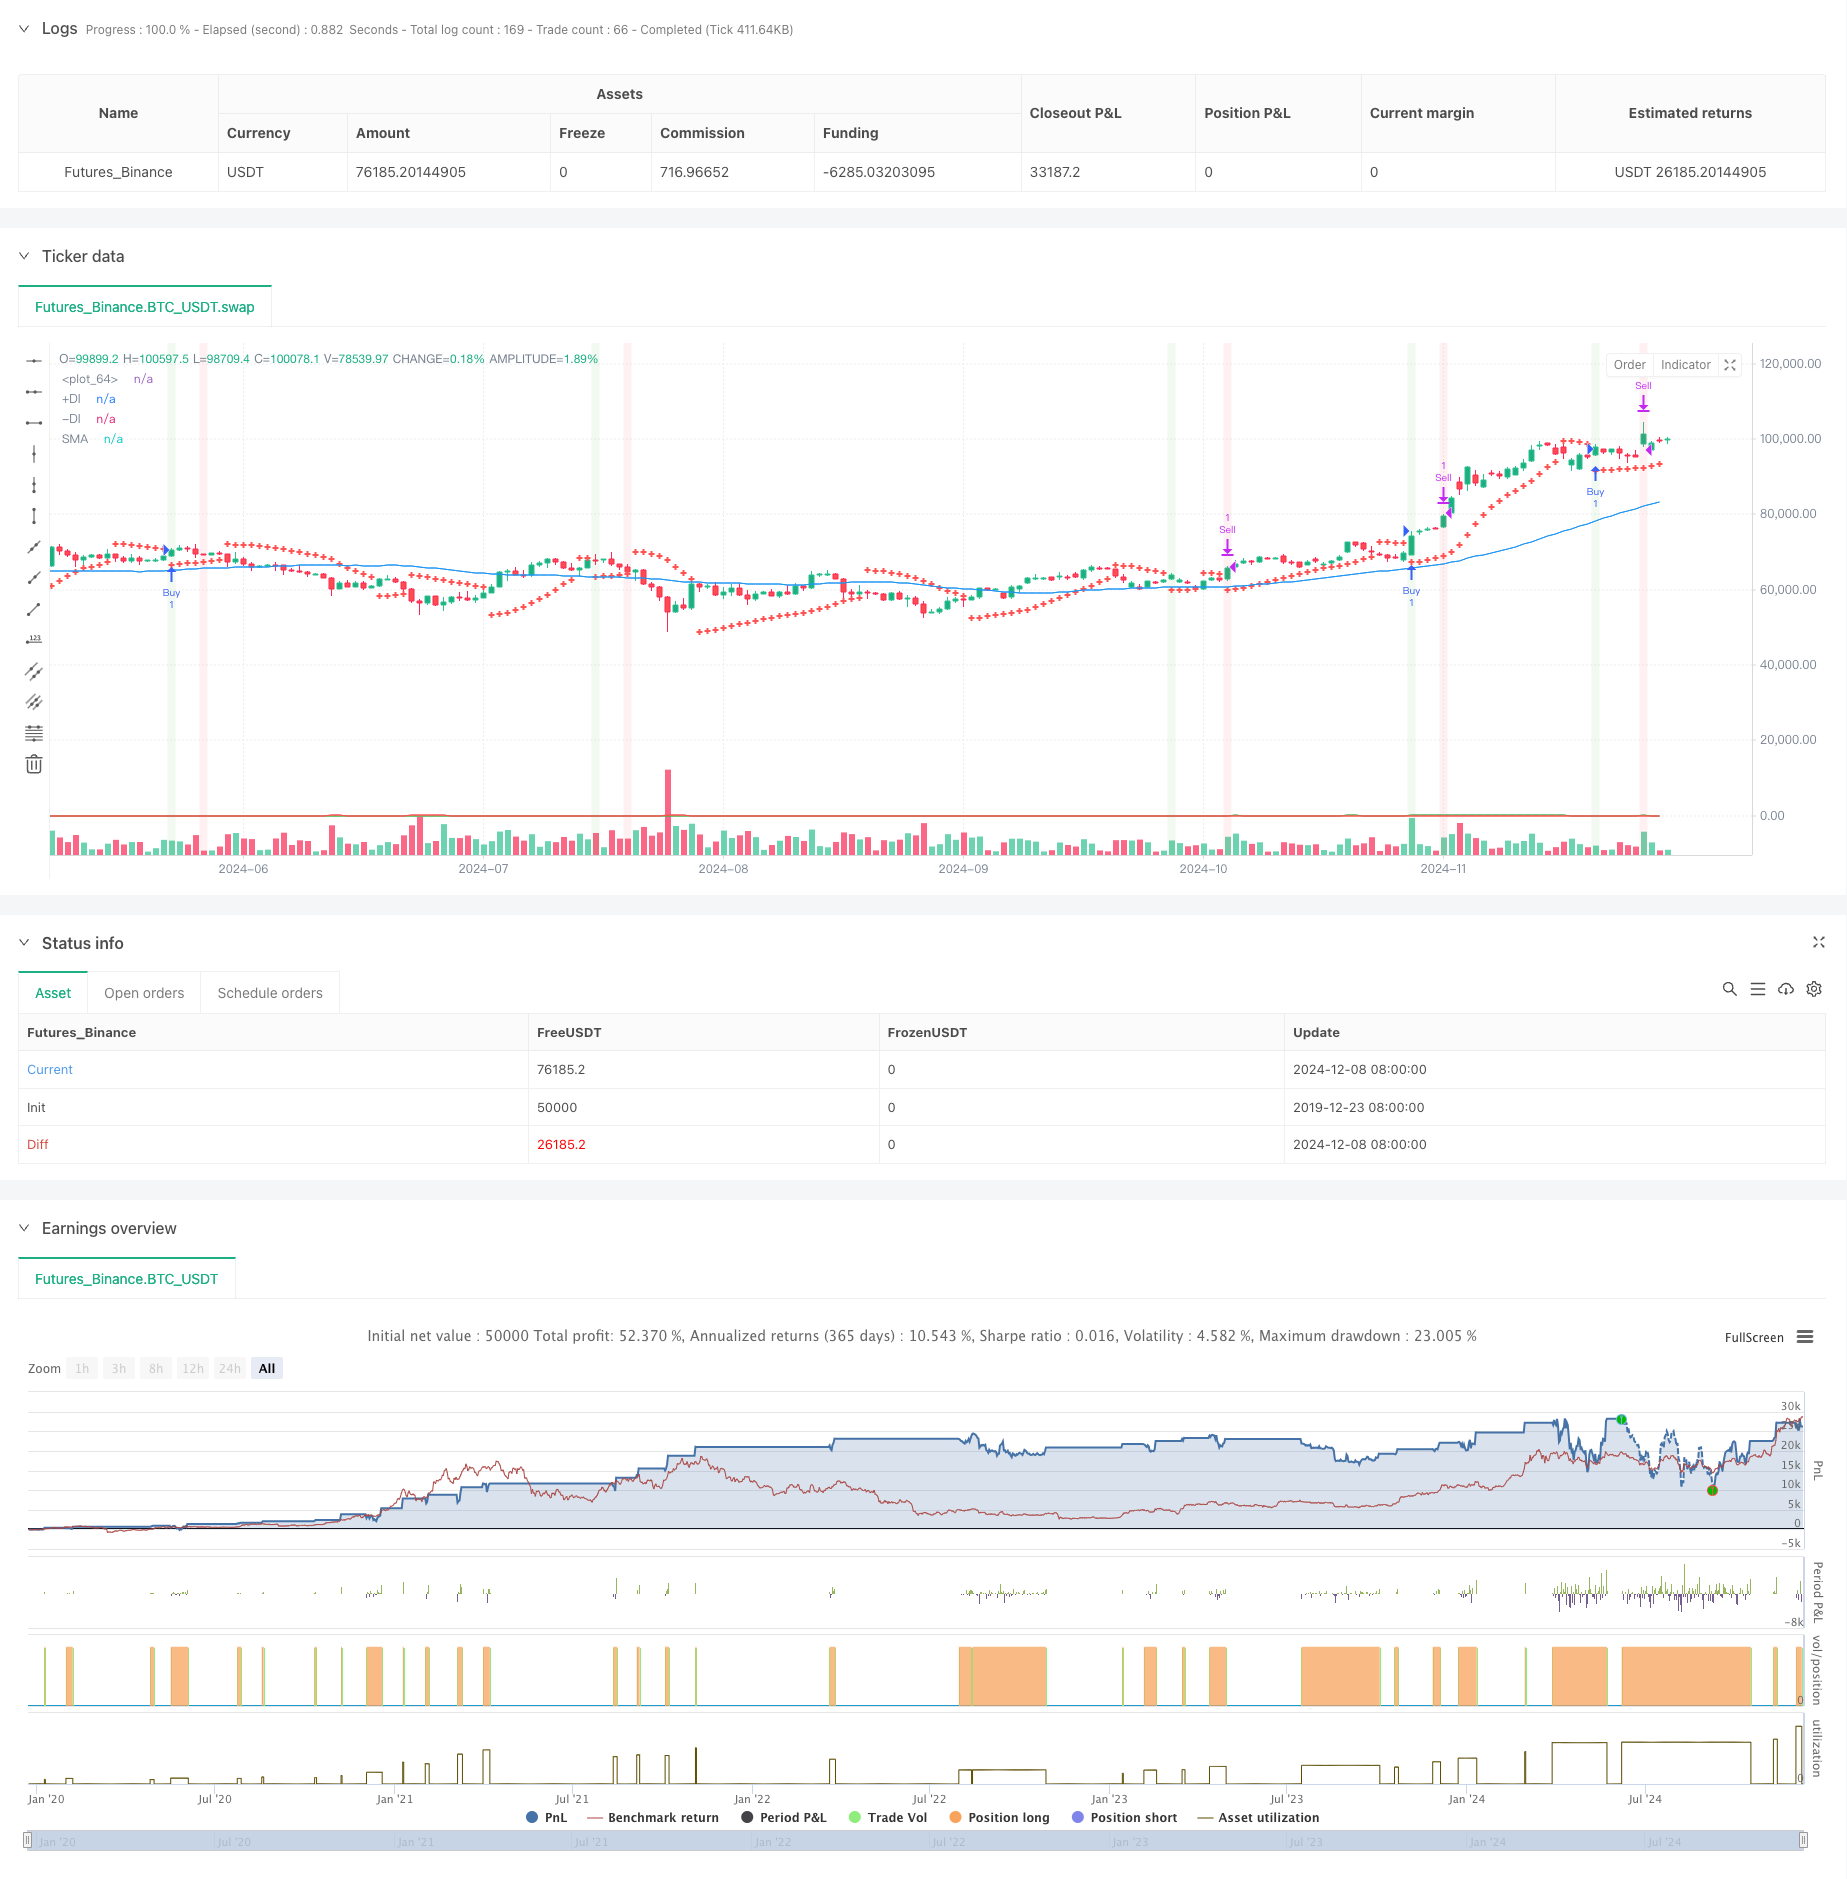
개요
이 전략은 여러 기술적 지표들을 결합한 트렌드 추적 거래 시스템이다. 이 전략은 주로 패러블라인 전환 지표 ((SAR), 이동 평균 ((SMA) 및 방향 운동 지표 ((DMI) 를 사용하여 시장의 추세와 진입 시기를 결정하고, 퍼센트 정지 및 MACD 후퇴를 통해 진출을 최적화한다. 전략 설계의 핵심 아이디어는 강한 추세 이후에 진출을 확인하고, 미리 설정된 수익 목표가 달성되거나 트렌드 전환 신호가 발생했을 때 적시에 진출한다.
전략 원칙
이 전략은 거래 신호를 확인하기 위해 여러 층의 필터링 메커니즘을 사용합니다.
- SAR 지표의 교차를 통해 초기 거래 신호를 잡기
- 50주기 SMA를 사용하여 전체 트렌드 방향을 판단합니다.
- DMI 지표를 사용하여 트렌드 강도 및 방향을 확인합니다.
- 입시 조건이 동시에 충족되어야 합니다: 가격 위에 SAR를 착용하고, 가격 위에 SMA를 착용하고, DMI가 다중 트렌드를 나타냅니다.
- 출장 이중 메커니즘: 3%의 목표 수익을 달성하거나 MACD 사각지대가 나타납니다.
- ATR 지표는 시장의 변동성을 참조하기 위해 사용된다.
전략적 이점
- 가짜 신호를 줄이기 위한 다중 기술 지표 교차 검증
- 트렌드 추적과 동력 지표가 결합되어 거래 성공률을 높여줍니다.
- 고정된 비율로 고정된 전략은 안정적인 수익을 보장합니다.
- MACD는 동향이 반전되는 것을 피하기 위해 외출 메커니즘에서 벗어났습니다.
- 전략 매개 변수는 시장 특성에 따라 유연하게 조정됩니다.
- ATR을 사용하여 변동성을 모니터링하고 시장 상태를 참조합니다.
전략적 위험
- 여러 지표로 인해 신호 지연이 발생할 수 있습니다.
- 고정 비율 제약이 강력한 추세에서 조기 퇴출될 수 있다
- 하지만, 그 위험은 더 커질 수 있습니다.
- 위축 시장에서 너무 많은 가짜 신호가 발생할 수 있습니다.
- DMI 지표는 흔들리는 시장에서 잘못된 신호를 줄 수 있습니다.
전략 최적화 방향
- ATR 기반의 동적 상쇄와 같은 적응 상쇄 메커니즘을 도입
- 변동율 필터를 개발하여 높은 변동의 기간 동안 지주 규모를 조정합니다.
- MACD 변수를 최적화하여 트렌드 전환 판단의 정확성을 향상시킵니다.
- 볼륨 확인 메커니즘을 추가하여 신호 안정성 향상
- 동적 스톱 메커니즘을 개발하여 시장의 변동에 따라 목표 수익을 조정합니다.
요약하다
이 전략은 여러 기술 지표의 협동적인 협동으로 비교적 완전한 트렌드 추적 거래 시스템을 구축한다. 이 전략의 장점은 신호 확인의 신뢰성과 위험 제어의 유연성이다. 약간의 후퇴 위험이 존재하지만, 매개 변수 최적화 및 동적 관리 장치에 가입함으로써 전략의 전체적인 성과는 여전히 좋은 응용 가치가 있다. 지속적인 최적화 및 개선으로 전략은 안정적인 거래 도구가 될 수 있다.
전략 소스 코드
/*backtest
start: 2019-12-23 08:00:00
end: 2024-12-09 08:00:00
period: 1d
basePeriod: 1d
exchanges: [{"eid":"Futures_Binance","currency":"BTC_USDT"}]
*/

//@version=5
strategy("Swing Trading Strategy with DMI", overlay=true)

// Define parameters
sarStart = input.float(0.02, title="SAR Start")
sarIncrement = input.float(0.02, title="SAR Increment")
sarMax = input.float(0.2, title="SAR Max")
atrLength = input.int(10, title="ATR Length")
macdShort = input.int(12, title="MACD Short Length")
macdLong = input.int(26, title="MACD Long Length")
macdSignal = input.int(9, title="MACD Signal Length")
smaLength = input.int(50, title="SMA Length")
dmiLength = input.int(14, title="DMI Length")
adxSmoothing = input.int(14, title="ADX Smoothing") // Smoothing period for ADX
targetProfitPercentage = input.float(3.0, title="Target Profit Percentage")

// Calculate SAR
sar = ta.sar(sarStart, sarIncrement, sarMax)

// Calculate ATR
atr = ta.atr(atrLength)

// Calculate MACD
[macdLine, macdSignalLine, _] = ta.macd(close, macdShort, macdLong, macdSignal)

// Calculate SMA
sma = ta.sma(close, smaLength)
bullishTrend = close > sma

// Calculate DMI
[plusDI, minusDI, adx] = ta.dmi(dmiLength, adxSmoothing) // Specify ADX smoothing period

// Determine if DMI is bullish
dmiBullish = plusDI > minusDI

// Define buy signal
buySignal = ta.crossover(close, sar) and bullishTrend and dmiBullish

// Track buy price and position state
var float buyPrice = na
var bool inPosition = false

// Enter position
if (buySignal and not inPosition)
    buyPrice := close
    inPosition := true
    strategy.entry("Buy", strategy.long)

// Define target price (3% above the buy price)
targetPrice = na(buyPrice) ? na : buyPrice * (1 + targetProfitPercentage / 100)

// Define MACD sell signal
macdSellSignal = ta.crossunder(macdLine, macdSignalLine)

// Define sell signal
sellSignal = inPosition and (close >= targetPrice or macdSellSignal)

// Exit position
if (sellSignal)
    inPosition := false
    strategy.exit("Sell", "Buy", limit=targetPrice)

// Plot SAR on the chart
plot(sar, color=color.red, style=plot.style_cross, linewidth=2)

// Plot SMA (optional, for visualizing the trend)
plot(sma, color=color.blue, title="SMA")

// Plot DMI +DI and -DI
plot(plusDI, color=color.green, title="+DI")
plot(minusDI, color=color.red, title="-DI")

// Plot buy signal on the chart
//plotshape(series=buySignal, location=location.belowbar, color=color.green, style=shape.labelup, text="BUY")

// Plot sell signal on the chart
//plotshape(series=sellSignal, location=location.abovebar, color=color.red, style=shape.labeldown, text="SELL")

// Optional: Plot background color for buy and sell signals
bgcolor(buySignal ? color.new(color.green, 90) : na, title="Buy Signal Background")
bgcolor(sellSignal ? color.new(color.red, 90) : na, title="Sell Signal Background")