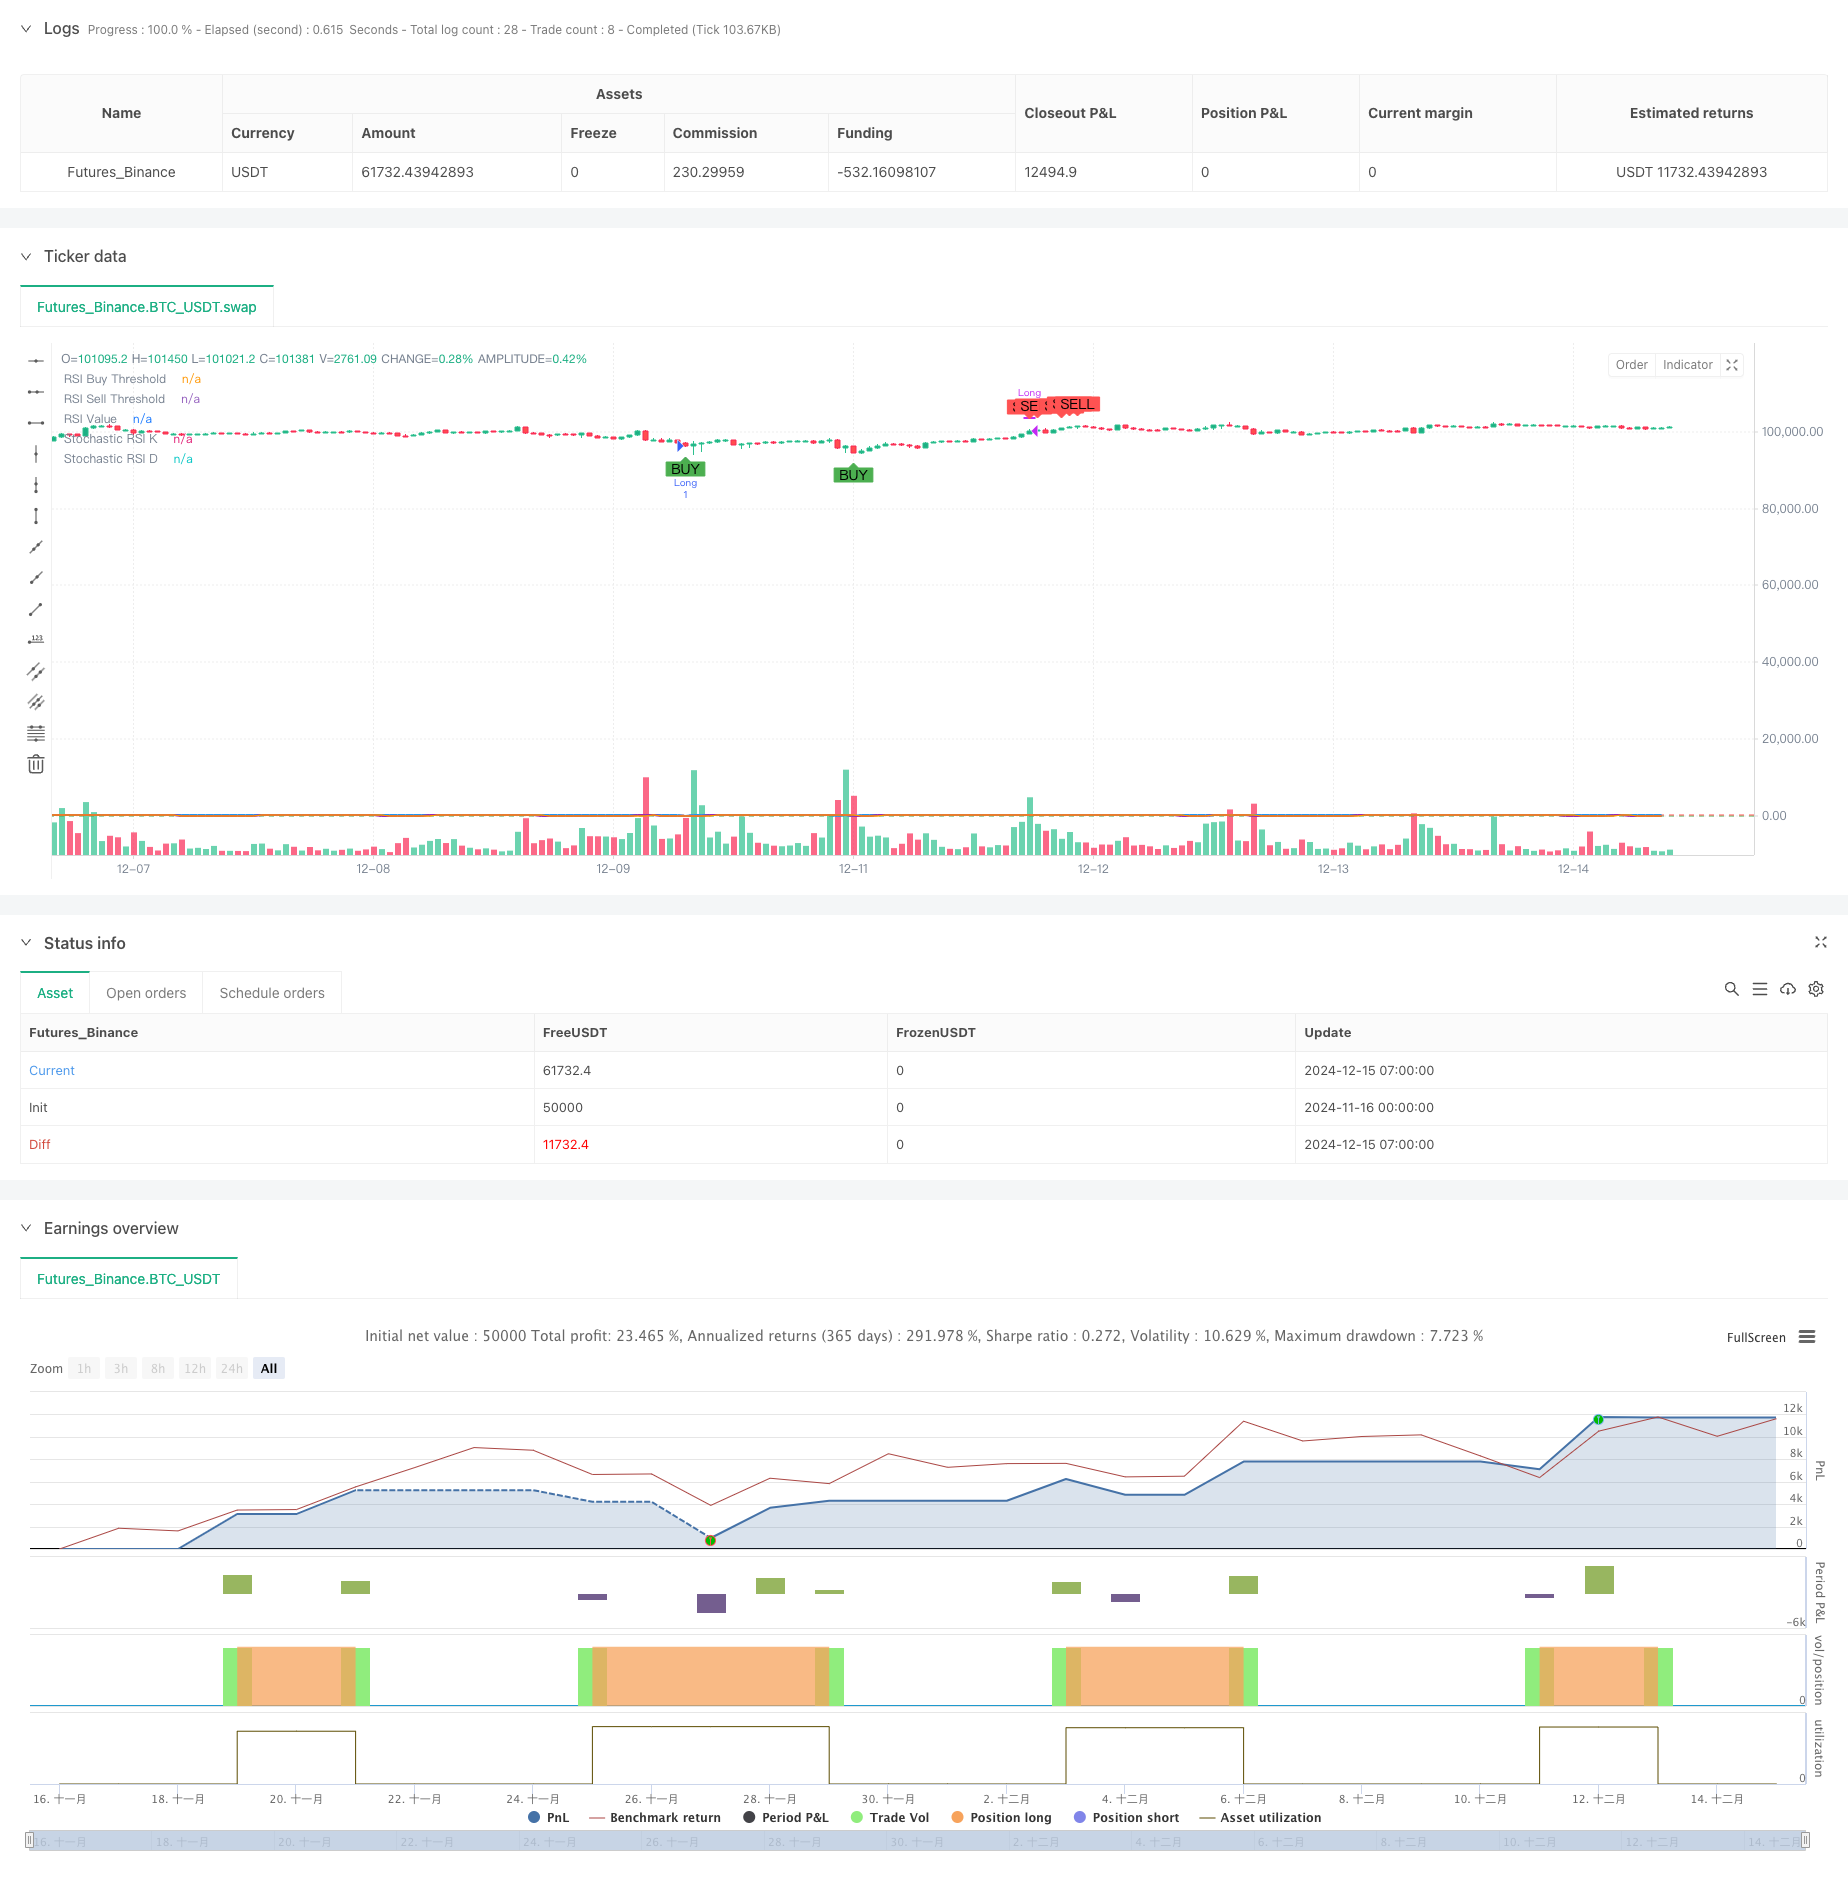
이중 모멘텀 오시레이터 스마트 타이밍 거래 전략
저자:차오장, 날짜: 2024-12-17 14:36:46태그:RSISMAEMAMACD

전반적인 설명
이 전략은 두 가지 모멘텀 지표: RSI와 스토카스틱 RSI를 기반으로 하는 지능형 거래 시스템이다. 이 전략은 두 개의 모멘텀 오시레이터에서 신호를 결합하여 잠재적인 거래 기회를 포착하여 시장 과잉 구매 및 과잉 판매 상태를 식별합니다. 시스템은 기간 적응을 지원하며 다른 시장 환경에 따라 거래 주기를 유연하게 조정할 수 있습니다.
전략 원칙
이 전략의 핵심 논리는 다음의 핵심 요소에 기초합니다. 1. 가격 동력을 계산하기 위해 14 기간 RSI 지표를 사용합니다. 2. 2차 확인을 위해 14주기 스토카스틱 RSI를 사용합니다. 3. RSI가 35 이하이고 스토카스틱 RSI가 20 이하일 때 신호를 구매합니다. 4. 트리거는 RSI가 70 이상이고 스토카스틱 RSI가 80 이상일 때 신호를 판매합니다. 5. 신호 안정성을 위해 스토카스틱 RSI에 3 기간 SMA 평형을 적용합니다. 6. 매일 및 주간 시간 프레임 사이 전환 지원
전략적 장점
- 이중 신호 확인 메커니즘은 거짓 신호 간섭을 현저히 줄입니다.
- 지표 매개 변수는 시장 변동성에 유연하게 조정할 수 있습니다.
- SMA 평형화 효과적 신호 소음을 감소
- 다양한 투자자의 필요를 충족시키기 위해 여러 기간 거래를 지원합니다
- 시각 인터페이스는 분석을 위해 구매/판매 신호를 직관적으로 표시합니다
- 명확한 코드 구조, 유지 및 추가 개발에 쉬운
전략 위험
- 부적절한 시장에서 과도한 거래 신호를 생성 할 수 있습니다.
- 급속한 트렌드 반전 시 신호 지연 가능성
- 부적절한 매개 변수 설정은 놓친 거래 기회로 이어질 수 있습니다.
- 높은 시장 변동성 동안 잘못된 신호가 발생할 수 있습니다.
- 위험 통제를 위해 적절한 스톱 로스 설정을 요구합니다.
전략 최적화 방향
- 신호 신뢰성을 향상시키기 위해 MACD 또는 EMA와 같은 트렌드 판단 지표를 도입하십시오.
- 신호 품질을 향상시키기 위해 볼륨 요인을 추가합니다.
- 리스크 관리 최적화를 위해 동적 스톱 로스 메커니즘을 구현
- 전략 안정성을 위한 적응적 매개 변수 최적화 시스템을 개발
- 거래 시기를 최적화하기 위해 시장 변동성 지표를 통합하는 것을 고려하십시오.
요약
이 전략은 RSI와 스토카스틱 RSI의 장점을 결합하여 신뢰할 수있는 거래 시스템을 구축합니다. 이중 신호 확인 메커니즘은 잘못된 신호를 효과적으로 줄이고 유연한 매개 변수 설정은 강력한 적응력을 제공합니다. 지속적인 최적화 및 개선으로 전략은 다양한 시장 조건에서 안정적인 성능을 유지하는 것을 약속합니다.
/*backtest
start: 2024-11-16 00:00:00
end: 2024-12-15 08:00:00
period: 1h
basePeriod: 1h
exchanges: [{"eid":"Futures_Binance","currency":"BTC_USDT"}]
*/

//@version=5
strategy("BTC Buy & Sell Strategy (RSI & Stoch RSI)", overlay=true)

// Input Parameters
rsi_length = input.int(14, title="RSI Length")
stoch_length = input.int(14, title="Stochastic Length")
stoch_smooth_k = input.int(3, title="Stochastic %K Smoothing")
stoch_smooth_d = input.int(3, title="Stochastic %D Smoothing")

// Threshold Inputs
rsi_buy_threshold = input.float(35, title="RSI Buy Threshold")
stoch_buy_threshold = input.float(20, title="Stochastic RSI Buy Threshold")
rsi_sell_threshold = input.float(70, title="RSI Sell Threshold")
stoch_sell_threshold = input.float(80, title="Stochastic RSI Sell Threshold")

use_weekly_data = input.bool(false, title="Use Weekly Data", tooltip="Enable to use weekly timeframe for calculations.")

// Timeframe Configuration
timeframe = use_weekly_data ? "W" : timeframe.period

// Calculate RSI and Stochastic RSI
rsi_value = request.security(syminfo.tickerid, timeframe, ta.rsi(close, rsi_length))
stoch_rsi_k_raw = request.security(syminfo.tickerid, timeframe, ta.stoch(close, high, low, stoch_length))
stoch_rsi_k = ta.sma(stoch_rsi_k_raw, stoch_smooth_k)
stoch_rsi_d = ta.sma(stoch_rsi_k, stoch_smooth_d)

// Define Buy and Sell Conditions
buy_signal = (rsi_value < rsi_buy_threshold) and (stoch_rsi_k < stoch_buy_threshold)
sell_signal = (rsi_value > rsi_sell_threshold) and (stoch_rsi_k > stoch_sell_threshold)

// Strategy Execution
if buy_signal
    strategy.entry("Long", strategy.long, comment="Buy Signal")

if sell_signal
    strategy.close("Long", comment="Sell Signal")

// Plot Buy and Sell Signals
plotshape(buy_signal, style=shape.labelup, location=location.belowbar, color=color.green, title="Buy Signal", size=size.small, text="BUY")
plotshape(sell_signal, style=shape.labeldown, location=location.abovebar, color=color.red, title="Sell Signal", size=size.small, text="SELL")

// Plot RSI and Stochastic RSI for Visualization
hline(rsi_buy_threshold, "RSI Buy Threshold", color=color.green)
hline(rsi_sell_threshold, "RSI Sell Threshold", color=color.red)

plot(rsi_value, color=color.blue, linewidth=2, title="RSI Value")
plot(stoch_rsi_k, color=color.purple, linewidth=2, title="Stochastic RSI K")
plot(stoch_rsi_d, color=color.orange, linewidth=1, title="Stochastic RSI D")
관련
- 다중 지표 양적 거래 전략 - 슈퍼 지표 7대1 전략
- 다중 지표 트렌드 RSI 과잉 구매/ 과잉 판매 양적 거래 전략
- 이중 이동 평균 채널 트렌드 전략
- SMA-RSI-MACD 다중 지표 동적 한도 주문 거래 전략
- 다중 시간 프레임 EMA 크로스 높은 수익률 트렌드 전략 (첨단)
- G 채널과 EMA를 기반으로 한 양적 장기 단기 전환 전략
- 다단계 동적 MACD 트렌드 52주 높은/저한 연장 분석 시스템
- 다중 지표 포괄적 거래 전략: 모멘텀, 과잉 구매 / 과잉 판매 및 변동성의 완벽한 조합
- 동적 이중 이동 평균 크로스오버 양적 거래 전략
- 멀티 전략 기술 분석 거래 시스템
더 많은
- 이중 이동평균 트렌드 위험 관리 전략
- 트리플 슈퍼트렌드 및 볼링거 밴드 다중 지표 트렌드 다음 전략
- 멀티 트렌드 라인 브레이크 모멘텀 양적 전략
- RSI 모멘텀 및 ADX 트렌드 강도에 기반한 자본 관리 시스템
- 다중 시간 프레임 유동성 피보트 핫맵 전략
- ATR 기반의 취득 및 손실 중지 전략에 따른 다중 시간 프레임 트렌드
- 어댑티브 트레일링 스톱과 함께 고급 트렌드 다음 전략
- RSI 모멘텀 필터와 함께 전략에 따른 다기술 지표 트렌드
- 동적 리스크 관리 기하급수적 이동 평균 크로스오버 전략
- 이중 기하급수적 이동 평균 및 상대적 강도 지수 크로스오버 전략
- 동적 범위 필터와 함께 고급 양적 트렌드 캡처 전략
- 트레이딩뷰 신호 실행 정책 (내장된 HTTP 서비스 버전)
- RSI와 MACD 통합에 기초한 고급 5일 간 교차 분석 전략
- 듀얼 RSI 지표에 기반한 적응 범위 거래 시스템
- 동적 듀얼 슈퍼트렌드 부피 가격 전략
- 블랙 스완 변동성 및 이동 평균 크로스오버 모멘텀 추적 전략
- 볼링거 밴드와 슈퍼트렌드를 결합한 지능형 변동성 범위 거래 전략
- 다중 지표 시너지 트렌드 다이내믹 스톱 로스 시스템 전략
- 볼링거 밴드 모멘텀 브레이크업 적응 트렌드 전략
- MACD-ATR 구현으로 강화된 평균 역전 전략