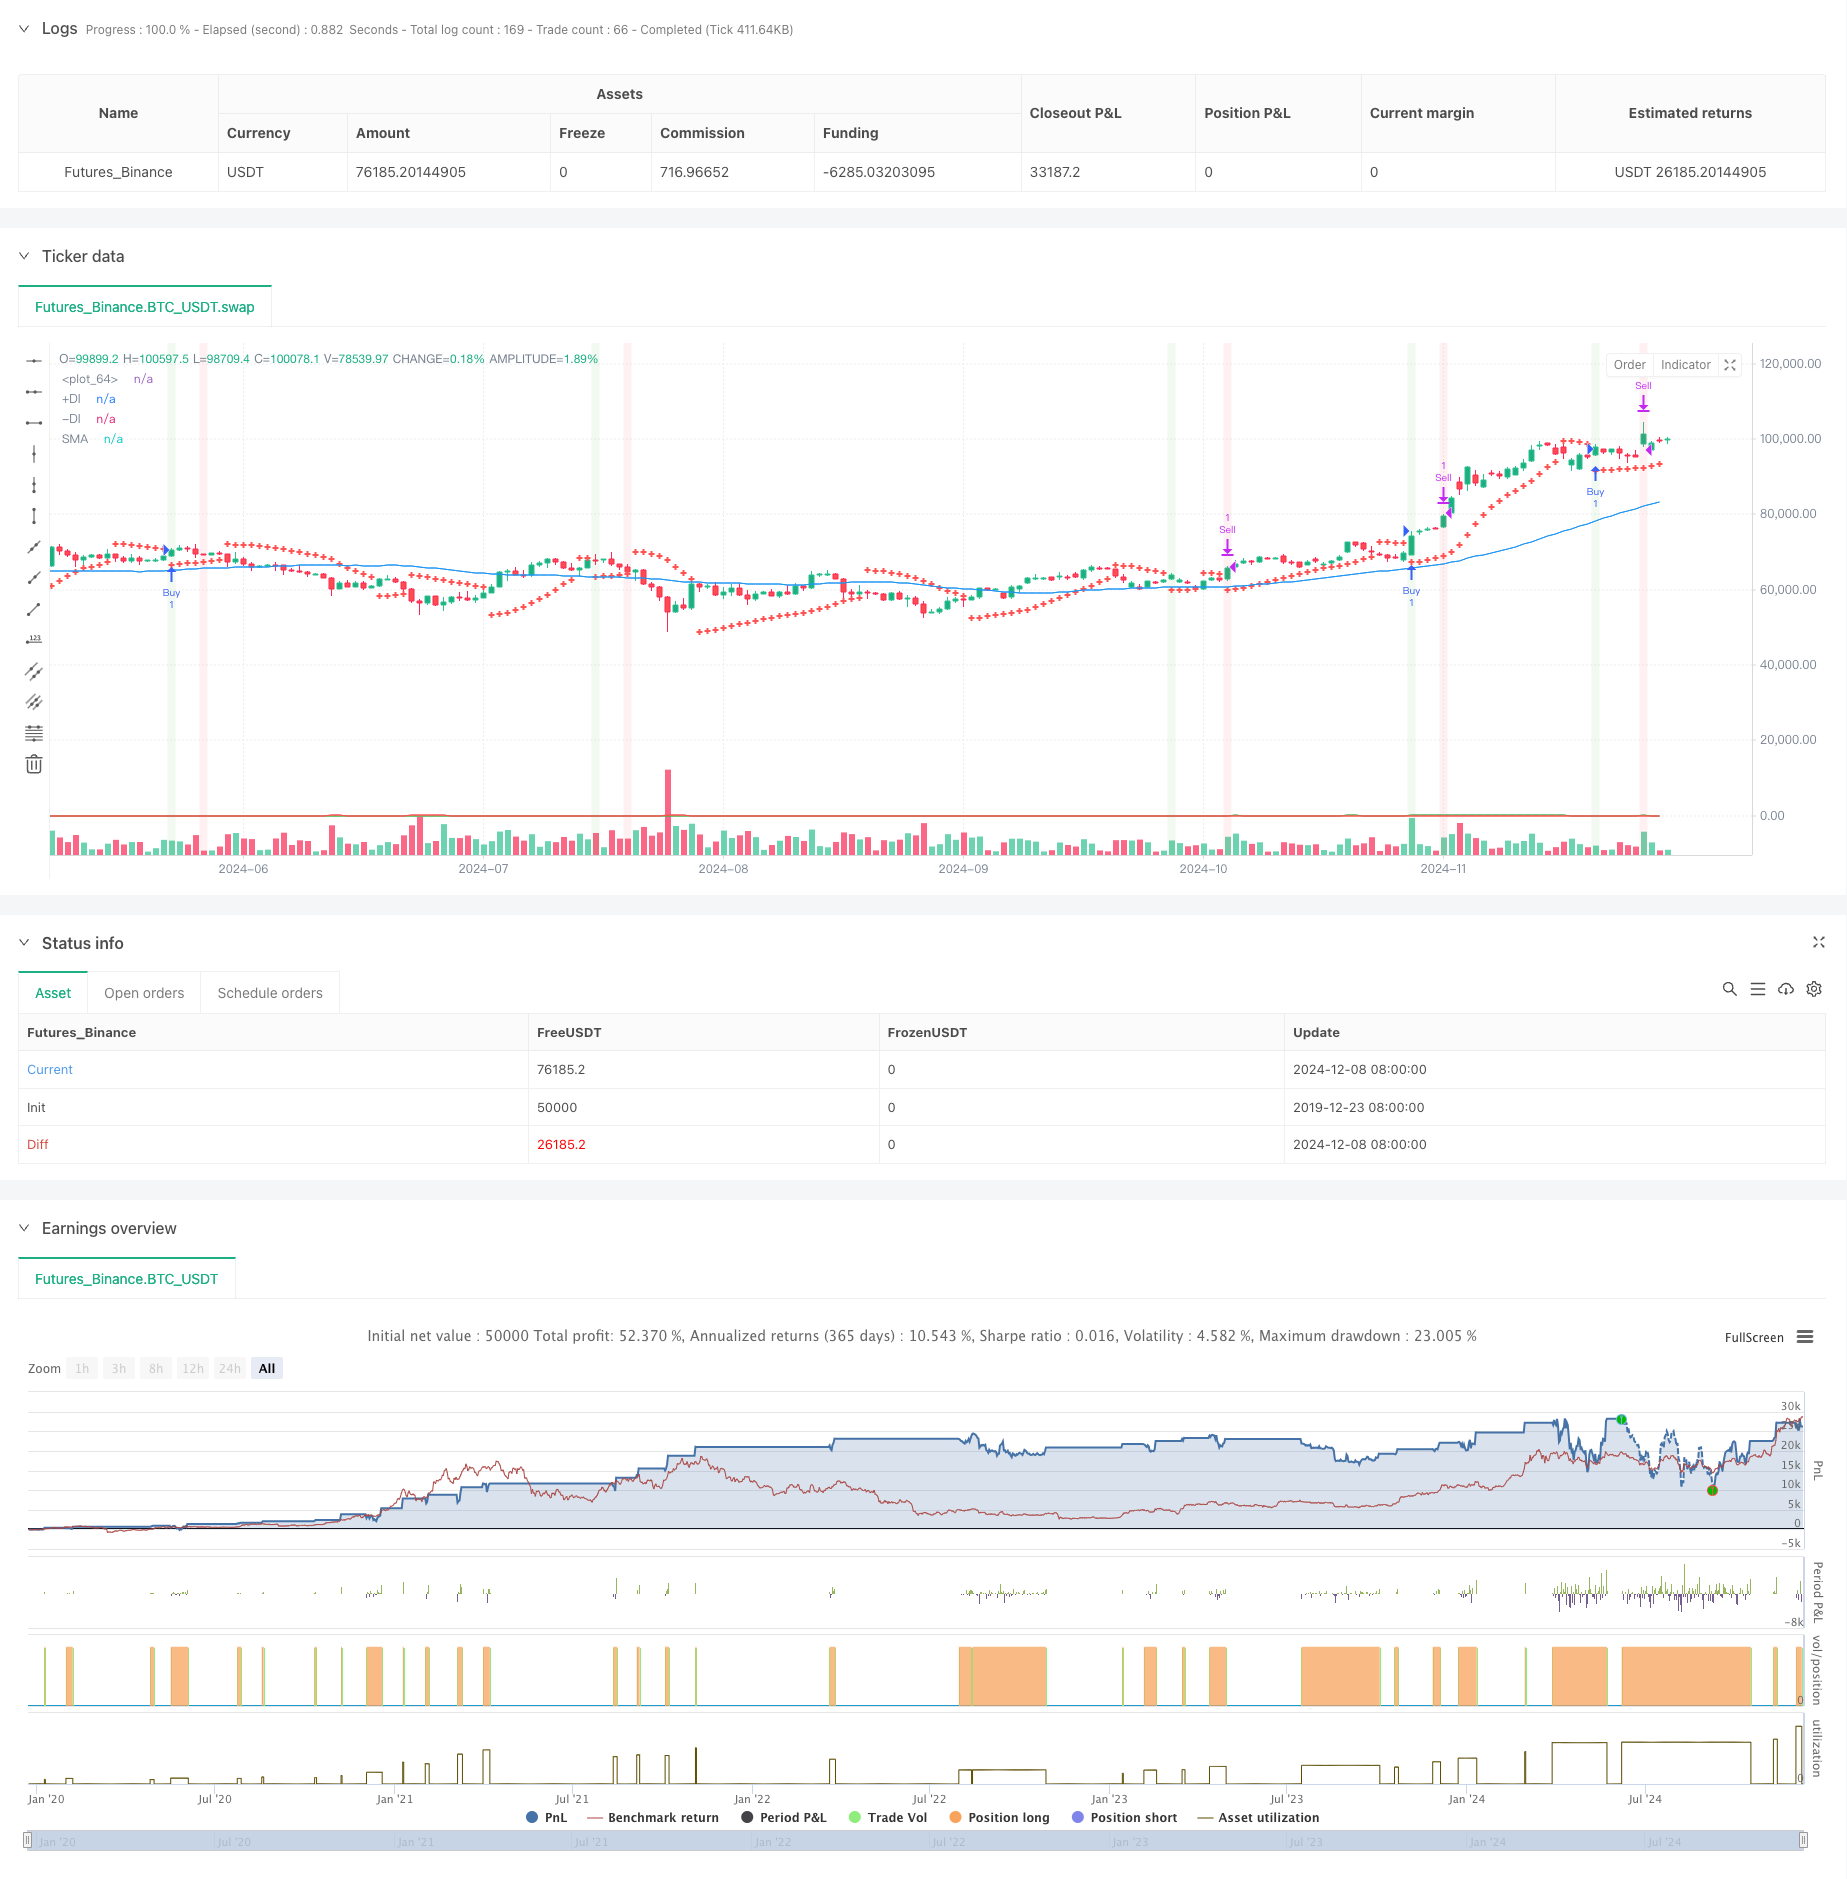
Gambaran keseluruhan
Strategi ini adalah sistem perdagangan trend-tracking yang menggabungkan beberapa petunjuk teknikal. Ia terutamanya menggunakan indikator peralihan garis paralisis (SAR), purata bergerak (SMA) dan indikator momentum arah (DMI) untuk menentukan trend pasaran dan masa masuk, dan mengoptimumkan keluar dengan peratusan stop dan MACD berbalik.
Prinsip Strategi
Strategi ini menggunakan mekanisme penapisan berlapis untuk mengesahkan isyarat dagangan:
- Menangkap isyarat perdagangan awal melalui penyambungan penunjuk SAR
- Menggunakan 50 kitaran SMA untuk menentukan arah trend keseluruhan
- Menggunakan penunjuk DMI untuk mengesahkan kekuatan dan arah trend
- Syarat kemasukan perlu dipenuhi pada masa yang sama: harga di atas SAR, harga di atas SMA dan DMI menunjukkan trend pelbagai arah
- Mekanisme dua hala: mencapai keuntungan sasaran 3% atau munculnya isyarat dead fork MACD
- Indeks ATR digunakan sebagai rujukan kepada turun naik pasaran
Kelebihan Strategik
- Penyelidikan silang pelbagai teknologi untuk mengurangkan isyarat palsu
- Meningkatkan kadar kejayaan dagangan dengan menggunakan trend tracking dan dinamika indikator
- Strategi penangguhan peratusan tetap untuk memastikan keuntungan yang stabil
- MACD berundur daripada mekanisme keluar untuk mengelakkan perpindahan
- Parameter strategi boleh disesuaikan secara fleksibel mengikut ciri-ciri pasaran yang berbeza
- Penggunaan ATR untuk memantau turun naik dan memberi rujukan kepada keadaan pasaran
Risiko Strategik
- Penunjuk berbilang boleh menyebabkan ketinggalan isyarat
- Penanda peratusan tetap mungkin keluar awal dalam trend yang kuat
- Tiada mekanisme penangguhan kerugian meningkatkan peluang risiko
- Mungkin terdapat terlalu banyak isyarat palsu di pasaran.
- Indeks DMI mungkin memberi isyarat yang mengelirukan dalam pasaran yang bergolak
Arah pengoptimuman strategi
- Memperkenalkan mekanisme penangguhan beradaptasi, seperti penangguhan dinamik berasaskan ATR
- Membangunkan penapis kadar turun naik untuk menyesuaikan skala pegangan semasa turun naik yang tinggi
- Mengoptimumkan parameter MACD untuk meningkatkan ketepatan penghakiman trend
- Tambah mekanisme pengesahan volum untuk meningkatkan kebolehpercayaan isyarat
- Membangunkan mekanisme penangguhan dinamik untuk menyesuaikan keuntungan sasaran mengikut turun naik pasaran
ringkaskan
Strategi ini membina sistem perdagangan trend yang agak lengkap melalui kerjasama kolaboratif pelbagai petunjuk teknikal. Kelebihannya terletak pada kebolehpercayaan pengesahan isyarat dan fleksibiliti dalam mengawal risiko. Walaupun terdapat risiko ketinggalan tertentu, prestasi keseluruhan strategi masih mempunyai nilai aplikasi yang baik melalui pengoptimuman parameter dan penyertaan mekanisme pengurusan dinamik. Dengan pengoptimuman dan penambahbaikan berterusan, strategi ini dapat menjadi alat perdagangan yang mantap.
/*backtest
start: 2019-12-23 08:00:00
end: 2024-12-09 08:00:00
period: 1d
basePeriod: 1d
exchanges: [{"eid":"Futures_Binance","currency":"BTC_USDT"}]
*/

//@version=5
strategy("Swing Trading Strategy with DMI", overlay=true)

// Define parameters
sarStart = input.float(0.02, title="SAR Start")
sarIncrement = input.float(0.02, title="SAR Increment")
sarMax = input.float(0.2, title="SAR Max")
atrLength = input.int(10, title="ATR Length")
macdShort = input.int(12, title="MACD Short Length")
macdLong = input.int(26, title="MACD Long Length")
macdSignal = input.int(9, title="MACD Signal Length")
smaLength = input.int(50, title="SMA Length")
dmiLength = input.int(14, title="DMI Length")
adxSmoothing = input.int(14, title="ADX Smoothing") // Smoothing period for ADX
targetProfitPercentage = input.float(3.0, title="Target Profit Percentage")

// Calculate SAR
sar = ta.sar(sarStart, sarIncrement, sarMax)

// Calculate ATR
atr = ta.atr(atrLength)

// Calculate MACD
[macdLine, macdSignalLine, _] = ta.macd(close, macdShort, macdLong, macdSignal)

// Calculate SMA
sma = ta.sma(close, smaLength)
bullishTrend = close > sma

// Calculate DMI
[plusDI, minusDI, adx] = ta.dmi(dmiLength, adxSmoothing) // Specify ADX smoothing period

// Determine if DMI is bullish
dmiBullish = plusDI > minusDI

// Define buy signal
buySignal = ta.crossover(close, sar) and bullishTrend and dmiBullish

// Track buy price and position state
var float buyPrice = na
var bool inPosition = false

// Enter position
if (buySignal and not inPosition)
    buyPrice := close
    inPosition := true
    strategy.entry("Buy", strategy.long)

// Define target price (3% above the buy price)
targetPrice = na(buyPrice) ? na : buyPrice * (1 + targetProfitPercentage / 100)

// Define MACD sell signal
macdSellSignal = ta.crossunder(macdLine, macdSignalLine)

// Define sell signal
sellSignal = inPosition and (close >= targetPrice or macdSellSignal)

// Exit position
if (sellSignal)
    inPosition := false
    strategy.exit("Sell", "Buy", limit=targetPrice)

// Plot SAR on the chart
plot(sar, color=color.red, style=plot.style_cross, linewidth=2)

// Plot SMA (optional, for visualizing the trend)
plot(sma, color=color.blue, title="SMA")

// Plot DMI +DI and -DI
plot(plusDI, color=color.green, title="+DI")
plot(minusDI, color=color.red, title="-DI")

// Plot buy signal on the chart
//plotshape(series=buySignal, location=location.belowbar, color=color.green, style=shape.labelup, text="BUY")

// Plot sell signal on the chart
//plotshape(series=sellSignal, location=location.abovebar, color=color.red, style=shape.labeldown, text="SELL")

// Optional: Plot background color for buy and sell signals
bgcolor(buySignal ? color.new(color.green, 90) : na, title="Buy Signal Background")
bgcolor(sellSignal ? color.new(color.red, 90) : na, title="Sell Signal Background")