Strategi Dagangan Waktu Pintar Osilator Momentum Berganda
Penulis:ChaoZhang, Tarikh: 2024-12-17 14:36:46Tag:RSISMAEMAMACD

Ringkasan
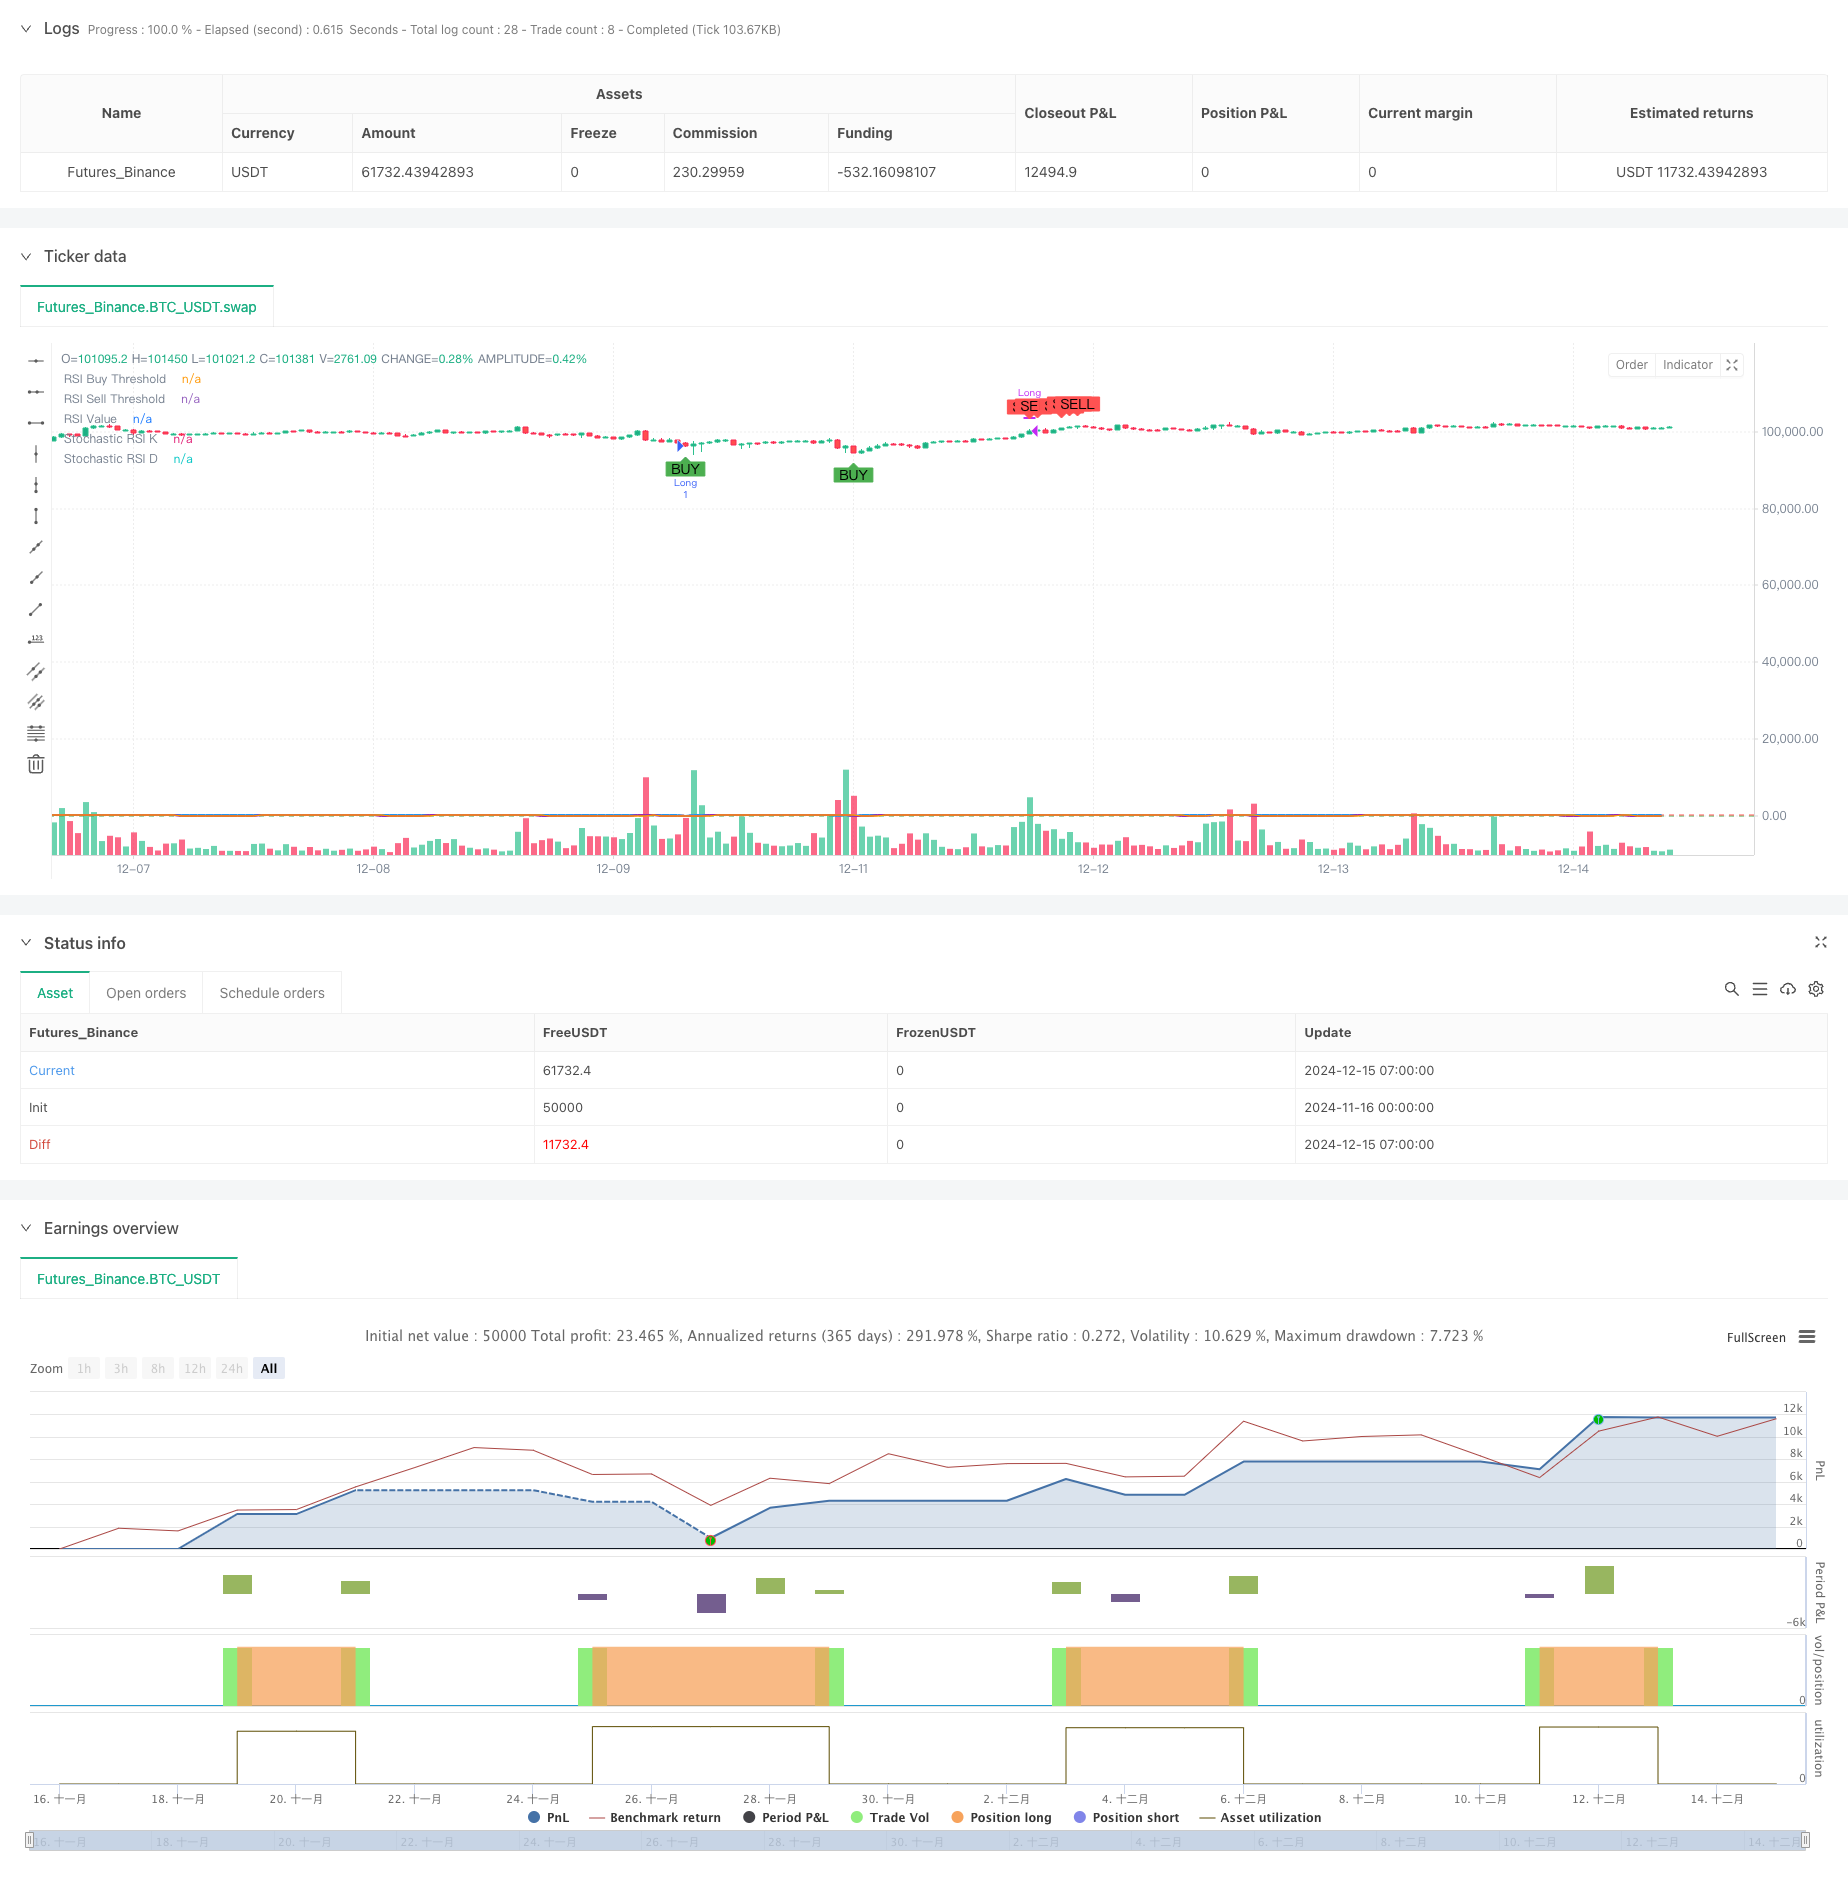
Strategi ini adalah sistem dagangan pintar berdasarkan penunjuk momentum berganda: RSI dan RSI Stochastic. Ia mengenal pasti keadaan pasar yang terlalu banyak dibeli dan terlalu banyak dijual dengan menggabungkan isyarat dari dua osilator momentum, menangkap peluang dagangan yang berpotensi. Sistem ini menyokong penyesuaian tempoh dan dapat menyesuaikan kitaran dagangan dengan fleksibel mengikut persekitaran pasaran yang berbeza.
Prinsip Strategi
Logik teras strategi ini adalah berdasarkan unsur-unsur utama berikut: 1. Menggunakan penunjuk RSI 14 tempoh untuk mengira momentum harga 2. Menggunakan 14 tempoh RSI Stochastic untuk pengesahan sekunder 3. Trigger membeli isyarat apabila RSI adalah di bawah 35 dan Stochastic RSI adalah di bawah 20 4. Pemicu menjual isyarat apabila RSI adalah di atas 70 dan Stochastic RSI adalah di atas 80 5. Menggunakan penghalusan SMA 3 tempoh kepada RSI Stochastic untuk kestabilan isyarat 6. Menyokong beralih antara jangka masa harian dan mingguan
Kelebihan Strategi
- Mekanisme pengesahan isyarat berganda mengurangkan gangguan isyarat palsu dengan ketara
- Parameter penunjuk boleh disesuaikan dengan fleksibel dengan turun naik pasaran
- Penghapusan SMA secara berkesan mengurangkan bunyi isyarat
- Menyokong perdagangan pelbagai tempoh untuk memenuhi keperluan pelabur yang berbeza
- Antara muka visual secara intuitif memaparkan isyarat beli / jual untuk analisis
- Struktur kod yang jelas, mudah dikekalkan dan dikembangkan lebih lanjut
Risiko Strategi
- Boleh menghasilkan isyarat perdagangan yang berlebihan di pasaran sampingan
- Potensi kelewatan isyarat semasa pembalikan trend yang cepat
- Tetapan parameter yang tidak betul boleh menyebabkan peluang perdagangan yang hilang
- Isyarat palsu mungkin berlaku semasa turun naik pasaran yang tinggi
- Memerlukan tetapan stop-loss yang betul untuk kawalan risiko
Arahan Pengoptimuman Strategi
- Memperkenalkan penunjuk penilaian trend seperti MACD atau EMA untuk meningkatkan kebolehpercayaan isyarat
- Tambah faktor kelantangan untuk meningkatkan kualiti isyarat
- Melaksanakan mekanisme stop-loss dinamik untuk mengoptimumkan pengurusan risiko
- Membangunkan sistem pengoptimuman parameter adaptif untuk kestabilan strategi
- Pertimbangkan untuk menggabungkan penunjuk turun naik pasaran untuk mengoptimumkan masa dagangan
Ringkasan
Strategi ini membina sistem dagangan yang boleh dipercayai dengan menggabungkan kelebihan RSI dan Stochastic RSI. Mekanisme pengesahan isyarat berganda secara berkesan mengurangkan isyarat palsu, sementara tetapan parameter fleksibel memberikan fleksibiliti yang kuat. Melalui pengoptimuman dan peningkatan yang berterusan, strategi menunjukkan janji dalam mengekalkan prestasi yang stabil di pelbagai keadaan pasaran.
/*backtest
start: 2024-11-16 00:00:00
end: 2024-12-15 08:00:00
period: 1h
basePeriod: 1h
exchanges: [{"eid":"Futures_Binance","currency":"BTC_USDT"}]
*/

//@version=5
strategy("BTC Buy & Sell Strategy (RSI & Stoch RSI)", overlay=true)

// Input Parameters
rsi_length = input.int(14, title="RSI Length")
stoch_length = input.int(14, title="Stochastic Length")
stoch_smooth_k = input.int(3, title="Stochastic %K Smoothing")
stoch_smooth_d = input.int(3, title="Stochastic %D Smoothing")

// Threshold Inputs
rsi_buy_threshold = input.float(35, title="RSI Buy Threshold")
stoch_buy_threshold = input.float(20, title="Stochastic RSI Buy Threshold")
rsi_sell_threshold = input.float(70, title="RSI Sell Threshold")
stoch_sell_threshold = input.float(80, title="Stochastic RSI Sell Threshold")

use_weekly_data = input.bool(false, title="Use Weekly Data", tooltip="Enable to use weekly timeframe for calculations.")

// Timeframe Configuration
timeframe = use_weekly_data ? "W" : timeframe.period

// Calculate RSI and Stochastic RSI
rsi_value = request.security(syminfo.tickerid, timeframe, ta.rsi(close, rsi_length))
stoch_rsi_k_raw = request.security(syminfo.tickerid, timeframe, ta.stoch(close, high, low, stoch_length))
stoch_rsi_k = ta.sma(stoch_rsi_k_raw, stoch_smooth_k)
stoch_rsi_d = ta.sma(stoch_rsi_k, stoch_smooth_d)

// Define Buy and Sell Conditions
buy_signal = (rsi_value < rsi_buy_threshold) and (stoch_rsi_k < stoch_buy_threshold)
sell_signal = (rsi_value > rsi_sell_threshold) and (stoch_rsi_k > stoch_sell_threshold)

// Strategy Execution
if buy_signal
    strategy.entry("Long", strategy.long, comment="Buy Signal")

if sell_signal
    strategy.close("Long", comment="Sell Signal")

// Plot Buy and Sell Signals
plotshape(buy_signal, style=shape.labelup, location=location.belowbar, color=color.green, title="Buy Signal", size=size.small, text="BUY")
plotshape(sell_signal, style=shape.labeldown, location=location.abovebar, color=color.red, title="Sell Signal", size=size.small, text="SELL")

// Plot RSI and Stochastic RSI for Visualization
hline(rsi_buy_threshold, "RSI Buy Threshold", color=color.green)
hline(rsi_sell_threshold, "RSI Sell Threshold", color=color.red)

plot(rsi_value, color=color.blue, linewidth=2, title="RSI Value")
plot(stoch_rsi_k, color=color.purple, linewidth=2, title="Stochastic RSI K")
plot(stoch_rsi_d, color=color.orange, linewidth=1, title="Stochastic RSI D")
- Strategi Perdagangan Kuantitatif Multi-Indikator - Strategi Super-Indikator 7-in-1
- Trend Multi-Indikator Berikutan dengan RSI Strategi Dagangan Kuantitatif Overbought/Oversold
- Trend Saluran Purata Bergerak Berganda Mengikuti Strategi
- Strategi Perdagangan Perintah Had Dinamik Multi-Indikator SMA-RSI-MACD
- EMA Multi-Timeframe Cross High-Win Rate Trend Mengikut Strategi (Langsung)
- Strategi Pertukaran Jangka Pendek Kuantitatif Berdasarkan Saluran G dan EMA
- Strategi Dagangan Kuantitatif Crossover Pergerakan Purata Ganda Dinamik
- Strategi Dagangan Komprehensif Multi-Indikator: Gabungan sempurna Momentum, Overbought/Oversold, dan Volatility
- Multi-Level Dynamic MACD Trend Following Strategy dengan Sistem Analisis Ekstensi Tinggi / Rendah 52-Minggu
- Sistem Perdagangan Analisis Teknikal Multi-Strategi
- Trend purata bergerak berganda mengikut strategi dengan pengurusan risiko
- Triple Supertrend dan Bollinger Bands Multi-Indikator Trend Mengikut Strategi
- Strategi Kuantitatif Multi-Trendline Breakout Momentum
- Sistem Pengurusan Modal Berasaskan Momentum RSI dan ADX Trend Strength
- Strategi Pivot Heatmap Kecairan Berbilang Jangka Masa
- Trend Multi-Timeframe Mengikut Strategi dengan mengambil keuntungan dan menghentikan kerugian berasaskan ATR
- Strategi trend lanjutan dengan penangguhan pengekalan adaptif
- Trend Indikator Multi-Teknik Mengikuti Strategi dengan Penapis Momentum RSI
- Strategi Crossover Purata Bergerak Eksponensial yang Diuruskan Risiko Dinamik
- Dual Exponential Moving Average dan Indeks Kekuatan Relatif Crossover Strategy
- Strategi Penangkapan Trend Kuantitatif Lanjutan dengan Penapis Julat Dinamik
- Dasar pelaksanaan isyarat TradingView (versi perkhidmatan HTTP terbina dalam)
- Strategi Analisis silang Lima Hari Lanjutan Berdasarkan Integrasi RSI dan MACD
- Sistem Dagangan Julat Adaptif Berdasarkan Indikator RSI Berganda
- Strategi Harga-Volume Supertrend Dual Dinamik
- Strategi Mengesan Volatiliti Black Swan dan Purata Bergerak
- Strategi Perdagangan Julat Volatiliti Pintar Menggabungkan Bollinger Bands dan SuperTrend
- Trend sinergi pelbagai penunjuk mengikut strategi dengan sistem stop-loss dinamik
- Bollinger Bands Momentum Breakout Trend Adaptive Mengikuti Strategi
- Strategi pembalikan purata yang ditingkatkan dengan pelaksanaan MACD-ATR