Стратегия трейдинга с двойным импульсом
Автор:Чао Чжан, Дата: 2024-12-17 14:36:46Тэги:РСИSMAЕМАMACD

Обзор
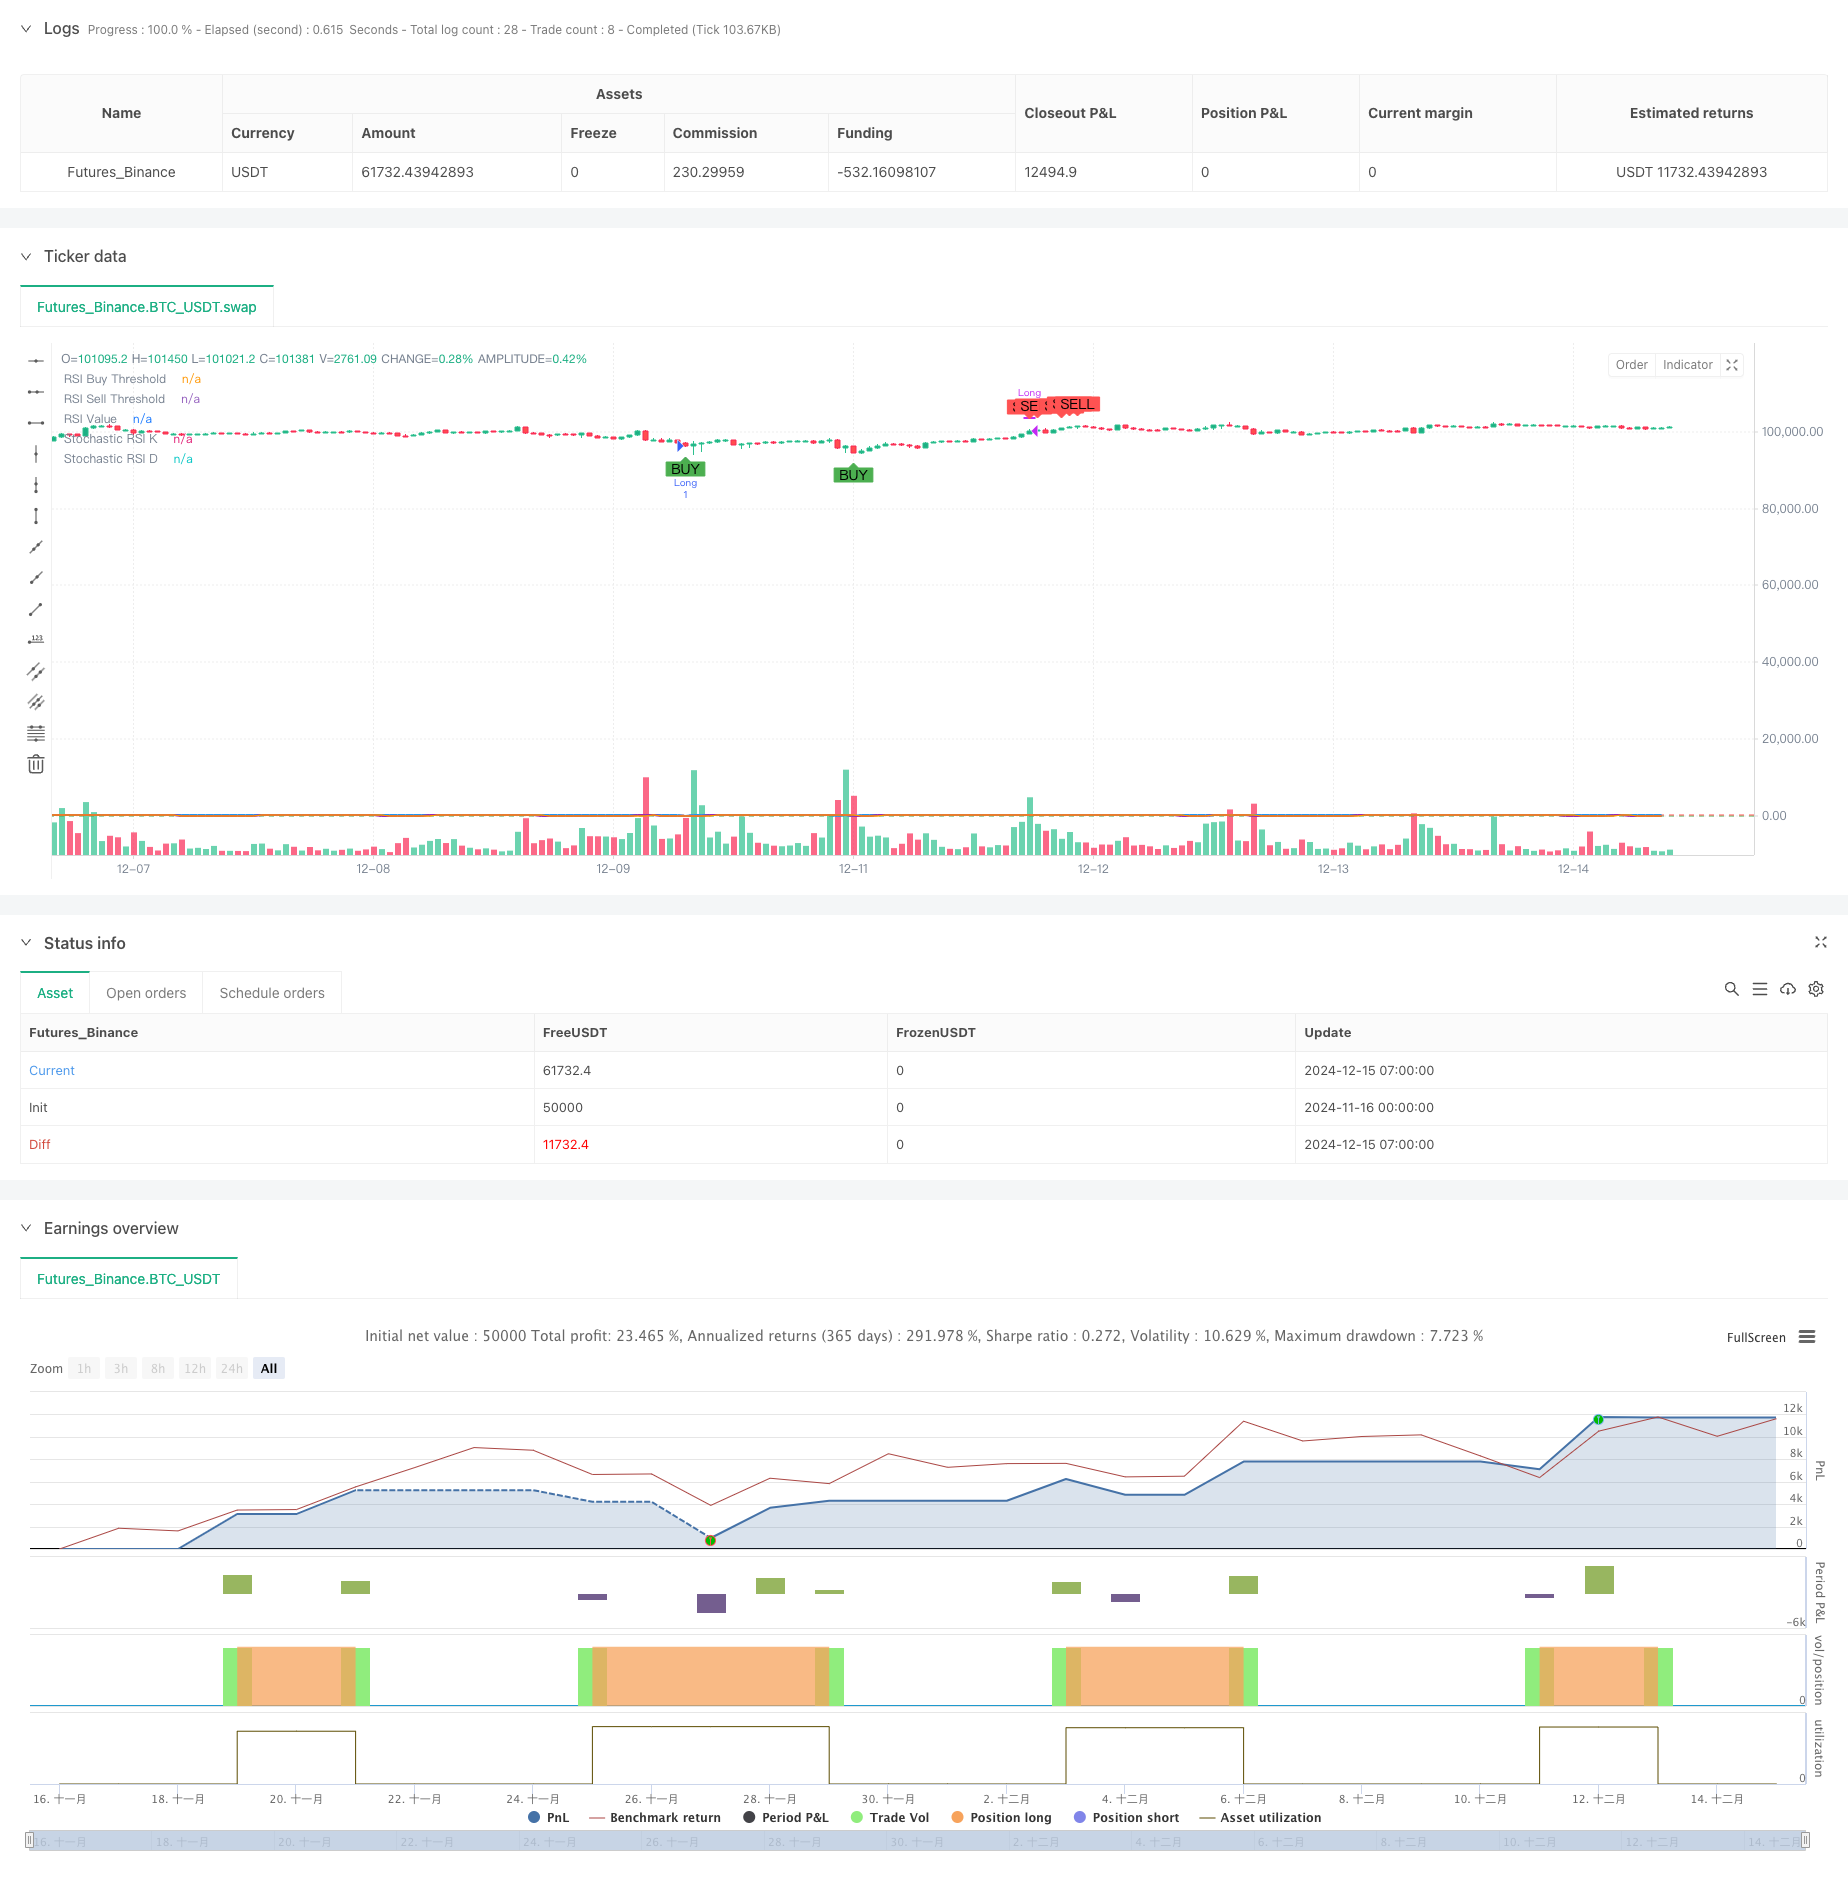
Эта стратегия представляет собой интеллектуальную торговую систему, основанную на двойных индикаторах импульса: RSI и Stochastic RSI. Она определяет условия перекупления и перепродажи на рынке путем объединения сигналов от двух импульсных осцилляторов, захватывая потенциальные торговые возможности. Система поддерживает адаптацию периода и может гибко корректировать торговые циклы в соответствии с различными рыночными условиями.
Принцип стратегии
Основная логика стратегии основана на следующих ключевых элементах: 1. Использует 14-периодный индикатор RSI для расчета динамики цен 2. Использует 14-периодный стохастический RSI для вторичного подтверждения Триггеры покупают сигнал, когда RSI ниже 35 и стохастический RSI ниже 20 4. Триггеры продают сигнал, когда RSI выше 70 и стохастический RSI выше 80 5. Применяет 3-периодическое сглаживание SMA на стохастический RSI для стабильности сигнала 6. Поддерживает переключение между ежедневными и еженедельными временными рамками
Преимущества стратегии
- Механизм подтверждения двойного сигнала значительно снижает помехи ложного сигнала
- Параметры показателей могут гибко корректироваться в зависимости от волатильности рынка
- Углаживание SMA эффективно уменьшает шум сигнала
- Поддерживает многопериодную торговлю для удовлетворения потребностей различных инвесторов
- Визуальный интерфейс интуитивно отображает сигналы покупки/продажи для анализа
- Ясная структура кода, легкая в обслуживании и дальнейшем развитии
Стратегические риски
- Может генерировать чрезмерные торговые сигналы на боковых рынках
- Потенциальное отставание сигнала при быстрых переломах тренда
- Неправильное настройка параметров может привести к упущенным торговым возможностям
- В период высокой волатильности рынка могут возникать ложные сигналы
- Требует правильных настроек стоп-лосса для контроля риска
Направления оптимизации стратегии
- Внедрение индикаторов оценки тренда, таких как MACD или EMA для повышения надежности сигнала
- Добавление факторов громкости для улучшения качества сигнала
- Внедрение динамических механизмов стоп-лосса для оптимизации управления рисками
- Разработка адаптивной системы оптимизации параметров для стабильности стратегии
- Подумайте о включении показателей волатильности рынка для оптимизации сроков торговли
Резюме
Стратегия создает надежную торговую систему, сочетая преимущества RSI и стохастического RSI. Механизм подтверждения двойного сигнала эффективно уменьшает ложные сигналы, в то время как гибкие параметры обеспечивают сильную адаптивность. Благодаря постоянной оптимизации и улучшению стратегия обещает поддерживать стабильную производительность в различных рыночных условиях.
/*backtest
start: 2024-11-16 00:00:00
end: 2024-12-15 08:00:00
period: 1h
basePeriod: 1h
exchanges: [{"eid":"Futures_Binance","currency":"BTC_USDT"}]
*/

//@version=5
strategy("BTC Buy & Sell Strategy (RSI & Stoch RSI)", overlay=true)

// Input Parameters
rsi_length = input.int(14, title="RSI Length")
stoch_length = input.int(14, title="Stochastic Length")
stoch_smooth_k = input.int(3, title="Stochastic %K Smoothing")
stoch_smooth_d = input.int(3, title="Stochastic %D Smoothing")

// Threshold Inputs
rsi_buy_threshold = input.float(35, title="RSI Buy Threshold")
stoch_buy_threshold = input.float(20, title="Stochastic RSI Buy Threshold")
rsi_sell_threshold = input.float(70, title="RSI Sell Threshold")
stoch_sell_threshold = input.float(80, title="Stochastic RSI Sell Threshold")

use_weekly_data = input.bool(false, title="Use Weekly Data", tooltip="Enable to use weekly timeframe for calculations.")

// Timeframe Configuration
timeframe = use_weekly_data ? "W" : timeframe.period

// Calculate RSI and Stochastic RSI
rsi_value = request.security(syminfo.tickerid, timeframe, ta.rsi(close, rsi_length))
stoch_rsi_k_raw = request.security(syminfo.tickerid, timeframe, ta.stoch(close, high, low, stoch_length))
stoch_rsi_k = ta.sma(stoch_rsi_k_raw, stoch_smooth_k)
stoch_rsi_d = ta.sma(stoch_rsi_k, stoch_smooth_d)

// Define Buy and Sell Conditions
buy_signal = (rsi_value < rsi_buy_threshold) and (stoch_rsi_k < stoch_buy_threshold)
sell_signal = (rsi_value > rsi_sell_threshold) and (stoch_rsi_k > stoch_sell_threshold)

// Strategy Execution
if buy_signal
    strategy.entry("Long", strategy.long, comment="Buy Signal")

if sell_signal
    strategy.close("Long", comment="Sell Signal")

// Plot Buy and Sell Signals
plotshape(buy_signal, style=shape.labelup, location=location.belowbar, color=color.green, title="Buy Signal", size=size.small, text="BUY")
plotshape(sell_signal, style=shape.labeldown, location=location.abovebar, color=color.red, title="Sell Signal", size=size.small, text="SELL")

// Plot RSI and Stochastic RSI for Visualization
hline(rsi_buy_threshold, "RSI Buy Threshold", color=color.green)
hline(rsi_sell_threshold, "RSI Sell Threshold", color=color.red)

plot(rsi_value, color=color.blue, linewidth=2, title="RSI Value")
plot(stoch_rsi_k, color=color.purple, linewidth=2, title="Stochastic RSI K")
plot(stoch_rsi_d, color=color.orange, linewidth=1, title="Stochastic RSI D")
- Многопоказательная количественная стратегия торговли - суперпоказательная стратегия 7 в 1
- Тенденция с несколькими показателями, следующая за стратегией перекупленной/перепроданной количественной торговли по РСИ
- Двойная движущаяся средняя тенденция каналов после стратегии
- Стратегия торговли многоиндикаторными динамическими лимитовыми ордерами SMA-RSI-MACD
- Тенденция высокой ставки прибыли в рамках EMA в течение нескольких периодов времени в соответствии со стратегией (продвинутая)
- Количественная долгосрочная стратегия переключения, основанная на G-канале и EMA
- Динамическая двойная скользящая средняя кроссоверная количественная стратегия торговли
- Многопоказательная комплексная стратегия торговли: идеальное сочетание импульса, перекупленности/перепродажи и волатильности
- Многоуровневый динамический тренд MACD после стратегии с 52-недельной системой анализа высокого/низкого расширения
- Многостратегическая система торговли техническим анализом
- Двойная скользящая средняя тенденция после стратегии с управлением рисками
- Трехкратный супертенд и полосы Боллинджера Многоиндикаторная тенденция после стратегии
- Количественная стратегия многолинейного тренда
- Система управления капиталом на основе динамики RSI и силы тренда ADX
- Стратегия тепловой карты с многоразовой ликвидностью
- Тенденция в течение нескольких временных рамок после стратегии с ATR-базированной прибылью и стоп-лосом
- Продвинутая стратегия следования тренду с адаптивной остановкой отслеживания
- Мультитехнический индикатор тренда после стратегии с фильтром импульса RSI
- Динамическая стратегия перекрестного использования экспоненциальной скользящей средней с управляемым риском
- Двойная экспоненциальная скользящая средняя и индекс относительной прочности
- Усовершенствованная стратегия хранения количественных тенденций с фильтром динамического диапазона
- Политика выполнения сигналов TradingView (встроенная версия HTTP-сервиса)
- Продвинутая пятидневная стратегия перекрестного анализа на основе интеграции RSI и MACD
- Система торговли адаптивным диапазоном на основе двойных индикаторов RSI
- Динамическая двойная супертенденционная стратегия объема и цены
- Стратегия отслеживания волатильности черного лебедя и скользящей средней кроссоверной импульса
- Интеллектуальная стратегия торговли в диапазоне волатильности, объединяющая полосы Боллинджера и SuperTrend
- Многопоказательная синергетическая тенденция в соответствии со стратегией с динамической системой стоп-лосса
- Болинджерские полосы импульс прорыв адаптивная тенденция после стратегии
- Улучшенная стратегия средней реверсии с применением MACD-ATR