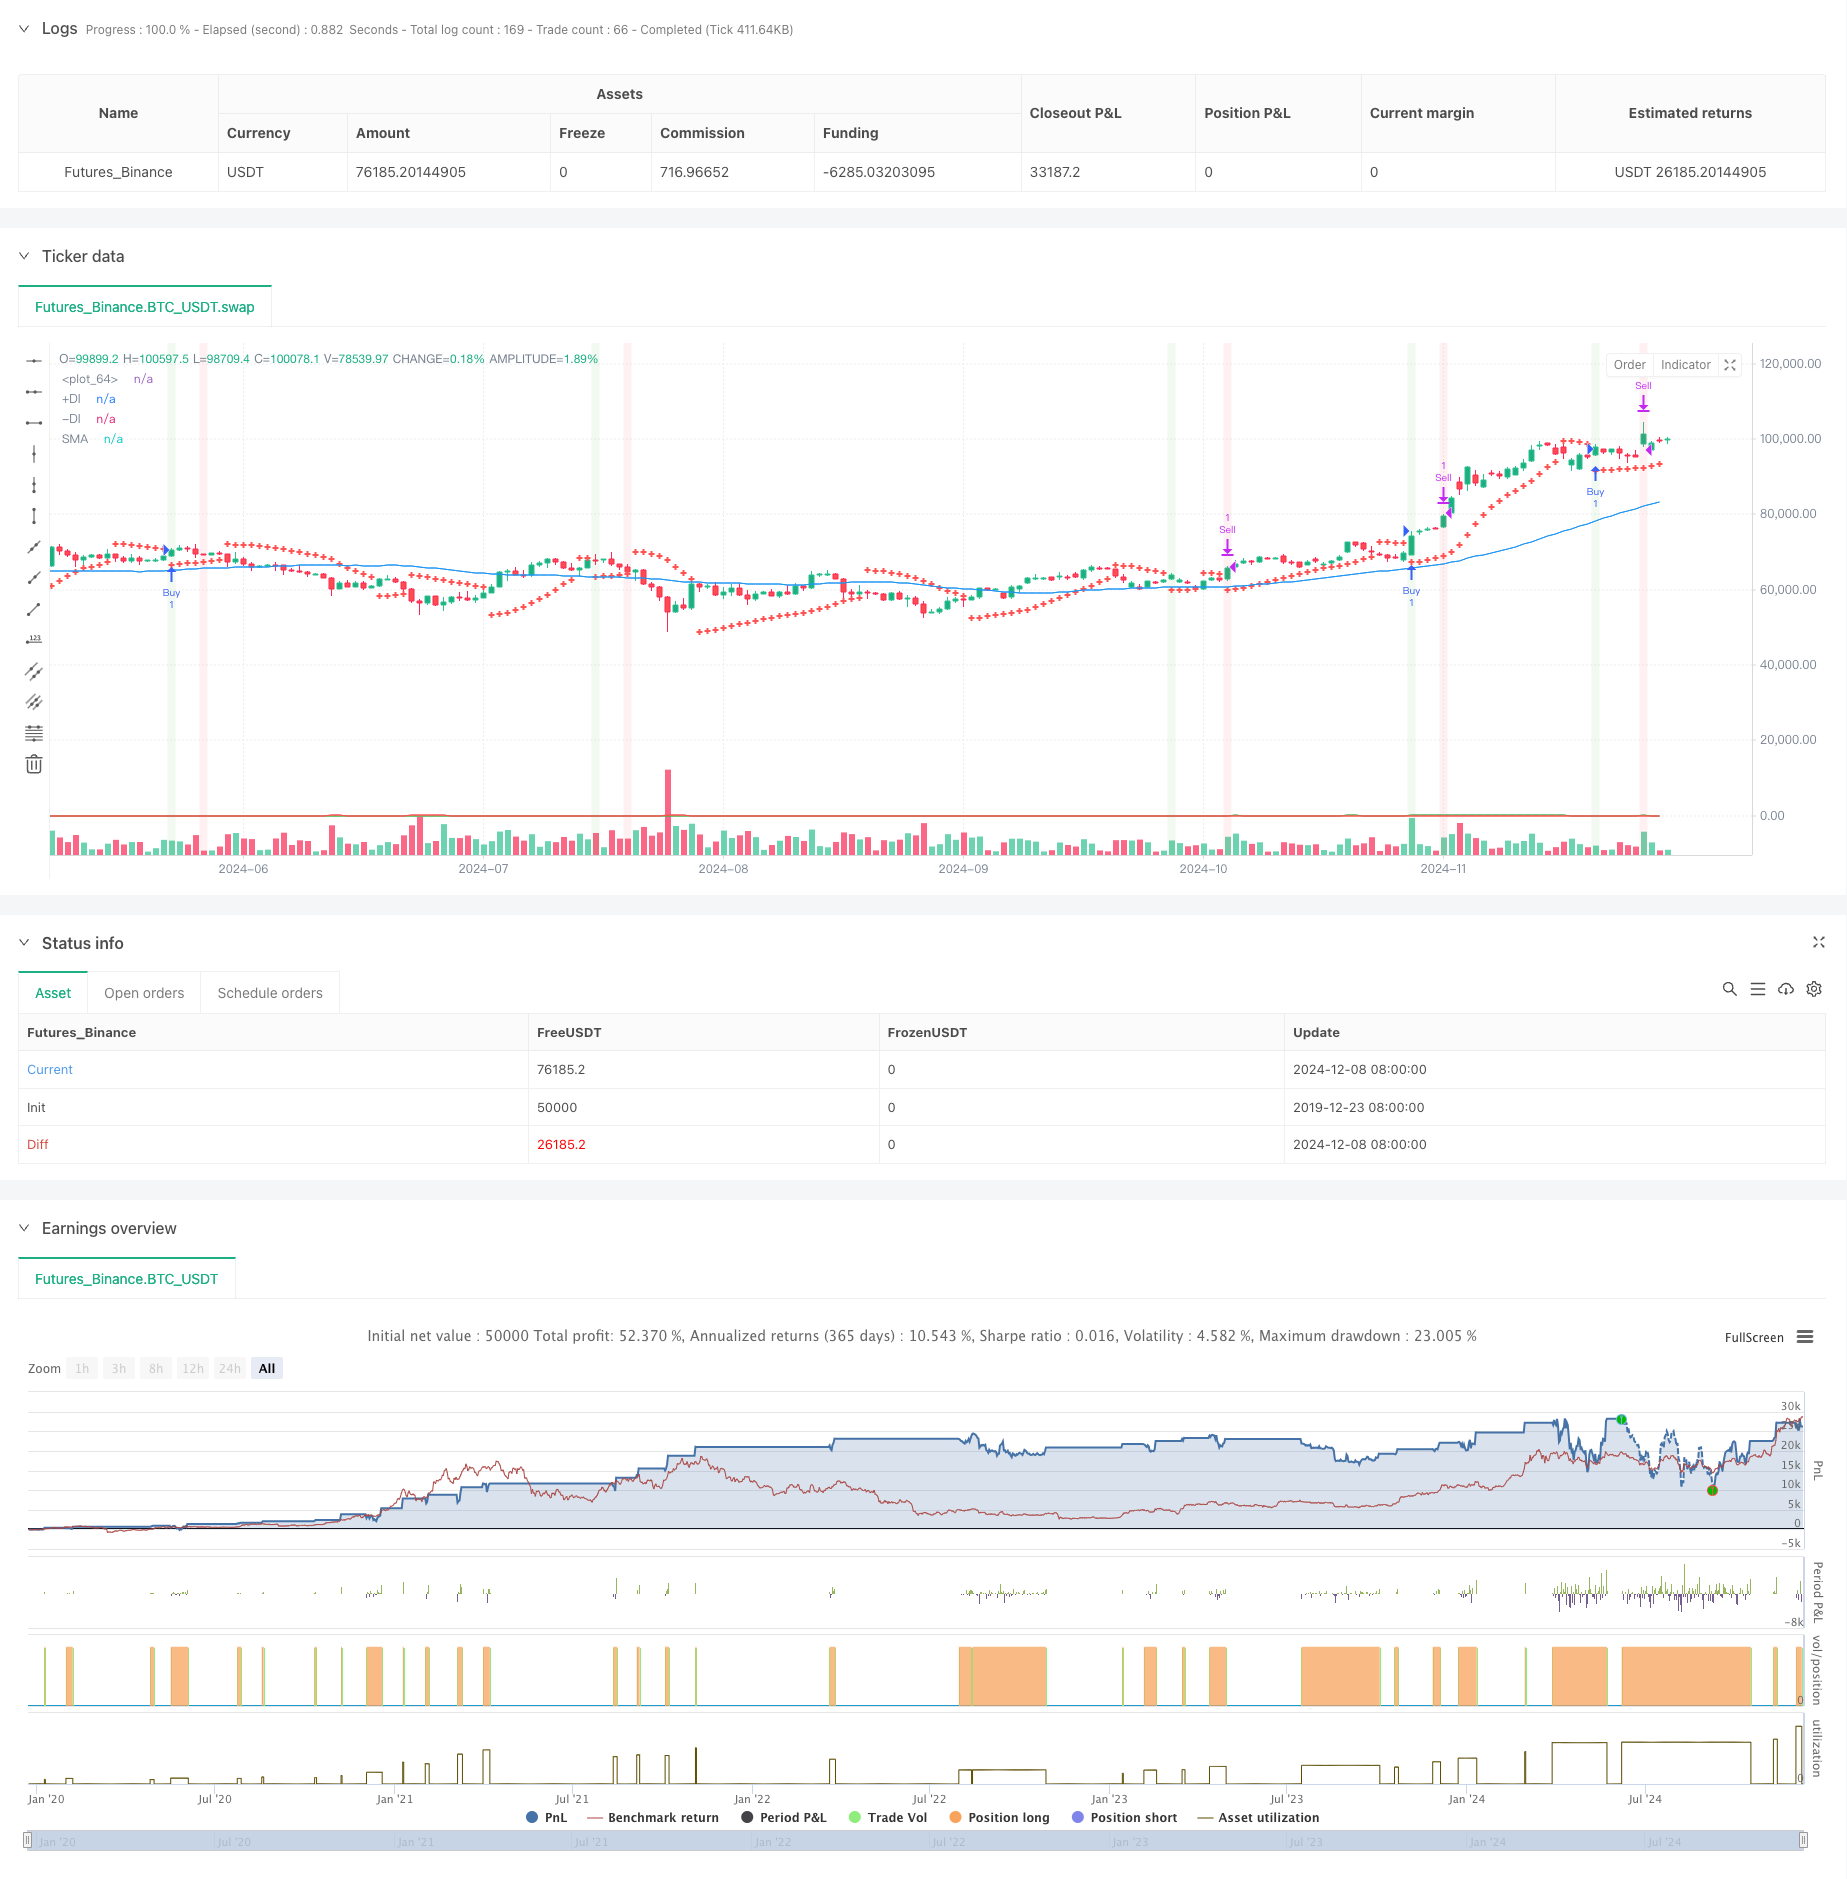
جائزہ
یہ حکمت عملی ایک رجحان سے باخبر رہنے والی تجارتی نظام ہے جس میں متعدد تکنیکی اشارے شامل ہیں۔ یہ بنیادی طور پر مارکیٹ کے رجحانات اور داخلے کے وقت کا تعین کرنے کے لئے پیرالول لائن ٹرانسمیشن اشارے ((SAR) ، منتقل اوسط ((SMA) اور سمت کی متحرک اشارے ((DMI) کا استعمال کرتا ہے ، اور فیصد اسٹاپ اور MACD پیچھے ہٹ کر باہر نکلنے کو بہتر بناتا ہے۔ حکمت عملی کے ڈیزائن کا بنیادی خیال یہ ہے کہ مضبوط رجحانات کے بعد داخل ہونا ، اور وقت پر باہر نکلنا جب منافع کے اہداف کو پورا کیا جائے یا رجحان کی تبدیلی کا اشارہ ہو۔
حکمت عملی کا اصول
اس حکمت عملی میں ٹریڈنگ سگنل کی تصدیق کے لیے فلٹرنگ کے متعدد طریقوں کا استعمال کیا گیا ہے۔
- ابتدائی ٹریڈنگ سگنل کو SAR اشارے کے کراسنگ کے ذریعے پکڑنا
- 50 سائیکل SMA کا استعمال کرتے ہوئے مجموعی رجحان کی سمت کا تعین کریں
- ڈی ایم آئی اشارے کا استعمال کرتے ہوئے رجحان کی طاقت اور سمت کی تصدیق کریں
- داخلے کی شرائط کو ایک ساتھ پورا کرنا ہوگا: قیمت SAR پہنتی ہے ، قیمت SMA سے اوپر ہے اور DMI ایک کثیر رخا رجحان دکھاتا ہے
- ڈبل میکانزم کا استعمال کرتے ہوئے باہر نکلیں: 3٪ ہدف منافع یا MACD ڈیڈ فورک سگنل کا ظہور
- مارکیٹ میں اتار چڑھاؤ کے حوالہ کے لئے اے ٹی آر اشارے
اسٹریٹجک فوائد
- جعلی سگنل کو کم کرنے کے لئے کثیر تکنیکی اشارے کی کراس تصدیق
- رجحانات کی پیروی اور متحرک اشارے کے ساتھ مل کر ، تجارت کی کامیابی کی شرح میں اضافہ
- فکسڈ فی صد اسٹاپ حکمت عملی ، مستحکم منافع کو یقینی بناتی ہے
- MACD نے رجحان کی تبدیلی سے بچنے کے لئے آؤٹ پٹ میکانزم سے پیچھے ہٹ لیا
- حکمت عملی پیرامیٹرز مختلف مارکیٹ کی خصوصیات کے مطابق لچکدار ایڈجسٹ کیا جا سکتا ہے
- اے ٹی آر کا استعمال اتار چڑھاؤ کی نگرانی کے لئے کیا جاتا ہے تاکہ مارکیٹ کی حالت کا حوالہ دیا جاسکے
اسٹریٹجک رسک
- ایک سے زیادہ اشارے سگنل وقفہ کا سبب بن سکتے ہیں۔
- فکسڈ فی صد اسٹاپ ممکنہ طور پر ایک مضبوط رجحان کے دوران پہلے سے باہر نکل سکتا ہے
- اسٹاپ نقصان کے بغیر خطرے کی گنجائش میں اضافہ
- کراس ڈسک مارکیٹ میں بہت زیادہ غلط سگنل پیدا ہو سکتے ہیں
- ڈی ایم آئی اشارے نے ہلچل کی منڈیوں میں گمراہ کن سگنل فراہم کیے
حکمت عملی کی اصلاح کی سمت
- اے ٹی آر پر مبنی متحرک اسٹاپ نقصانات جیسے موافقت پذیر اسٹاپ نقصانات کا تعارف
- اعلی اتار چڑھاؤ کے دوران ہولڈنگ کے سائز کو ایڈجسٹ کرنے کے لئے اتار چڑھاؤ کی شرح فلٹر تیار کریں
- MACD پیرامیٹرز کو بہتر بنانے اور رجحان کی تبدیلی کی درستگی کو بہتر بنانے کے لئے
- سگنل کی وشوسنییتا کو بہتر بنانے کے لیے حجم کی تصدیق کا طریقہ کار شامل کریں۔
- مارکیٹ میں اتار چڑھاو کے مطابق ہدف منافع کو ایڈجسٹ کرنے کے لئے متحرک اسٹاپ میکانیزم تیار کریں
خلاصہ کریں۔
اس حکمت عملی نے متعدد تکنیکی اشارے کے ہم آہنگی کے ساتھ کام کیا ، جس سے ایک نسبتا complete مکمل رجحان سے باخبر رہنے والا تجارتی نظام تشکیل دیا گیا۔ اس کا فائدہ سگنل کی تصدیق کی وشوسنییتا اور خطرے سے نمٹنے میں لچک ہے۔ اگرچہ کچھ پسماندہ خطرات موجود ہیں ، لیکن پیرامیٹرز کو بہتر بنانے اور متحرک انتظامیہ میں شامل ہونے سے حکمت عملی کی مجموعی کارکردگی بہتر ہے۔ مسلسل اصلاح اور بہتری کے ساتھ ، یہ حکمت عملی ایک مستحکم تجارتی آلہ بن سکتی ہے۔
/*backtest
start: 2019-12-23 08:00:00
end: 2024-12-09 08:00:00
period: 1d
basePeriod: 1d
exchanges: [{"eid":"Futures_Binance","currency":"BTC_USDT"}]
*/

//@version=5
strategy("Swing Trading Strategy with DMI", overlay=true)

// Define parameters
sarStart = input.float(0.02, title="SAR Start")
sarIncrement = input.float(0.02, title="SAR Increment")
sarMax = input.float(0.2, title="SAR Max")
atrLength = input.int(10, title="ATR Length")
macdShort = input.int(12, title="MACD Short Length")
macdLong = input.int(26, title="MACD Long Length")
macdSignal = input.int(9, title="MACD Signal Length")
smaLength = input.int(50, title="SMA Length")
dmiLength = input.int(14, title="DMI Length")
adxSmoothing = input.int(14, title="ADX Smoothing") // Smoothing period for ADX
targetProfitPercentage = input.float(3.0, title="Target Profit Percentage")

// Calculate SAR
sar = ta.sar(sarStart, sarIncrement, sarMax)

// Calculate ATR
atr = ta.atr(atrLength)

// Calculate MACD
[macdLine, macdSignalLine, _] = ta.macd(close, macdShort, macdLong, macdSignal)

// Calculate SMA
sma = ta.sma(close, smaLength)
bullishTrend = close > sma

// Calculate DMI
[plusDI, minusDI, adx] = ta.dmi(dmiLength, adxSmoothing) // Specify ADX smoothing period

// Determine if DMI is bullish
dmiBullish = plusDI > minusDI

// Define buy signal
buySignal = ta.crossover(close, sar) and bullishTrend and dmiBullish

// Track buy price and position state
var float buyPrice = na
var bool inPosition = false

// Enter position
if (buySignal and not inPosition)
    buyPrice := close
    inPosition := true
    strategy.entry("Buy", strategy.long)

// Define target price (3% above the buy price)
targetPrice = na(buyPrice) ? na : buyPrice * (1 + targetProfitPercentage / 100)

// Define MACD sell signal
macdSellSignal = ta.crossunder(macdLine, macdSignalLine)

// Define sell signal
sellSignal = inPosition and (close >= targetPrice or macdSellSignal)

// Exit position
if (sellSignal)
    inPosition := false
    strategy.exit("Sell", "Buy", limit=targetPrice)

// Plot SAR on the chart
plot(sar, color=color.red, style=plot.style_cross, linewidth=2)

// Plot SMA (optional, for visualizing the trend)
plot(sma, color=color.blue, title="SMA")

// Plot DMI +DI and -DI
plot(plusDI, color=color.green, title="+DI")
plot(minusDI, color=color.red, title="-DI")

// Plot buy signal on the chart
//plotshape(series=buySignal, location=location.belowbar, color=color.green, style=shape.labelup, text="BUY")

// Plot sell signal on the chart
//plotshape(series=sellSignal, location=location.abovebar, color=color.red, style=shape.labeldown, text="SELL")

// Optional: Plot background color for buy and sell signals
bgcolor(buySignal ? color.new(color.green, 90) : na, title="Buy Signal Background")
bgcolor(sellSignal ? color.new(color.red, 90) : na, title="Sell Signal Background")