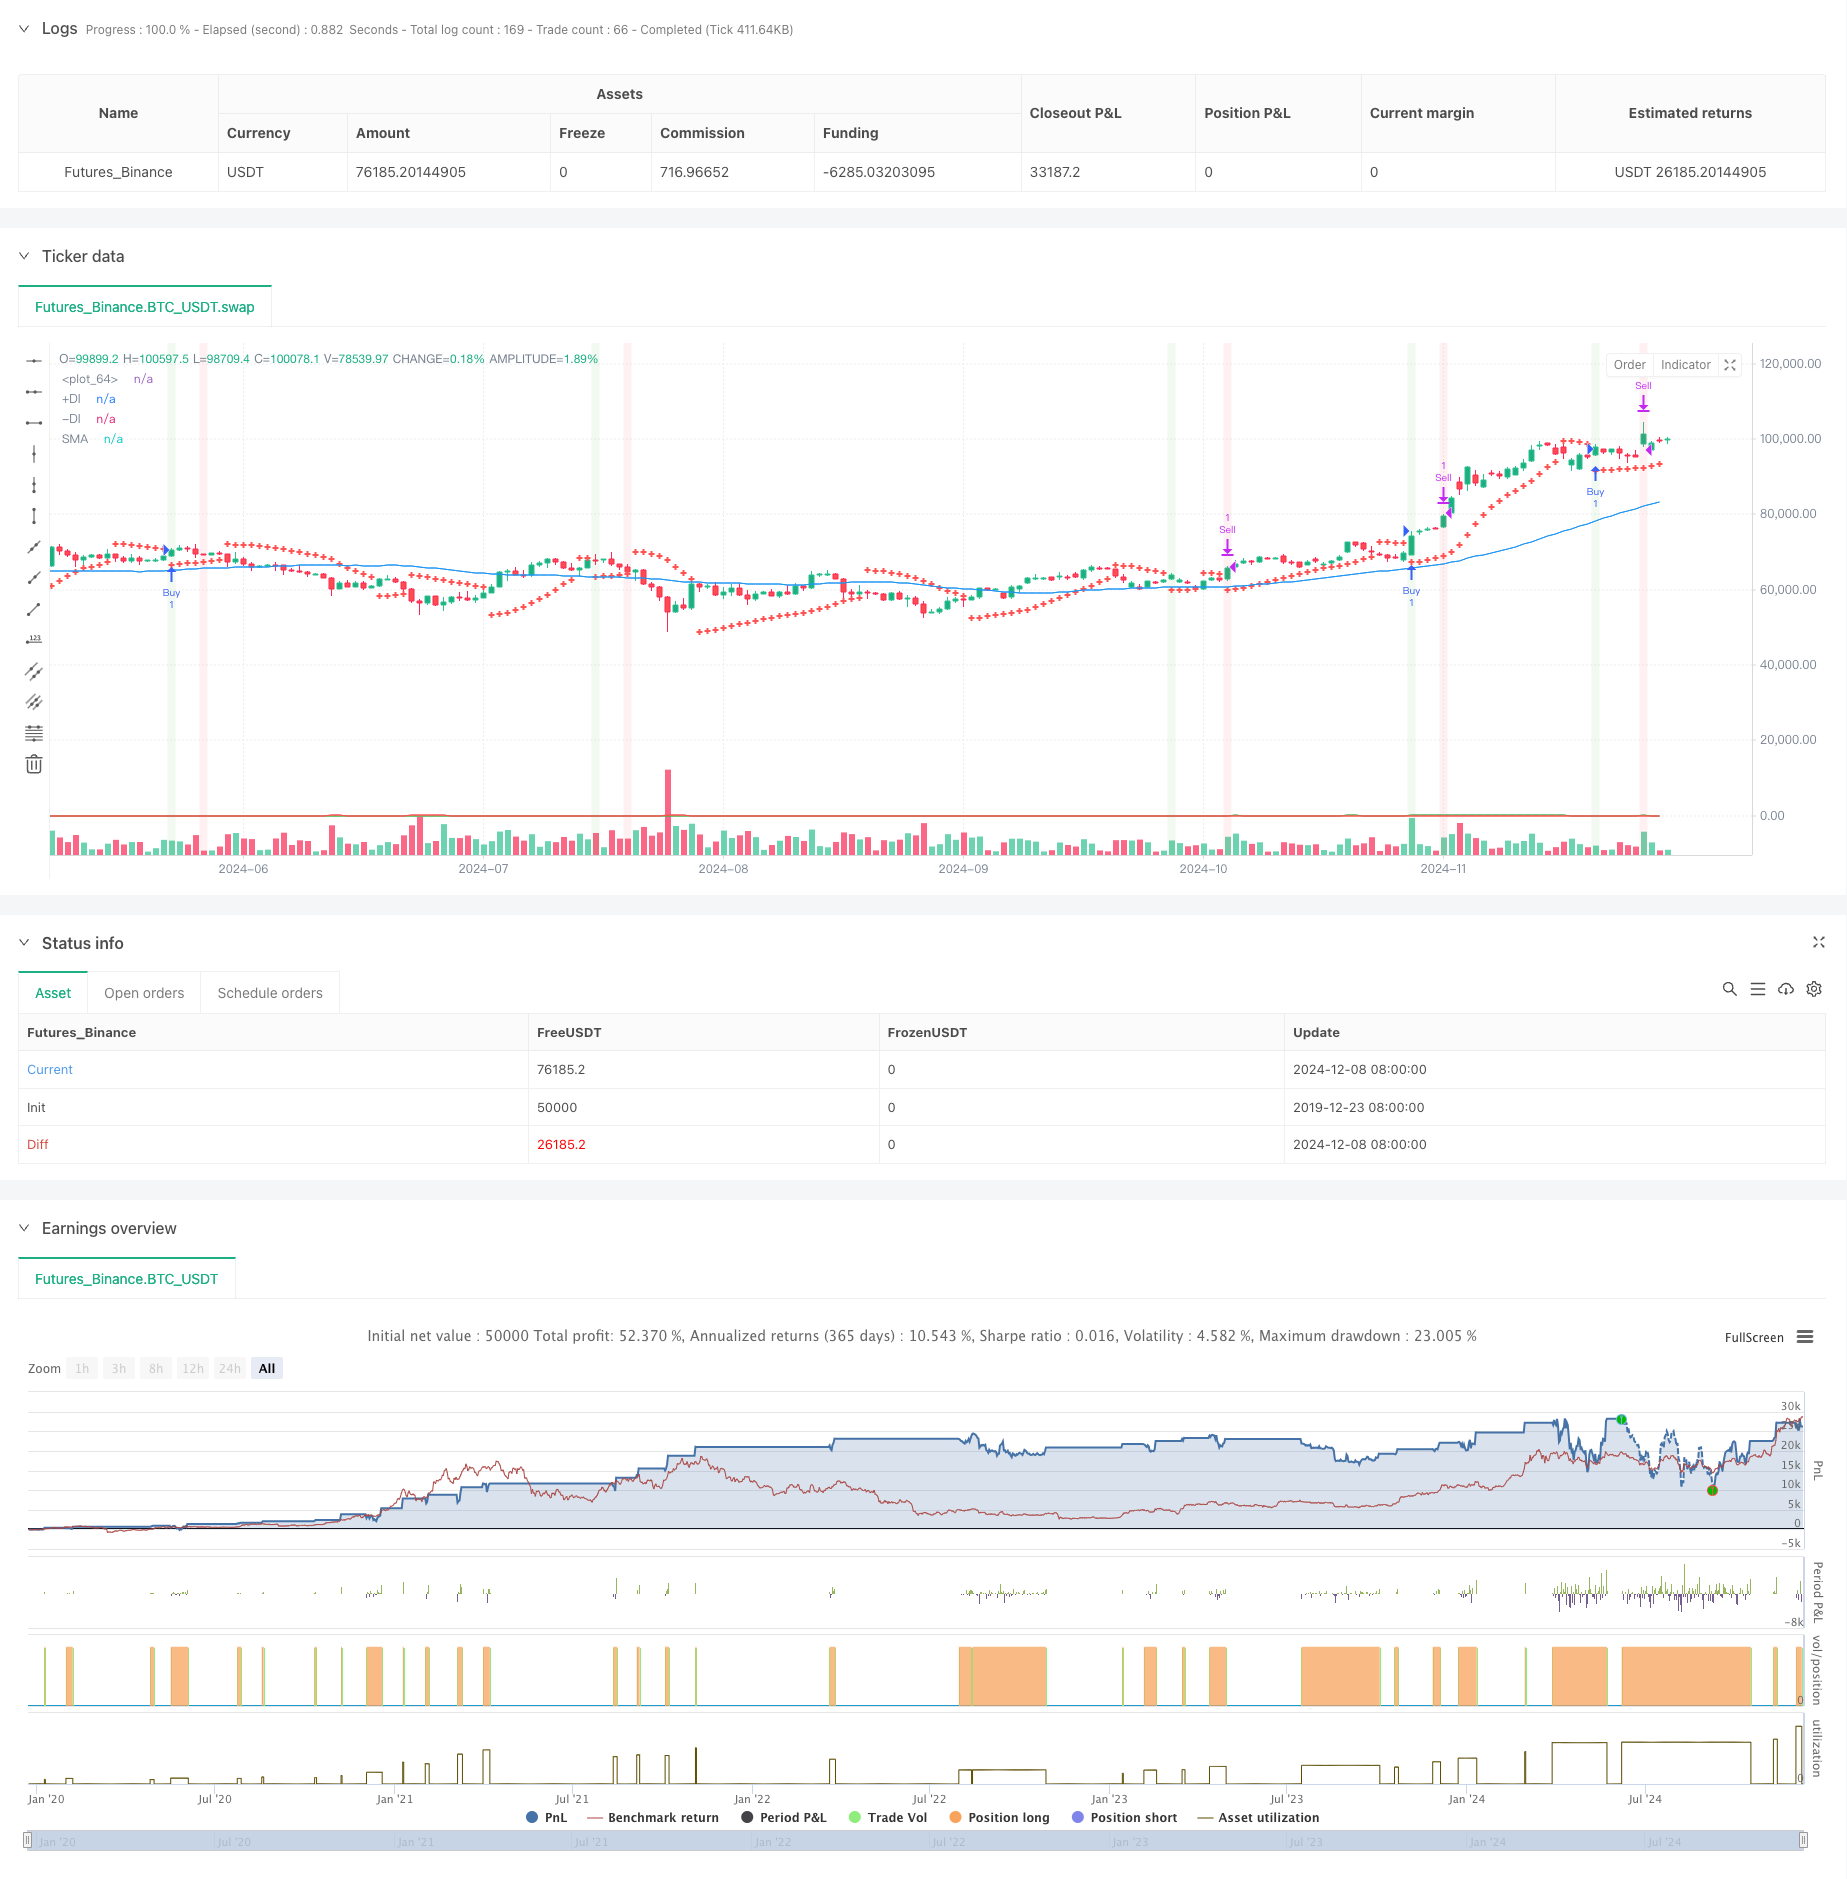
Tổng quan
Chiến lược này là một hệ thống giao dịch theo dõi xu hướng kết hợp nhiều chỉ số kỹ thuật. Nó chủ yếu sử dụng chỉ số chuyển hướng đường phân cực (SAR), trung bình di chuyển (SMA) và chỉ số động lực định hướng (DMI) để xác định xu hướng thị trường và thời gian tham gia, và tối ưu hóa lối ra bằng cách dừng phần trăm và MACD. Ý tưởng cốt lõi của thiết kế chiến lược là xác nhận vào thị trường sau xu hướng mạnh, và thoát khỏi thị trường đúng lúc khi đạt được mục tiêu lợi nhuận dự kiến hoặc có tín hiệu chuyển hướng.
Nguyên tắc chiến lược
Chiến lược này sử dụng nhiều lớp lọc để xác nhận tín hiệu giao dịch:
- Giao dịch thông qua giao dịch SAR để bắt tín hiệu giao dịch ban đầu
- Sử dụng SMA 50 chu kỳ để xác định hướng xu hướng tổng thể
- Sử dụng chỉ số DMI để xác định cường độ và hướng của xu hướng
- Các điều kiện nhập cảnh phải được đáp ứng đồng thời: giá trên SAR, giá trên SMA và DMI cho thấy xu hướng đa đầu
- Hành động sử dụng cơ chế kép: đạt mục tiêu lợi nhuận 3% hoặc tín hiệu chết của MACD xuất hiện
- Chỉ số ATR được sử dụng để tham khảo biến động thị trường
Lợi thế chiến lược
- Xác thực chéo đa chỉ số kỹ thuật có thể giảm hiệu quả tín hiệu giả
- Kết hợp theo dõi xu hướng và chỉ số động lực để tăng tỷ lệ giao dịch thành công
- Chiến lược dừng phần trăm cố định để đảm bảo lợi nhuận ổn định
- MACD tránh khỏi sự đảo ngược của xu hướng
- Các tham số chiến lược có thể được điều chỉnh linh hoạt theo các đặc điểm thị trường khác nhau
- Sử dụng ATR để giám sát biến động và cung cấp thông tin về tình trạng thị trường
Rủi ro chiến lược
- Nhiều chỉ báo có thể gây ra độ trễ tín hiệu
- Căn chặn tỷ lệ phần trăm cố định có thể ra đi sớm trong xu hướng mạnh
- Không có cơ chế dừng lỗ làm tăng lỗ hổng rủi ro
- Có thể có quá nhiều tín hiệu sai trong thị trường giao dịch ngang
- Chỉ số DMI có thể tạo ra tín hiệu sai lệch trong thị trường chấn động
Hướng tối ưu hóa chiến lược
- Tiến hành các cơ chế dừng tự điều chỉnh như dừng động dựa trên ATR
- Phát triển bộ lọc tỷ lệ biến động để điều chỉnh quy mô nắm giữ trong thời gian biến động cao
- Tối ưu hóa các tham số MACD để cải thiện tính chính xác trong việc xác định xu hướng
- Thêm cơ chế xác nhận âm lượng để cải thiện độ tin cậy của tín hiệu
- Phát triển cơ chế dừng động, điều chỉnh lợi nhuận mục tiêu theo biến động của thị trường
Tóm tắt
Chiến lược này xây dựng một hệ thống giao dịch theo dõi xu hướng tương đối hoàn chỉnh thông qua sự phối hợp hợp của nhiều chỉ số kỹ thuật. Ưu điểm của nó là độ tin cậy của tín hiệu xác nhận và tính linh hoạt của kiểm soát rủi ro. Mặc dù có một số rủi ro bị tụt hậu, nhưng thông qua tối ưu hóa tham số và tham gia cơ chế quản lý động, hiệu suất tổng thể của chiến lược vẫn có giá trị ứng dụng tốt hơn.
/*backtest
start: 2019-12-23 08:00:00
end: 2024-12-09 08:00:00
period: 1d
basePeriod: 1d
exchanges: [{"eid":"Futures_Binance","currency":"BTC_USDT"}]
*/

//@version=5
strategy("Swing Trading Strategy with DMI", overlay=true)

// Define parameters
sarStart = input.float(0.02, title="SAR Start")
sarIncrement = input.float(0.02, title="SAR Increment")
sarMax = input.float(0.2, title="SAR Max")
atrLength = input.int(10, title="ATR Length")
macdShort = input.int(12, title="MACD Short Length")
macdLong = input.int(26, title="MACD Long Length")
macdSignal = input.int(9, title="MACD Signal Length")
smaLength = input.int(50, title="SMA Length")
dmiLength = input.int(14, title="DMI Length")
adxSmoothing = input.int(14, title="ADX Smoothing") // Smoothing period for ADX
targetProfitPercentage = input.float(3.0, title="Target Profit Percentage")

// Calculate SAR
sar = ta.sar(sarStart, sarIncrement, sarMax)

// Calculate ATR
atr = ta.atr(atrLength)

// Calculate MACD
[macdLine, macdSignalLine, _] = ta.macd(close, macdShort, macdLong, macdSignal)

// Calculate SMA
sma = ta.sma(close, smaLength)
bullishTrend = close > sma

// Calculate DMI
[plusDI, minusDI, adx] = ta.dmi(dmiLength, adxSmoothing) // Specify ADX smoothing period

// Determine if DMI is bullish
dmiBullish = plusDI > minusDI

// Define buy signal
buySignal = ta.crossover(close, sar) and bullishTrend and dmiBullish

// Track buy price and position state
var float buyPrice = na
var bool inPosition = false

// Enter position
if (buySignal and not inPosition)
    buyPrice := close
    inPosition := true
    strategy.entry("Buy", strategy.long)

// Define target price (3% above the buy price)
targetPrice = na(buyPrice) ? na : buyPrice * (1 + targetProfitPercentage / 100)

// Define MACD sell signal
macdSellSignal = ta.crossunder(macdLine, macdSignalLine)

// Define sell signal
sellSignal = inPosition and (close >= targetPrice or macdSellSignal)

// Exit position
if (sellSignal)
    inPosition := false
    strategy.exit("Sell", "Buy", limit=targetPrice)

// Plot SAR on the chart
plot(sar, color=color.red, style=plot.style_cross, linewidth=2)

// Plot SMA (optional, for visualizing the trend)
plot(sma, color=color.blue, title="SMA")

// Plot DMI +DI and -DI
plot(plusDI, color=color.green, title="+DI")
plot(minusDI, color=color.red, title="-DI")

// Plot buy signal on the chart
//plotshape(series=buySignal, location=location.belowbar, color=color.green, style=shape.labelup, text="BUY")

// Plot sell signal on the chart
//plotshape(series=sellSignal, location=location.abovebar, color=color.red, style=shape.labeldown, text="SELL")

// Optional: Plot background color for buy and sell signals
bgcolor(buySignal ? color.new(color.green, 90) : na, title="Buy Signal Background")
bgcolor(sellSignal ? color.new(color.red, 90) : na, title="Sell Signal Background")