RSI নিম্ন পয়েন্ট বিপরীত কৌশল
লেখক:চাওঝাং, তারিখঃ ২০২৪-০৬-১৭ ১৫ঃ৩২ঃ১৮ট্যাগঃআরএসআইSLটিপি

সারসংক্ষেপ
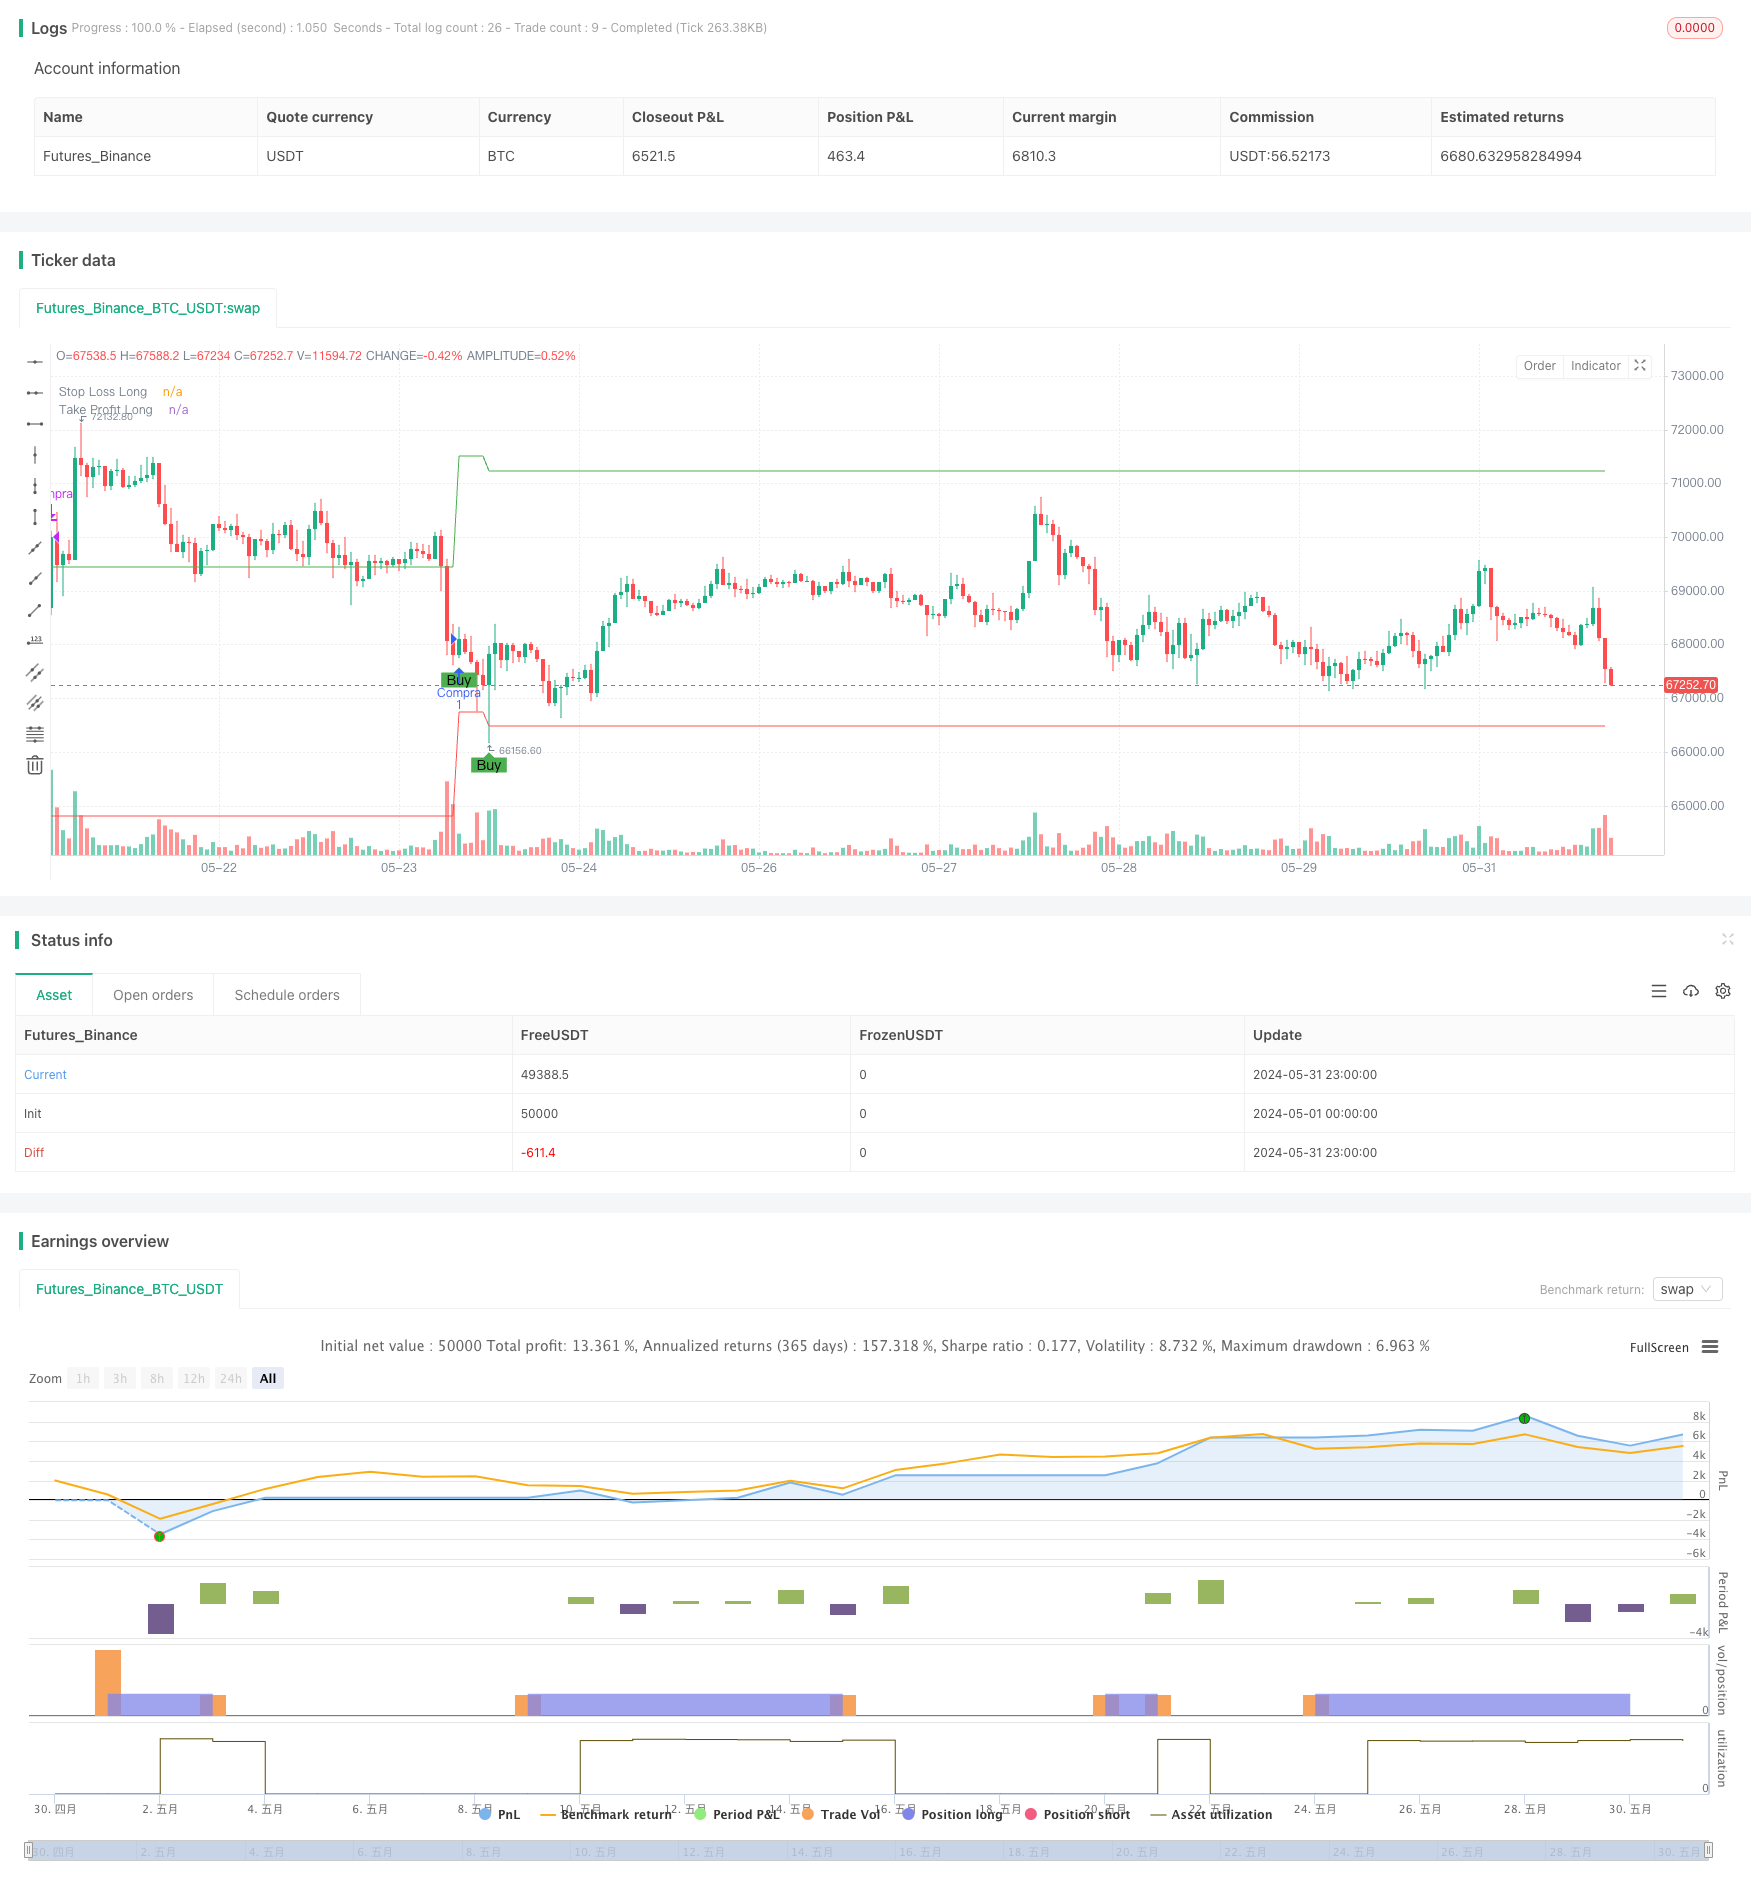
এই কৌশলটি বাজারের ওভারসোল্ড শর্ত নির্ধারণের জন্য আপেক্ষিক শক্তি সূচক (আরএসআই) ব্যবহার করে। যখন আরএসআই একটি সেট ওভারসোল্ড প্রান্তিকের নীচে পড়ে, এটি একটি ক্রয় সংকেত তৈরি করে। একই সাথে, এটি ঝুঁকি নিয়ন্ত্রণ এবং মুনাফা লক করার জন্য একটি স্টপ লস এবং লাভ গ্রহণ করে। কৌশলটি কেবল দীর্ঘ অবস্থান নেয় এবং শর্ট করে না।
কৌশল নীতি
- বাজারের অত্যধিক ক্রয় এবং অত্যধিক বিক্রয়ের অবস্থা পরিমাপ করার জন্য RSI সূচক গণনা করুন।
- যখন RSI সেট ওভারসোল্ড থ্রেশহোল্ডের নিচে পড়ে (ডিফল্ট হল 30), একটি ক্রয় সংকেত তৈরি করুন।
- ক্রয়ের পর, বর্তমান বন্ধের মূল্য এবং সেট স্টপ লস এবং লাভের শতাংশের ভিত্তিতে স্টপ লস এবং লাভের দাম গণনা করুন।
- হোল্ডিং সময়কালে, যদি মূল্য স্টপ লস মূল্যে পৌঁছায়, তাহলে পজিশনটি ক্ষতির সাথে বন্ধ করুন; যদি মূল্য লাভের মূল্যে পৌঁছায়, তাহলে পজিশনটি লাভের সাথে বন্ধ করুন।
- একটি পজিশন ধরে রাখার সময়, বর্তমান পজিশন বন্ধ না হওয়া পর্যন্ত কোন নতুন ক্রয় সংকেত উৎপন্ন হবে না।
কৌশলগত সুবিধা
- সহজ এবং ব্যবহার করা সহজঃ কৌশল যুক্তি স্পষ্ট এবং শুধুমাত্র কয়েক পরামিতি সেট করার প্রয়োজন হয়, এটি নবীন ব্যবহারকারীদের জন্য উপযুক্ত করে তোলে।
- প্রবণতা ট্র্যাকিংঃ RSI ইন্ডিকেটর ব্যবহার করে ওভারসোল্ড শর্ত নির্ধারণ করে, এটি একটি প্রবণতার প্রাথমিক পর্যায়ে অংশগ্রহণ করতে পারে এবং সম্ভাব্য বিপরীতমুখী সুযোগগুলি ক্যাপচার করতে পারে।
- ঝুঁকি নিয়ন্ত্রণঃ স্টপ লস এবং লাভ গ্রহণের মাধ্যমে, এটি ইতিমধ্যে প্রাপ্ত মুনাফা লক করার সময় একটি একক ব্যবসায়ের ঝুঁকি এক্সপোজারকে কার্যকরভাবে নিয়ন্ত্রণ করতে পারে।
কৌশলগত ঝুঁকি
- প্যারামিটার অপ্টিমাইজেশানঃ কৌশলটির কার্যকারিতা RSI সময়কাল এবং oversold threshold এর মতো প্যারামিটারগুলির নির্বাচনের উপর নির্ভর করে এবং বিভিন্ন প্যারামিটার সেটিং বিভিন্ন ফলাফল আনতে পারে।
- বাজার ঝুঁকিঃ যখন বাজার অব্যাহতভাবে হ্রাস পায়, তখন আরএসআই দীর্ঘ সময় ধরে ওভারসোল্ড অঞ্চলে থাকতে পারে, যার ফলে প্রায়শই মিথ্যা সংকেত পাওয়া যায়।
- প্রবণতা ঝুঁকিঃ এই কৌশলটি দোলনশীল বাজারে ভাল কাজ করে, কিন্তু শক্তিশালী প্রবণতা বাজারে, প্রবণতা ট্র্যাকিং ক্ষমতা অভাবের কারণে, এটি কিছু মুনাফা মিস করতে পারে।
কৌশল অপ্টিমাইজেশান নির্দেশাবলী
- প্রবণতা ফিল্টারিং যোগ করুন: একটি ক্রয় সংকেত তৈরি করার আগে, প্রথমে বর্তমান বাজারটি একটি আপগ্রেড প্রবণতা রয়েছে কিনা তা নির্ধারণ করুন। বিচারে সহায়তা করার জন্য চলমান গড় বা অন্যান্য প্রবণতা সূচকগুলি ব্যবহার করা যেতে পারে।
- স্টপ লস অপ্টিমাইজ করুন এবং মুনাফা নিনঃ একটি উচ্চতর রিটার্ন-টু-রিস্ক অনুপাতের লক্ষ্যে, স্বয়ংক্রিয়ভাবে স্টপ লস এবং মুনাফা গ্রহণের অবস্থান সামঞ্জস্য করে একটি ট্রেলিং স্টপ বা গতিশীল লাভ গ্রহণের ব্যবহার বিবেচনা করুন।
- অন্যান্য সূচকগুলির সাথে একত্রিত করুনঃ সিগন্যালগুলির নির্ভরযোগ্যতা এবং নির্ভুলতা উন্নত করতে অন্যান্য সূচকগুলির সাথে (যেমন এমএসিডি, বলিংজার ব্যান্ড ইত্যাদি) আরএসআই একত্রিত করার বিষয়টি বিবেচনা করুন।
সংক্ষিপ্তসার
এই কৌশলটি স্থির স্টপ লস সেট করে এবং ঝুঁকি নিয়ন্ত্রণের জন্য মুনাফা নেওয়ার সময় বাজারে ওভারসোল্ড বিপরীতমুখী সুযোগগুলি ক্যাপচার করতে আরএসআই সূচক ব্যবহার করে। কৌশল যুক্তি সহজ এবং পরিষ্কার, শিক্ষানবিস ব্যবহারকারীদের জন্য উপযুক্ত। তবে, এই কৌশলটির কিছু সীমাবদ্ধতা রয়েছে, যেমন প্রবণতা উপলব্ধি করার দুর্বল ক্ষমতা এবং সংকেত নির্ভরযোগ্যতা উন্নত করা দরকার। অতএব, ব্যবহারিক প্রয়োগে, আমরা প্রবণতা বিচার, স্টপ লস এবং লাভের অপ্টিমাইজেশন এবং আরও শক্তিশালী ট্রেডিং পারফরম্যান্স অর্জনের জন্য সূচক সংমিশ্রণের মতো দিক থেকে কৌশলটি অনুকূলিতকরণ এবং উন্নত করার বিষয়ে বিবেচনা করতে পারি।
/*backtest
start: 2024-05-01 00:00:00
end: 2024-05-31 23:59:59
period: 1h
basePeriod: 15m
exchanges: [{"eid":"Futures_Binance","currency":"BTC_USDT"}]
*/

//@version=5
strategy("Estratégia com RSI (Apenas Compras)", overlay=true)

// Parâmetros de entrada
rsiLength = input.int(14, title="Período do RSI")
oversold = input.int(30, title="Nível de Sobrevenda (RSI)")
stopLossPercent = input.float(2.0, title="Stop Loss (%)")
takeProfitPercent = input.float(5.0, title="Take Profit (%)")

// Cálculo do RSI
rsi = ta.rsi(close, rsiLength)

// Sinal de Compra
buySignal = ta.crossover(rsi, oversold)

// Plotando o sinal de compra
plotshape(series=buySignal, location=location.belowbar, color=color.green, style=shape.labelup, title="Compra", text="Buy")

// Variáveis para Stop Loss e Take Profit
var float longStop = na
var float longTake = na

// Entrando na posição de compra
if (buySignal)
    entryPrice = close
    longStop := entryPrice * (1 - stopLossPercent / 100)
    longTake := entryPrice * (1 + takeProfitPercent / 100)
    strategy.entry("Compra", strategy.long)
    label.new(x=bar_index, y=low, text="Compra", style=label.style_label_up, color=color.green)

// Gerenciamento de Stop Loss e Take Profit
if (strategy.position_size > 0)
    if (close <= longStop)
        strategy.close("Compra", comment="Stop Loss")
        label.new(x=bar_index, y=low, text="Stop Loss", style=label.style_label_down, color=color.red)
    if (close >= longTake)
        strategy.close("Compra", comment="Take Profit")
        label.new(x=bar_index, y=high, text="Take Profit", style=label.style_label_up, color=color.green)

// Plotando as linhas de Stop Loss e Take Profit
plot(longStop, color=color.red, linewidth=1, title="Stop Loss Long")
plot(longTake, color=color.green, linewidth=1, title="Take Profit Long")
- মাল্টি-জোন আরএসআই ট্রেডিং কৌশল
- RSI-ভিত্তিক ট্রেডিং স্ট্র্যাটেজি, শতাংশ ভিত্তিক লাভ এবং স্টপ লস
- পরিমাণগত ট্রেডিং কৌশল অনুসরণ করে RSI এবং AO এর সিনার্জিস্টিক ট্রেন্ড
- ডাবল টাইমফ্রেম স্টোকাস্টিক মম্পটাম ট্রেডিং কৌশল
- পজিশন স্কেলিং সহ মাল্টি-আরএসআই-ইএমএ ইমপুটাম হেজিং কৌশল
- আরএসআই ইম্পোমেন্টাম উন্নত ট্রেডিং কৌশল সহ ডাবল ইএমএ ক্রসওভার
- মাল্টি-টাইমফ্রেম আরএসআই ওভারসোল্ড রিভার্সাল কৌশল
- ঝুঁকি ব্যবস্থাপনা অপ্টিমাইজেশান সিস্টেমের সাথে ওজনযুক্ত চলমান গড় এবং আপেক্ষিক শক্তি সূচক ক্রসওভার কৌশল
- মাল্টি-টার্গেট ইন্টেলিজেন্ট ভলিউম ইমপুটাম ট্রেডিং কৌশল
- আরএসআই ফিল্টার সহ কৌশল অনুসরণ করে ডাবল মুভিং গড় প্রবণতা
- বোলিংজার ব্যান্ড এবং এক্সপোনেনশিয়াল মুভিং এভারেজ ক্রসওভার ট্রেডিং কৌশল
- ইএমএ এবং সুপারট্রেন্ড সংমিশ্রণ পরিমাণগত ট্রেডিং কৌশল
- EMA, RSI, TA, মাল্টি-ইন্ডিকেটর ট্রেডিং স্ট্র্যাটেজি
- SUPERTREND স্টপ-লস এবং লাভের কৌশল সহ ট্রেন্ড অনুসরণকারী লং পজিশন
- ক্রসওভার চলমান গড়ের উপর ভিত্তি করে অভিযোজিত প্রত্যাশিত মূল্য মূল্যায়ন কৌশল অনুসরণকারী প্রবণতা
- ইএমএ-র ক্রমবর্ধমান ক্রসওভার কৌশল
- ইএমএ ডায়নামিক স্টপ-লস ট্রেডিং কৌশল
- আরএসআই, এমএসিডি, বোলিংজার ব্যান্ড এবং ভলিউম-ভিত্তিক হাইব্রিড ট্রেডিং কৌশল
- ভলিউম স্পাইক সনাক্তকরণের সাথে ZLSMA-Enhanced Chandelier Exit Strategy
- ডাবল মুভিং এভারেজ ক্রসওভার, আরএসআই এবং স্টোকাস্টিক সূচকগুলির উপর ভিত্তি করে স্বল্পমেয়াদী পরিমাণগত ট্রেডিং কৌশল
- ফিশার ট্রান্সফর্ম ডায়নামিক থ্রেশহোল্ড ট্রেন্ড
- গড় বিপরীতমুখী কৌশল
- EMA100 এবং NUPL এর তুলনামূলক অব্যবহৃত মুনাফা পরিমাণগত ট্রেডিং কৌশল
- স্টোকাস্টিক অস্কিলেটর ভিত্তিক ভোল্টেবিলিটি রেঞ্জ ট্রেডিং কৌশল
- সহজ সমন্বিত কৌশলঃ পিভট পয়েন্ট সুপারট্রেন্ড এবং ডিএমএ
- ইএমএ ট্রেন্ড ফিল্টার কৌশল
- চলমান গড় ক্রসওভার কৌশল
- ইনট্রা ডে ব্রেকআউট স্ট্র্যাটেজি ৩ মিনিটের মোমবাতি উচ্চ নিম্ন পয়েন্টের ভিত্তিতে
- মুভিং এভারেজ, সাপোর্ট/রেসিস্ট্যান্স এবং ভলিউমের উপর ভিত্তি করে অ্যাডভান্স এন্ট্রি কৌশল
- ইএমএ আরএসআই এমএসিডি ডায়নামিক টেক লাভ এবং স্টপ লস ট্রেডিং কৌশল