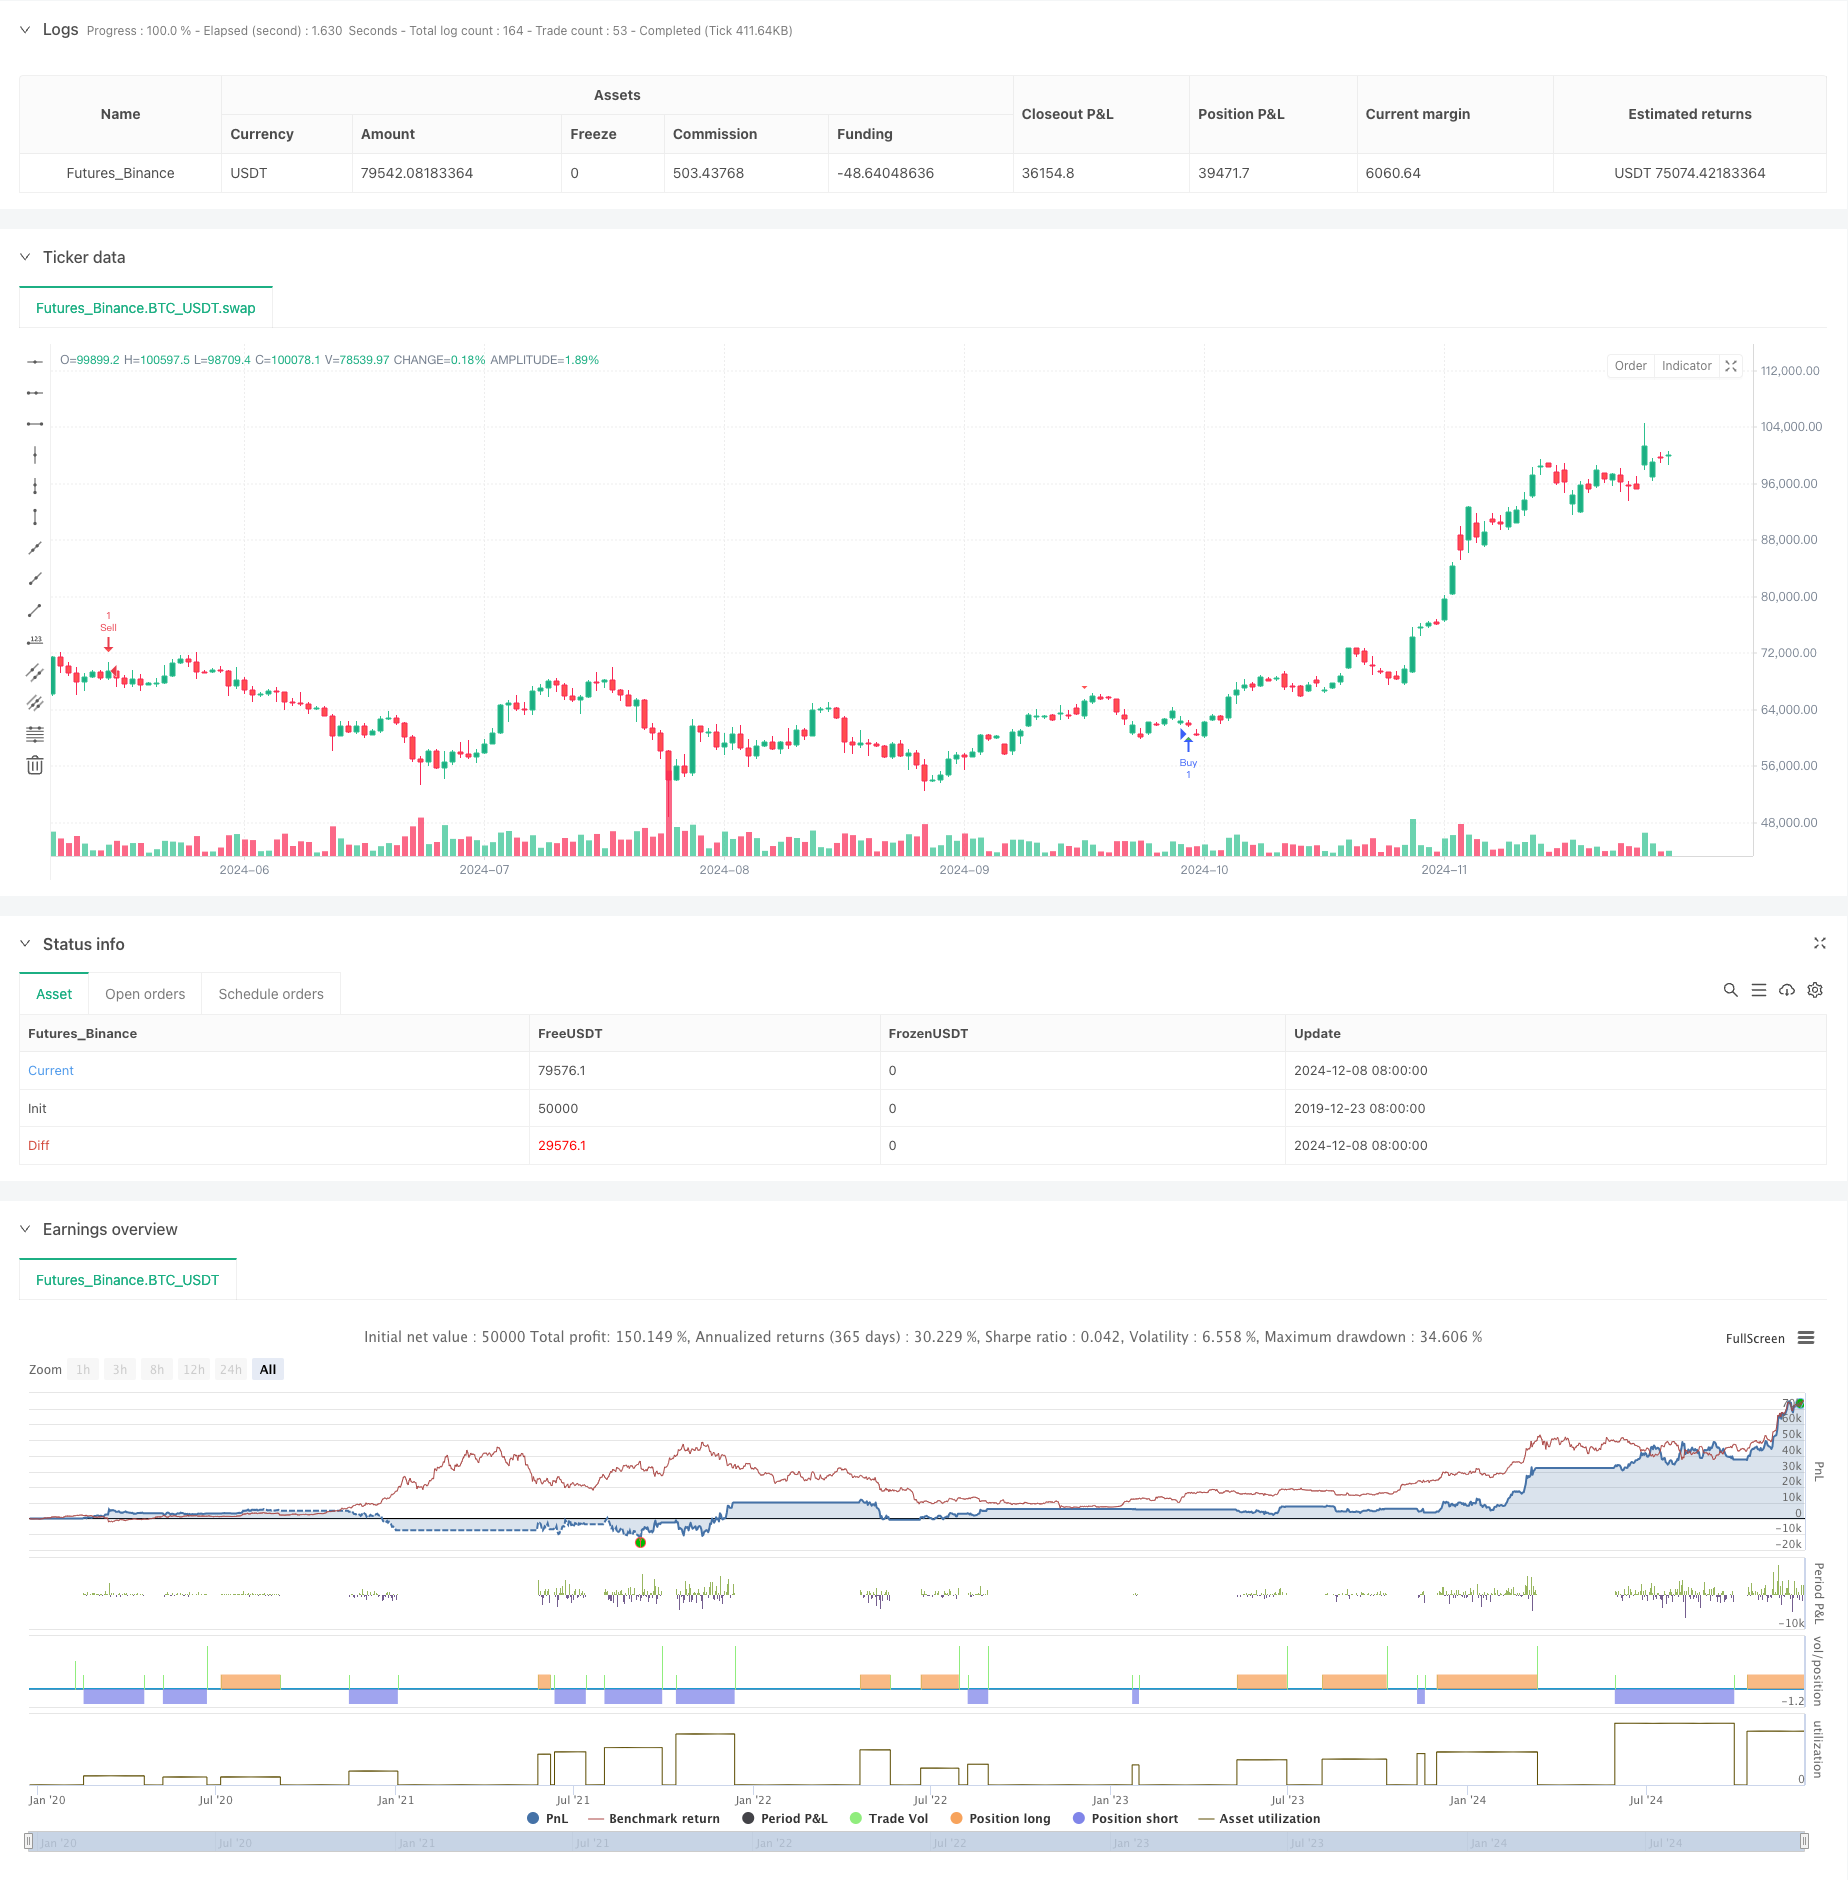
বর্ধিত গতির দোলক এবং স্টোকাস্টিক ডিভার্জেন্স পরিমাণগত ট্রেডিং কৌশল
লেখক:চাওঝাং, তারিখঃ ২০২৪-১২-১১ ১৭ঃ৪৪ঃ০১ট্যাগঃএসিআরএসআইএসএমএস্টোচটিপিSLএওডিআইভি

সারসংক্ষেপ
এই কৌশলটি একটি পরিমাণগত ট্রেডিং সিস্টেম যা অ্যাক্সিলারেটর দোলক (এসি) এবং স্টোকাস্টিক সূচকগুলিকে একত্রিত করে। এটি সম্ভাব্য প্রবণতা বিপরীতের পূর্বাভাস দেওয়ার জন্য মূল্য এবং প্রযুক্তিগত সূচকগুলির মধ্যে পার্থক্য সনাক্ত করে বাজারের গতির পরিবর্তনগুলি ক্যাপচার করে। কৌশলটি সংকেত নির্ভরযোগ্যতা বাড়ানোর জন্য সহজ চলমান গড় (এসএমএ) এবং আপেক্ষিক শক্তি সূচক (আরএসআই) অন্তর্ভুক্ত করে, ঝুঁকি নিয়ন্ত্রণের জন্য স্থির লাভ এবং স্টপ-লস স্তরের সাথে।
কৌশল নীতি
মূল যুক্তি একাধিক প্রযুক্তিগত সূচকগুলির সমন্বয়ের উপর ভিত্তি করে। এসিটি মূল্যের মাঝামাঝি পয়েন্টগুলির 5-অবধি এবং 34-অবধি এসএমএগুলির মধ্যে পার্থক্য, তার এন-অবধি চলমান গড় বিয়োগ করে গণনা করা হয়। স্টোক্যাস্টিক কে এবং ডি মানগুলি বিচ্যুতি সংকেতগুলি নিশ্চিত করার জন্য গণনা করা হয়। দাম যখন এসি বাড়ছে তখন নতুন সর্বনিম্ন করে তোলে; এসি হ্রাস পাচ্ছে তখন দাম নতুন উচ্চতা তৈরি করে bearish বিচ্যুতি গঠন করে। RSI একটি অতিরিক্ত নিশ্চিতকরণ সূচক হিসাবে অন্তর্ভুক্ত করা হয়, সংকেত নির্ভুলতা উন্নত করতে একাধিক সূচকগুলির ক্রস-বৈধতা ব্যবহার করে।
কৌশলগত সুবিধা
- একাধিক সূচক সিনারজিঃ কার্যকরভাবে এসি, স্টোকাস্টিক এবং আরএসআই এর সংমিশ্রণের মাধ্যমে মিথ্যা সংকেতগুলি ফিল্টার করে
- স্বয়ংক্রিয় ঝুঁকি নিয়ন্ত্রণঃ অন্তর্নির্মিত স্থায়ী লাভ এবং স্টপ-লস সেটিংস কার্যকরভাবে ট্রেড প্রতি ঝুঁকি নিয়ন্ত্রণ
- ভিজ্যুয়াল সিগন্যালঃ দ্রুত সুযোগ সনাক্তকরণের জন্য চার্টগুলিতে চিহ্নিত স্পষ্ট ক্রয় এবং বিক্রয় সংকেত
- উচ্চ নমনীয়তাঃ বিভিন্ন বাজারের অবস্থার জন্য উপযুক্ত শক্তিশালী পরামিতি কাস্টমাইজেশন এবং সময়সীমা
- রিয়েল-টাইম সতর্কতাঃ ইন্টিগ্রেটেড সতর্কতা সিস্টেম নিশ্চিত করে যে কোন ট্রেডিং সুযোগ মিস করা হবে না
কৌশলগত ঝুঁকি
- ভ্রান্ত ব্রেকআউট ঝুঁকিঃ বিভিন্ন বাজারে ভ্রান্ত বিভিন্নতার সংকেত সৃষ্টি করতে পারে
- স্লিপিং ঝুঁকিঃ অস্থির বাজারে ফিক্সড পাইপ লাভ এবং স্টপ লসকে উল্লেখযোগ্য স্লিপিংয়ের মুখোমুখি হতে পারে
- প্যারামিটার সংবেদনশীলতাঃ বিভিন্ন প্যারামিটার সমন্বয় কৌশল কর্মক্ষমতা পরিবর্তিত হতে পারে
- বাজার পরিবেশের উপর নির্ভরশীলতাঃ স্পষ্ট প্রবণতা অভাবের বাজারে কৌশলটি কম ফলপ্রসূ হতে পারে
- সংকেত বিলম্বঃ চলমান গড় গণনার কারণে কিছু বিলম্ব থাকতে পারে
কৌশল অপ্টিমাইজেশান নির্দেশাবলী
- ডায়নামিক টেক-ওয়েফ/স্টপ-লসঃ বাজারের অস্থিরতার উপর ভিত্তি করে স্তরগুলি সামঞ্জস্য করুন
- ভলিউম ইন্ডিকেটর ইন্টিগ্রেশনঃ ভলিউম নিশ্চিতকরণের মাধ্যমে সংকেতের নির্ভরযোগ্যতা বাড়ান
- বাজার পরিবেশ ফিল্টারিংঃ বিভিন্ন বাজার অবস্থার জন্য প্রবণতা মূল্যায়ন মডিউল যোগ করুন
- পরামিতি অপ্টিমাইজেশনঃ সূচক পরামিতি সমন্বয় অপ্টিমাইজ করার জন্য মেশিন লার্নিং পদ্ধতি ব্যবহার করুন
- সময় ফিল্টারিংঃ অনুপযুক্ত ট্রেডিং সময় এড়ানোর জন্য বাজারের সময় বৈশিষ্ট্য বিবেচনা করুন
সংক্ষিপ্তসার
এটি একটি পরিমাণগত ট্রেডিং কৌশল যা একাধিক প্রযুক্তিগত সূচককে একীভূত করে, বিচ্যুতি সংকেতগুলির মাধ্যমে বাজারের পালা পয়েন্টগুলি ক্যাপচার করে। এর শক্তিগুলি একাধিক সূচক এবং বিস্তৃত ঝুঁকি নিয়ন্ত্রণ ব্যবস্থার ক্রস-বৈধকরণে রয়েছে, যখন মিথ্যা ব্রেকআউট এবং পরামিতি অপ্টিমাইজেশনে মনোযোগ দিতে হবে। ক্রমাগত অপ্টিমাইজেশন এবং উন্নতির মাধ্যমে, কৌশলটি বিভিন্ন বাজারের পরিবেশে স্থিতিশীল কর্মক্ষমতা বজায় রাখার প্রতিশ্রুতি দেখায়।
/*backtest
start: 2019-12-23 08:00:00
end: 2024-12-09 08:00:00
period: 1d
basePeriod: 1d
exchanges: [{"eid":"Futures_Binance","currency":"BTC_USDT"}]
*/

// This Pine Script™ code is subject to the terms of the Mozilla Public License 2.0 at https://mozilla.org/MPL/2.0/
// © JayQwae


//@version=5
strategy("Enhanced AC Divergence Strategy with Stochastic Divergence", overlay=true)

// Input settings
tp_pips = input.float(0.0020, "Take Profit (in price)", step=0.0001)
sl_pips = input.float(0.0040, "Stop Loss (in price)", step=0.0001)  // 40 pips
ac_length = input.int(5, "AC Length")
rsi_length = input.int(14, "RSI Length")
stoch_k = input.int(14, "Stochastic K Length")
stoch_d = input.int(3, "Stochastic D Smoothing")
stoch_ob = input.float(80, "Stochastic Overbought Level")
stoch_os = input.float(20, "Stochastic Oversold Level")

// Accelerator Oscillator Calculation
high_low_mid = (high + low) / 2
ao = ta.sma(high_low_mid, 5) - ta.sma(high_low_mid, 34)
ac = ao - ta.sma(ao, ac_length)

// RSI Calculation
rsi = ta.rsi(close, rsi_length)

// Stochastic Oscillator Calculation
k = ta.sma(ta.stoch(close, high, low, stoch_k), stoch_d)
d = ta.sma(k, stoch_d)

// Stochastic Divergence Detection
stoch_bull_div = ta.lowest(close, 5) < ta.lowest(close[1], 5) and ta.lowest(k, 5) > ta.lowest(k[1], 5)
stoch_bear_div = ta.highest(close, 5) > ta.highest(close[1], 5) and ta.highest(k, 5) < ta.highest(k[1], 5)

// Main Divergence Detection
bullish_div = ta.lowest(close, 5) < ta.lowest(close[1], 5) and ac > ac[1] and stoch_bull_div
bearish_div = ta.highest(close, 5) > ta.highest(close[1], 5) and ac < ac[1] and stoch_bear_div

// Plot divergences
plotshape(bullish_div, title="Bullish Divergence", location=location.belowbar, color=color.green, style=shape.triangleup, size=size.small)
plotshape(bearish_div, title="Bearish Divergence", location=location.abovebar, color=color.red, style=shape.triangledown, size=size.small)

// Strategy rules
if (bullish_div)
    strategy.entry("Buy", strategy.long)
    strategy.exit("Take Profit/Stop Loss", "Buy", limit=close + tp_pips, stop=close - sl_pips)

if (bearish_div)
    strategy.entry("Sell", strategy.short)
    strategy.exit("Take Profit/Stop Loss", "Sell", limit=close - tp_pips, stop=close + sl_pips)

// Alerts
if (bullish_div)
    alert("Bullish Divergence detected! Potential Buy Opportunity", alert.freq_once_per_bar)

if (bearish_div)
    alert("Bearish Divergence detected! Potential Sell Opportunity", alert.freq_once_per_bar)
- পরিমাণগত ট্রেডিং কৌশল অনুসরণ করে RSI এবং AO এর সিনার্জিস্টিক ট্রেন্ড
- মাল্টি-টার্গেট ইন্টেলিজেন্ট ভলিউম ইমপুটাম ট্রেডিং কৌশল
- আরএসআই ফিল্টার সহ কৌশল অনুসরণ করে ডাবল মুভিং গড় প্রবণতা
- RSI ট্রেন্ড ইমপুটাম ট্র্যাকিং স্ট্র্যাটেজি সহ চলমান গড় ক্রসওভার
- ডাবল মুভিং এভারেজ-আরএসআই সিনার্জি অপশন পরিমাণগত ট্রেডিং কৌশল
- আরএসআই এবং চলমান গড়ের পর ট্রেডিং কৌশল
- RSI ফিল্টার সহ OBV-SMA ক্রসওভার
- মাল্টি-ইন্ডিকেটর ডায়নামিক ট্রেডিং স্ট্র্যাটেজি
- ডায়নামিক এটিআর স্টপ-লস আরএসআই ওভারসোল্ড রিবাউন্ড কোয়ালিটেটিভ কৌশল
- প্রবণতা ফিল্টার এবং ব্যতিক্রম প্রস্থান সঙ্গে মসৃণ চলমান গড় স্টপ লস & লাভ গ্রহণ কৌশল
- ডায়নামিক গ্রিড পজিশন সাইজিং কৌশল অনুসরণ করে প্রবণতা
- ডুয়াল বিবিআই (বুলস অ্যান্ড বিয়ারস ইনডেক্স) ক্রসওভার কৌশল
- মুভিং এভারেজ ক্রসওভার সিগন্যাল সিস্টেমের সাথে ডায়নামিক লং/শর্ট সুইং ট্রেডিং কৌশল
- ট্রেডিং কৌশল অনুসরণ করে মাল্টি-টেকনিক্যাল ইন্ডিকেটর ট্রেন্ড
- অ্যাডভান্সড ভোল্টেবিলিটি মিডিয়ান রিভার্সন ট্রেডিং স্ট্র্যাটেজিঃ ভিআইএক্স এবং চলমান গড়ের উপর ভিত্তি করে মাল্টি-ডাইমেনশানাল কন্টেন্ট ট্রেডিং সিস্টেম
- স্বর্ণের ট্রেন্ড চ্যানেল বিপরীত গতির কৌশল
- উন্নত ইএমএ মম্পটম ট্রেডিং কৌশল
- মাল্টি-এমএ ট্রেন্ড ইনটেন্সিটি ট্রেডিং কৌশল - এমএ ডিভিয়েশনের উপর ভিত্তি করে একটি নমনীয় স্মার্ট ট্রেডিং সিস্টেম
- ভলিউম-ওয়েটেড ডাবল ট্রেন্ড ডিটেকশন সিস্টেম
- মাল্টি-ফ্যাক্টর কাউন্টার-ট্রেন্ড ট্রেডিং কৌশল
- ট্রেন্ড ব্রেকআউট ট্রেডিং কৌশল সহ মাল্টি-টাইমফ্রেম ফিবোনাচি রিট্র্যাকশন
- মুনাফা অপ্টিমাইজেশান সহ একাধিক সূচক প্রবণতা অনুসরণ কৌশল
- ফ্রেক্টাল ব্রেকআউট মুনাফা অপ্টিমাইজেশান সহ গতির ট্রেডিং কৌশল
- চ্যান্ডে মম্পটাম অ্যাসিললেটর ভিত্তিক অভিযোজিত গড়-পরিশোধ ট্রেডিং কৌশল
- ট্রেডিং কৌশল অনুসরণ করে MACD-Supertrend ডাবল কনফার্মেশন ট্রেন্ড
- মাল্টি-পিরিয়ড সুপারট্রেন্ড ডায়নামিক ট্রেডিং কৌশল
- ফিবোনাচি রিট্র্যাক্সি এবং পিভট পয়েন্ট ট্রেডিং কৌশল সহ মাল্টি-টাইমফ্রেম ইএমএ
- মাল্টি-টাইমফ্রেম ডায়নামিক স্টপ-লস ইএমএ-স্কিম ট্রেডিং কৌশল
- এমএসিডি এবং লিনিয়ার রিগ্রেশন ডুয়াল সিগন্যাল ইন্টেলিজেন্ট ট্রেডিং কৌশল
- ট্রেডিং কৌশল অনুসরণ করে মাল্টি-ইএমএ ট্রেন্ড