MACD-Crossover-Strategie
Schriftsteller:ChaoZhang, Datum: 2024-04-18 17:56:23Tags:EMA- Nein.

Übersicht
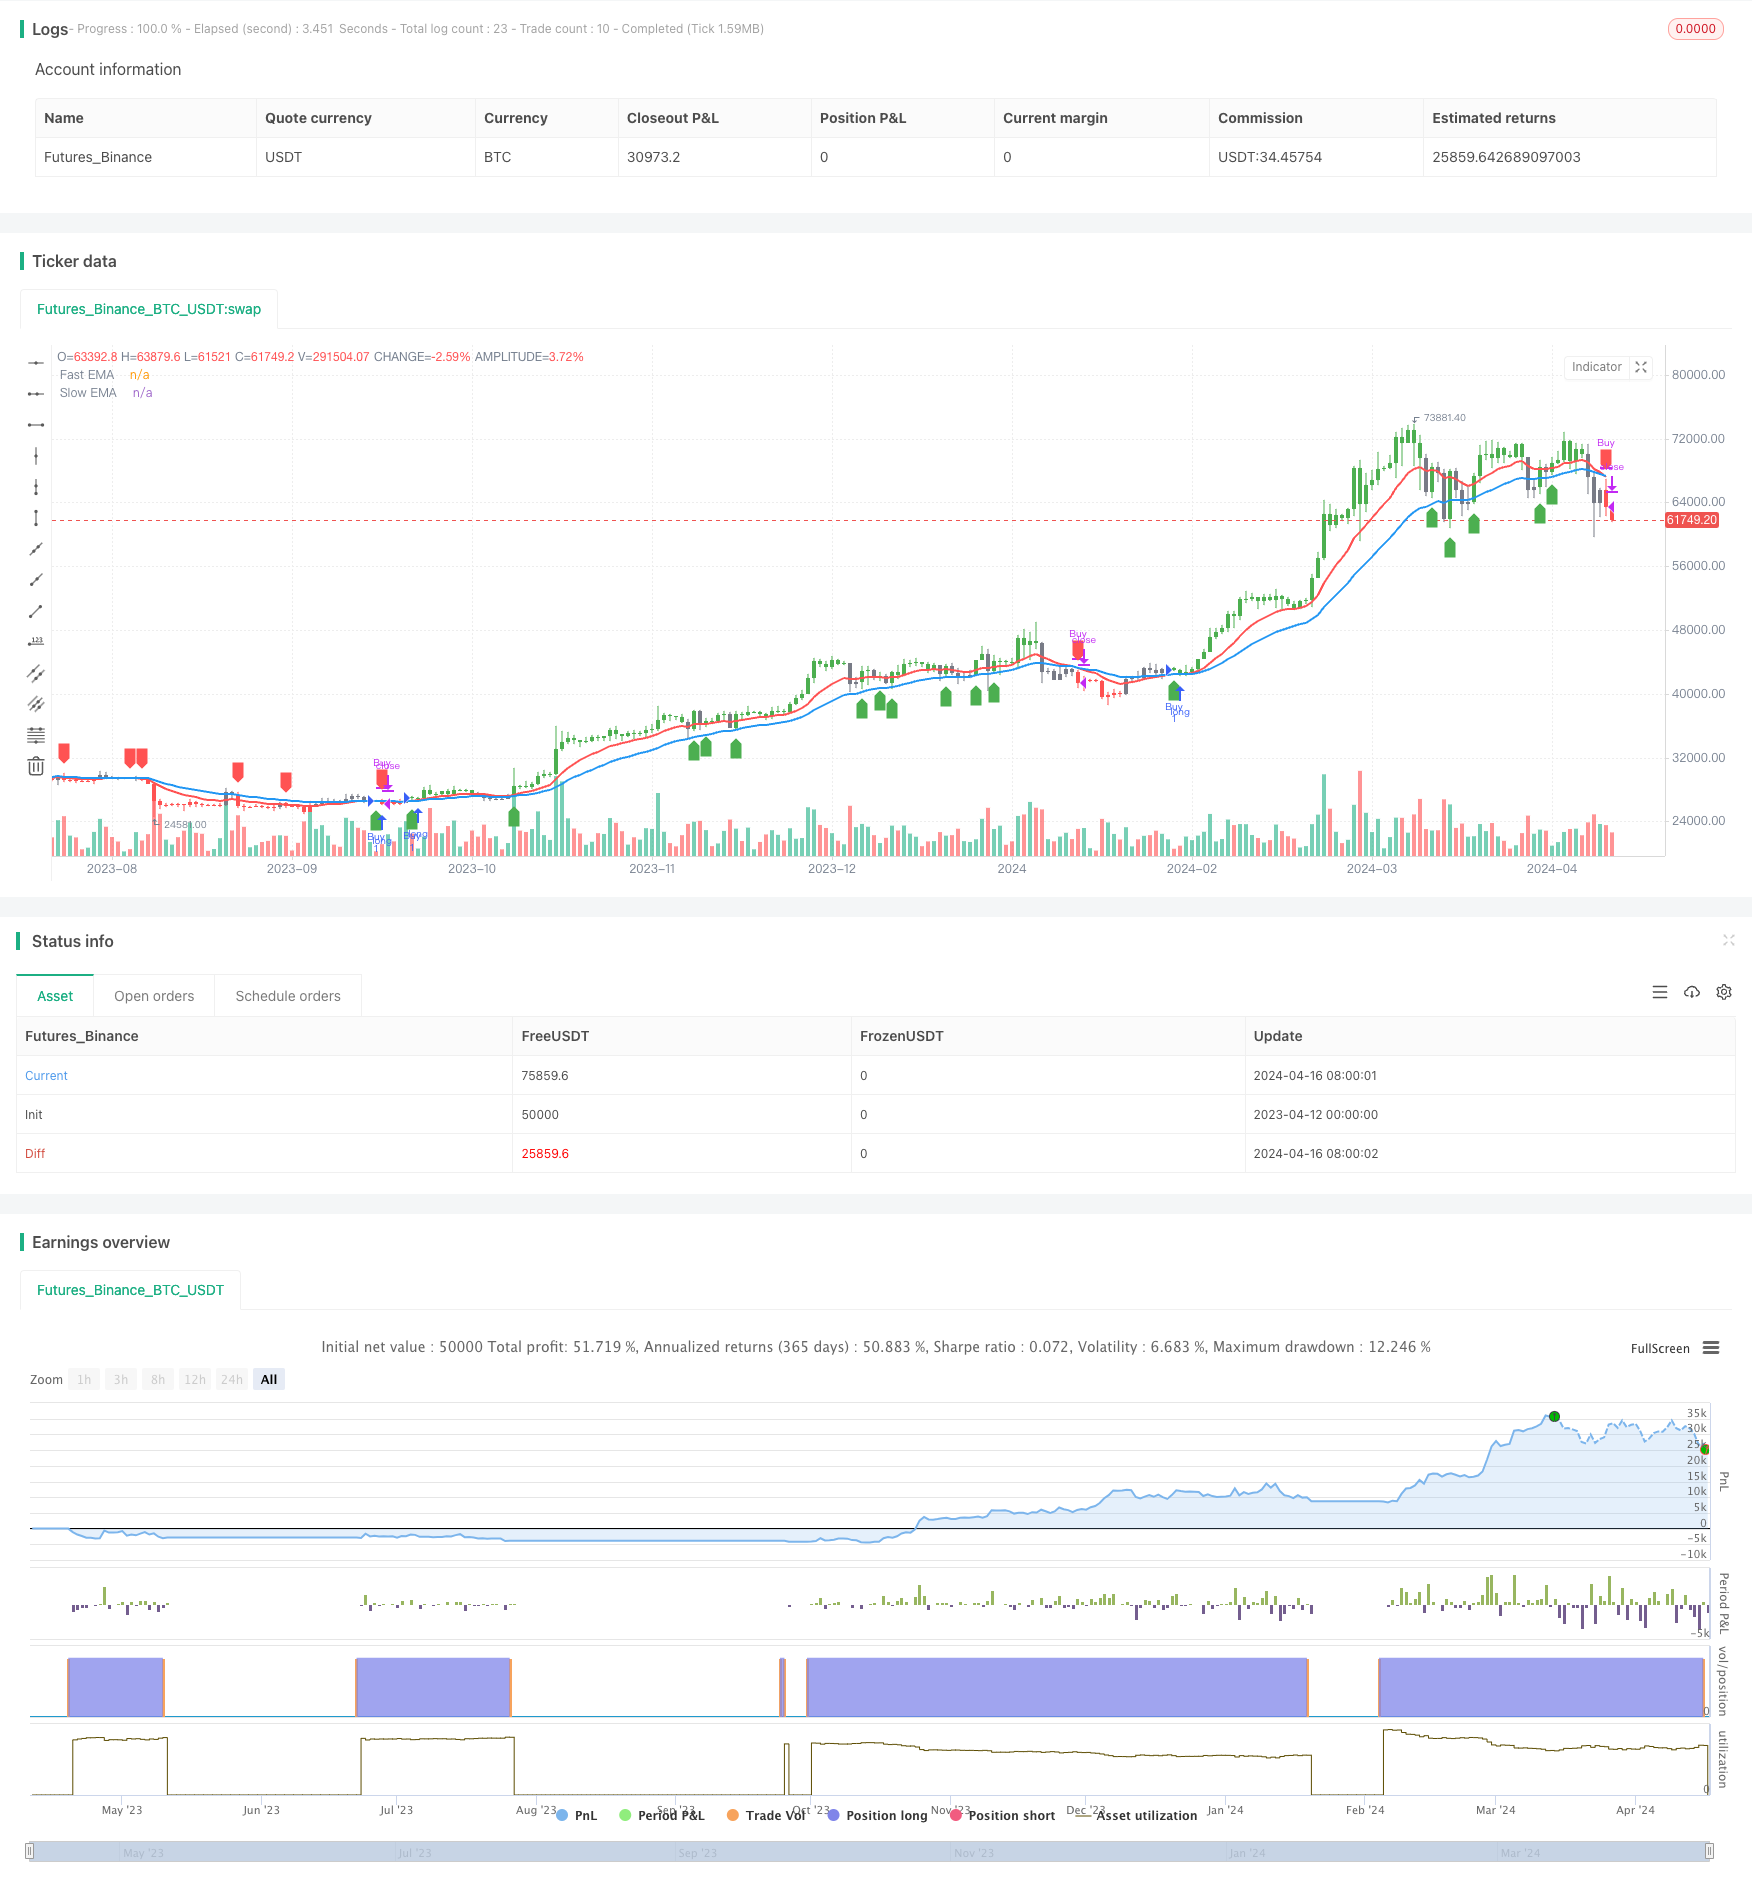
Diese Strategie verwendet das Crossover von zwei exponentiellen gleitenden Durchschnitten (EMA) mit verschiedenen Perioden, um Handelssignale zu generieren. Wenn die schnelle EMA über die langsame EMA überschreitet, generiert sie ein Kaufsignal, und wenn die schnelle EMA unter die langsame EMA überschreitet, generiert sie ein Verkaufssignal. Diese Strategie kann auf verschiedene Finanzinstrumente und Zeitrahmen angewendet werden, wie Gold am effektivsten auf dem 2-Stunden-Zeitrahmen und Bitcoin am effektivsten auf dem Tageschart usw.
Strategieprinzip
- Berechnen Sie den schnellen EMA (Verfallsperiode ist 12) und den langsamen EMA (Verfallperiode ist 26).
- Definieren Sie die bullische Zone (schnelle EMA über langsame EMA und Preis über schnelle EMA) und die bärische Zone (schnelle EMA unter langsame EMA und Preis unter schnelle EMA).
- Kaufen, wenn Sie von der Bärenzone in die Bullezone wechseln, und verkaufen, wenn Sie von der Bullezone in die Bällezone wechseln.
- Markieren Sie die bullischen und bärischen Zonen auf dem Diagramm mit grünen und roten Farben und verwenden Sie Pfeile, um die Kauf- und Verkaufssignale zu markieren.
Strategische Vorteile
- Einfach und leicht verständlich, geeignet für Anfänger.
- Umfassend anwendbar, kann für verschiedene Finanzinstrumente und Zeitrahmen verwendet werden.
- Eine starke Trendverfolgungsfähigkeit, in der Lage, mittelfristige und langfristige Trends zu erfassen.
- Einstellbare Parameter, erhöhte Flexibilität.
Strategische Risiken
- Anfällig für falsche Signale in unruhigen Märkten, was zu Verlusten führt.
- Langsam reagieren auf Trendumkehrungen, was zu einem gewissen Abgleiten führt.
- Eine falsche Parameterwahl beeinträchtigt die Leistung der Strategie.
Strategieoptimierungsrichtlinien
- Hinzufügen von Trendfiltern, z. B. nur dann handeln, wenn der ADX einen bestimmten Wert übersteigt, um Verluste in unruhigen Märkten zu reduzieren.
- Optimieren Sie den Ein- und Ausstiegszeitplan, z. B. die Verwendung von ATR zur Bestimmung von Stop-Loss und Take-Profit, wodurch Einzelhandelsverluste reduziert werden.
- Optimierung der Parameter, um die beste Kombination zu finden, wodurch Stabilität und Rentabilität verbessert werden.
- Kombination mit anderen Indikatoren für Hilfsurteile wie MACD, RSI usw. zur Verbesserung der Signalgenauigkeit.
Zusammenfassung
Die MACD-Crossover-Strategie ist eine einfache Strategie, die auf dem Trend folgen basiert. Ihre Vorteile sind Einfachheit, Praktikabilität und breite Anwendbarkeit, während ihre Nachteile Schwierigkeiten bei der Erfassung von Trendumkehrungen und Parameterwahl sind. Durch Trendfilterung, Optimierung von Ein- und Ausstiegspunkten, Parameteroptimierung und Kombination anderer Indikatoren kann die Leistung dieser Strategie verbessert werden, was eine weitere Forschung und Prüfung wert ist.
/*backtest
start: 2023-04-12 00:00:00
end: 2024-04-17 00:00:00
period: 1d
basePeriod: 1h
exchanges: [{"eid":"Futures_Binance","currency":"BTC_USDT"}]
*/

//@version=5
strategy('Advance EMA Crossover Strategy', overlay=true, precision=6)
//****************************************************************************//
// CDC Action Zone is based on a simple EMA crossover
// between [default] EMA12 and EMA26
// The zones are defined by the relative position of
// price in relation to the two EMA lines
// Different zones can be use to activate / deactivate
// other trading strategies
// The strategy can also be used on its own with
// acceptable results, buy on the first green candle
// and sell on the first red candle
//****************************************************************************//
// Define User Input Variables

xsrc = input(title='Source Data', defval=close)
xprd1 = input(title='Fast EMA period', defval=12)
xprd2 = input(title='Slow EMA period', defval=26)
xsmooth = input(title='Smoothing period (1 = no smoothing)', defval=1)
fillSW = input(title='Paint Bar Colors', defval=true)
fastSW = input(title='Show fast moving average line', defval=true)
slowSW = input(title='Show slow moving average line', defval=true)
plotSigsw = input(title='Plot Buy/Sell Signals?', defval=true)

//****************************************************************************//
//Calculate Indicators

xPrice = ta.ema(xsrc, xsmooth)

FastMA = ta.ema(xPrice, xprd1)
SlowMA = ta.ema(xPrice, xprd2)

//****************************************************************************//
// Define Color Zones and Conditions

BullZone = FastMA > SlowMA and xPrice > FastMA  // Bullish Zone
BearZone = FastMA < SlowMA and xPrice < FastMA  // Bearish Zone

//****************************************************************************//
// Strategy Entry and Exit Conditions

if (BullZone and not BullZone[1])
    strategy.entry("Buy", strategy.long)  // Buy on the transition into BullZone

if (BearZone and not BearZone[1])
    strategy.close("Buy")  // Sell on the transition into BearZone

//****************************************************************************//
// Display color on chart

plotcolor = BullZone ? color.green : BearZone ? color.red : color.gray
barcolor(color=fillSW ? plotcolor : na)

//****************************************************************************//
// Plot Fast and Slow Moving Averages

plot(fastSW ? FastMA : na, color=color.red, title="Fast EMA", linewidth=2)
plot(slowSW ? SlowMA : na, color=color.blue, title="Slow EMA", linewidth=2)

//****************************************************************************//
// Plot Buy and Sell Signals

plotshape(series=plotSigsw and BullZone and not BullZone[1], location=location.belowbar, color=color.green, style=shape.labelup, title="Buy Signal")
plotshape(series=plotSigsw and BearZone and not BearZone[1], location=location.abovebar, color=color.red, style=shape.labeldown, title="Sell Signal")

//****************************************************************************//
- Übergangsstrategie für Marktübernachtpositionen mit EMA-Filter
- EMA-Doppel-Durchschnittsstrategie für gleitende Durchschnitte
- EMA-Momentum-Handelsstrategie
- Dreifache EMA-Crossover-Handelsstrategie mit dynamischem Stop-Loss und Take-Profit
- Multi-EMA Crossover-Trend nach der Strategie
- Multi-EMA-Automatisiertes Handelssystem mit Gewinnabsperrung
- Triple EMA-Trend nach quantitativer Handelsstrategie
- Mehrzeitrahmen-EMA-Trendstrategie mit täglichem High-Low-Breakout-System
- Multi-EMA-Kreuzung nach quantitativer Handelsstrategie
- EMA-Tracking-Handelssystem für die Doppelkette-Hybrid-Impulsentwicklung
- Strategie zur Erfassung von Trends mit Horizontal-Linien-Breakout
- Kreuzung des gleitenden Durchschnitts mit mehrfacher Gewinnstrategie
- MACD Goldene Kreuz- und Todekreuzstrategie
- MACD-V und Fibonacci Multi-Timeframe Dynamic Take Profit-Strategie
- Strategie für Trendfänger
- Quantitative Handelsstrategie auf der Grundlage gleitender Durchschnitte und Bollinger-Bänder
- Bollinger-Band-Breakout-Strategie
- Doppelzeitliche Dynamikstrategie
- MACD BB Breakout-Strategie
- Wavetrend Große Amplitude Überverkauft Rebound Grid Trading Strategie
- Optimierte MACD-Trend-Folgende Strategie mit ATR-basiertem Risikomanagement
- ZEROLAG MACD-Lange-Kürze-Strategie
- BBSR Extreme Strategie
- Handelsstrategie für Hochfrequenzumkehrungen auf Basis des Momentum-RSI-Indikators
- RSI-Relative Strength Index-Strategie
- Bollinger-Band-Breakout-Strategie
- Donchian Channel und Larry Williams Große Handelsindexstrategie
- SPARK Dynamische Positionsgrößerung und Handelsstrategie mit zwei Indikatoren
- Der Wechselkurs des gleitenden Durchschnitts + MACD-Slow-Line-Momentumsstrategie
- Volumenbasierte dynamische DCA-Strategie