Elliott Wave Theory 4-9 Impulse Wave Automatic Detection Trading Strategy
Author: ChaoZhang, Date: 2024-04-26 17:32:59Tags: MACDEMAMASMASARADXRSIKDJBollATR

Overview
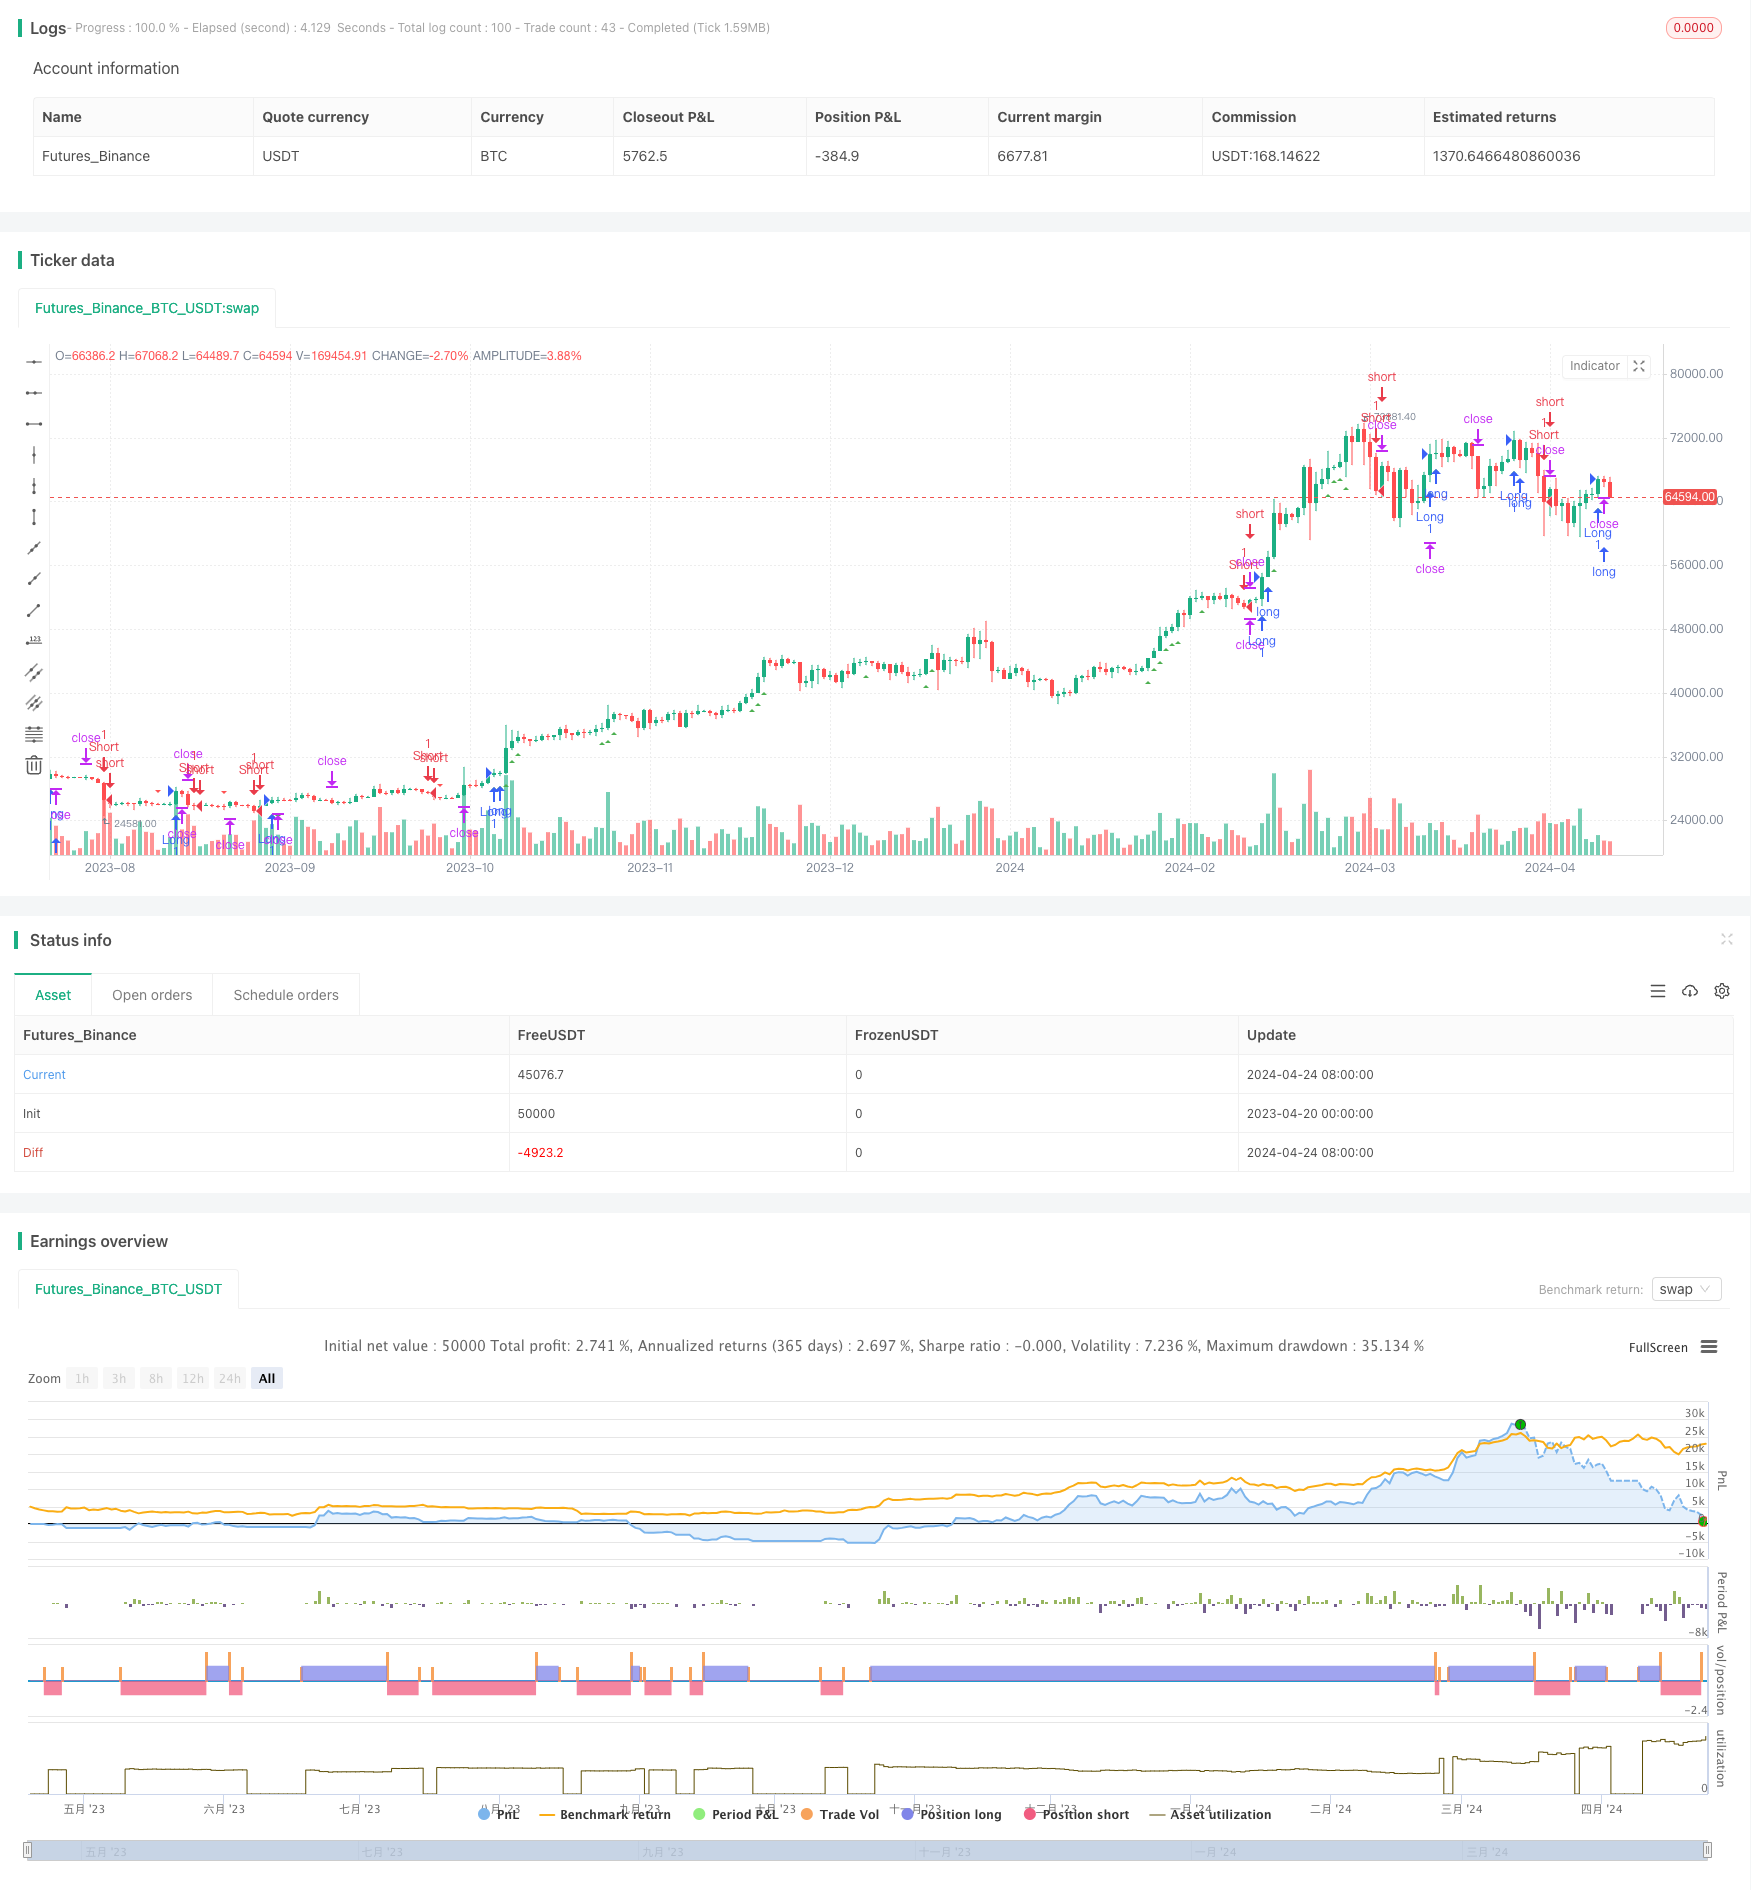
This strategy is based on the Elliott Wave Theory and attempts to automatically detect impulse waves. It defines an upward impulse wave by looking for a combination of 4 consecutive up-closing candles where the current close is higher than the close 9 days ago; a downward impulse wave is defined using the opposite logic. Once an impulse wave is detected, it generates buy or sell signals and reverses the position, with the stop loss set at the low or high of the signal candle. Since impulse waves are usually accompanied by rapid movements, this stop loss method should yield positive results. Additionally, the accumulation of green or red triangles before the start of a strong trend often indicates good entry points in a calm market before the trend initiation.
Strategy Principles
- Define the number of periods for consecutive up/down closes as consclos (default 3) and the number of days to compare the current close with the close N days ago as daysago (default 9).
- Use variables long_cc and short_cc to record whether the most recent consclos candles have consecutively closed up/down. The value is 1 if consecutive, otherwise 0.
- Compare the current close with the close daysago days ago. If the current price is higher/lower, long_daysago/short_daysago is true.
- Combine long_cc, short_cc with long_daysago, short_daysago to get the final long and short signals.
- Plot green and red triangles corresponding to the long and short signals.
- If a long signal appears and there is no current long position, go long and set the stop loss price to the low of the signal candle.
- If a short signal appears and there is no current short position, go short and set the stop loss price to the high of the signal candle.
Advantage Analysis
- Automatically identifies impulse waves in Elliott Wave Theory, reducing the influence of subjective analysis.
- Impulse waves are often accompanied by strong trends, which this strategy can capture.
- The stop loss placement is consistent with the trend direction, improving the risk-reward ratio.
- Can discover potential entry opportunities before trend initiation.
- Parameters are adjustable, making it widely applicable.
Risk Analysis
- There may be deviations in the interpretation of wave theory, leading to misjudgments.
- The duration of trends is difficult to predict, and the stop loss may be set too close, resulting in being stopped out.
- May be ineffective in sideways markets, generating frequent trades.
- Lacks consideration of position sizing and money management.
Optimization Directions
- Optimize the configuration of consclos and daysago parameters through backtesting to improve signal accuracy.
- Introduce trend confirmation indicators such as MACD to reduce noise.
- Consider adding trailing stops to better protect profits.
- When the trend is not yet clear, start with a small position and add to it once the trend becomes clear.
- Control position sizing and risk, such as limiting the percentage of funds per trade and setting a maximum drawdown.
Summary
This strategy is based on the classic Elliott Wave Theory and can capture strong trend movements with some applicability and profit potential. However, the subjectivity of wave theory itself and the definition of impulse waves may affect the strategy’s performance. In practical application, attention should be paid to parameter optimization, position management, reducing trading frequency, etc. By introducing trend confirmation indicators, trailing stops, gradual position building, and other means, the performance and stability of this strategy can be further improved.
/*backtest
start: 2023-04-20 00:00:00
end: 2024-04-25 00:00:00
period: 1d
basePeriod: 1h
exchanges: [{"eid":"Futures_Binance","currency":"BTC_USDT"}]
*/

// This Pine Script™ code is subject to the terms of the Mozilla Public License 2.0 at https://mozilla.org/MPL/2.0/
// © Smollet

//@version=5
strategy("LW: 4-9 indicator", overlay = true)

consclos = input.int(3, "Consecutive close")
daysago = input.int(9, "Days ago")


var int long_cc = 0
var int short_cc = 0

long_cc := 1
short_cc := 1

for i = 1 to consclos
    long_cc := close[i-1] > close[i] ? long_cc*1 : long_cc*0
    short_cc := close[i-1] < close[i] ? short_cc*1 : short_cc*0

long_daysago = close > close[daysago]
short_daysago = close < close[daysago]


long = long_cc ==1 and long_daysago
short = short_cc ==1 and short_daysago


plotshape(long, style=shape.triangleup, location=location.belowbar, color=color.green)
plotshape(short, style=shape.triangledown, location=location.abovebar, color=color.red)


//Strategy code
if long and strategy.position_size <= 0
    strategy.entry("Long", strategy.long)
    strategy.exit("Long SL", "Long", stop = low)

if short and strategy.position_size >= 0
    strategy.entry("Short", strategy.short)
    strategy.exit("Short SL", "Short", stop = high)
- Nifty 50 3-Minute Opening Range Breakout Strategy
- No Upper Wick Bullish Candle Breakout Strategy
- Multi-Indicator Dynamic Stop-Loss Momentum Trend Trading Strategy
- Volume-based Dynamic DCA Strategy
- Dual EMA Trend Momentum Trading Strategy
- Multi-Indicator Fusion Mean Reversion Trend Following Strategy
- Dynamic Dual Moving Average Crossover Quantitative Trading Strategy
- Quantitative Long-Short Switching Strategy Based on G-Channel and EMA
- Multi-Strategy Technical Analysis Trading System
- Enhanced Price-Volume Trend Momentum Strategy
- Fibonacci Trend Reversal Strategy
- HTF Zigzag Path Strategy
- WaveTrend Cross LazyBear Strategy
- CCI, DMI, and MACD Hybrid Long-Short Strategy
- AlphaTradingBot Trading Strategy
- Vegas SuperTrend Enhanced Strategy
- Quantitative Trading Strategy Based on Modified Hull Moving Average and Ichimoku Kinko Hyo
- RSI Trend Reversal Strategy
- Stochastic Crossover Indicator Momentum Trading Strategy
- RSI and Dual EMA Crossover Signal Quantitative Strategy
- Stochastic Oscillator and Moving Average Crossover Strategy with Stop Loss and Stochastic Filter
- Intraday Scalable Volatility Trading Strategy
- KRK aDa Stochastic Slow Mean Reversion Strategy with AI Enhancements
- Real-time Trendline Trading Based on Pivot Points and Slope
- EMA23/EMA50 Double Moving Average Crossover Quantitative Trading Strategy
- Trend-Capturing Strategy with Horizontal Line Breakout
- Moving Average Crossover with Multiple Take Profits Strategy
- MACD Golden Cross and Death Cross Strategy
- MACD-V and Fibonacci Multi-Timeframe Dynamic Take Profit Strategy
- Trend Catcher Strategy