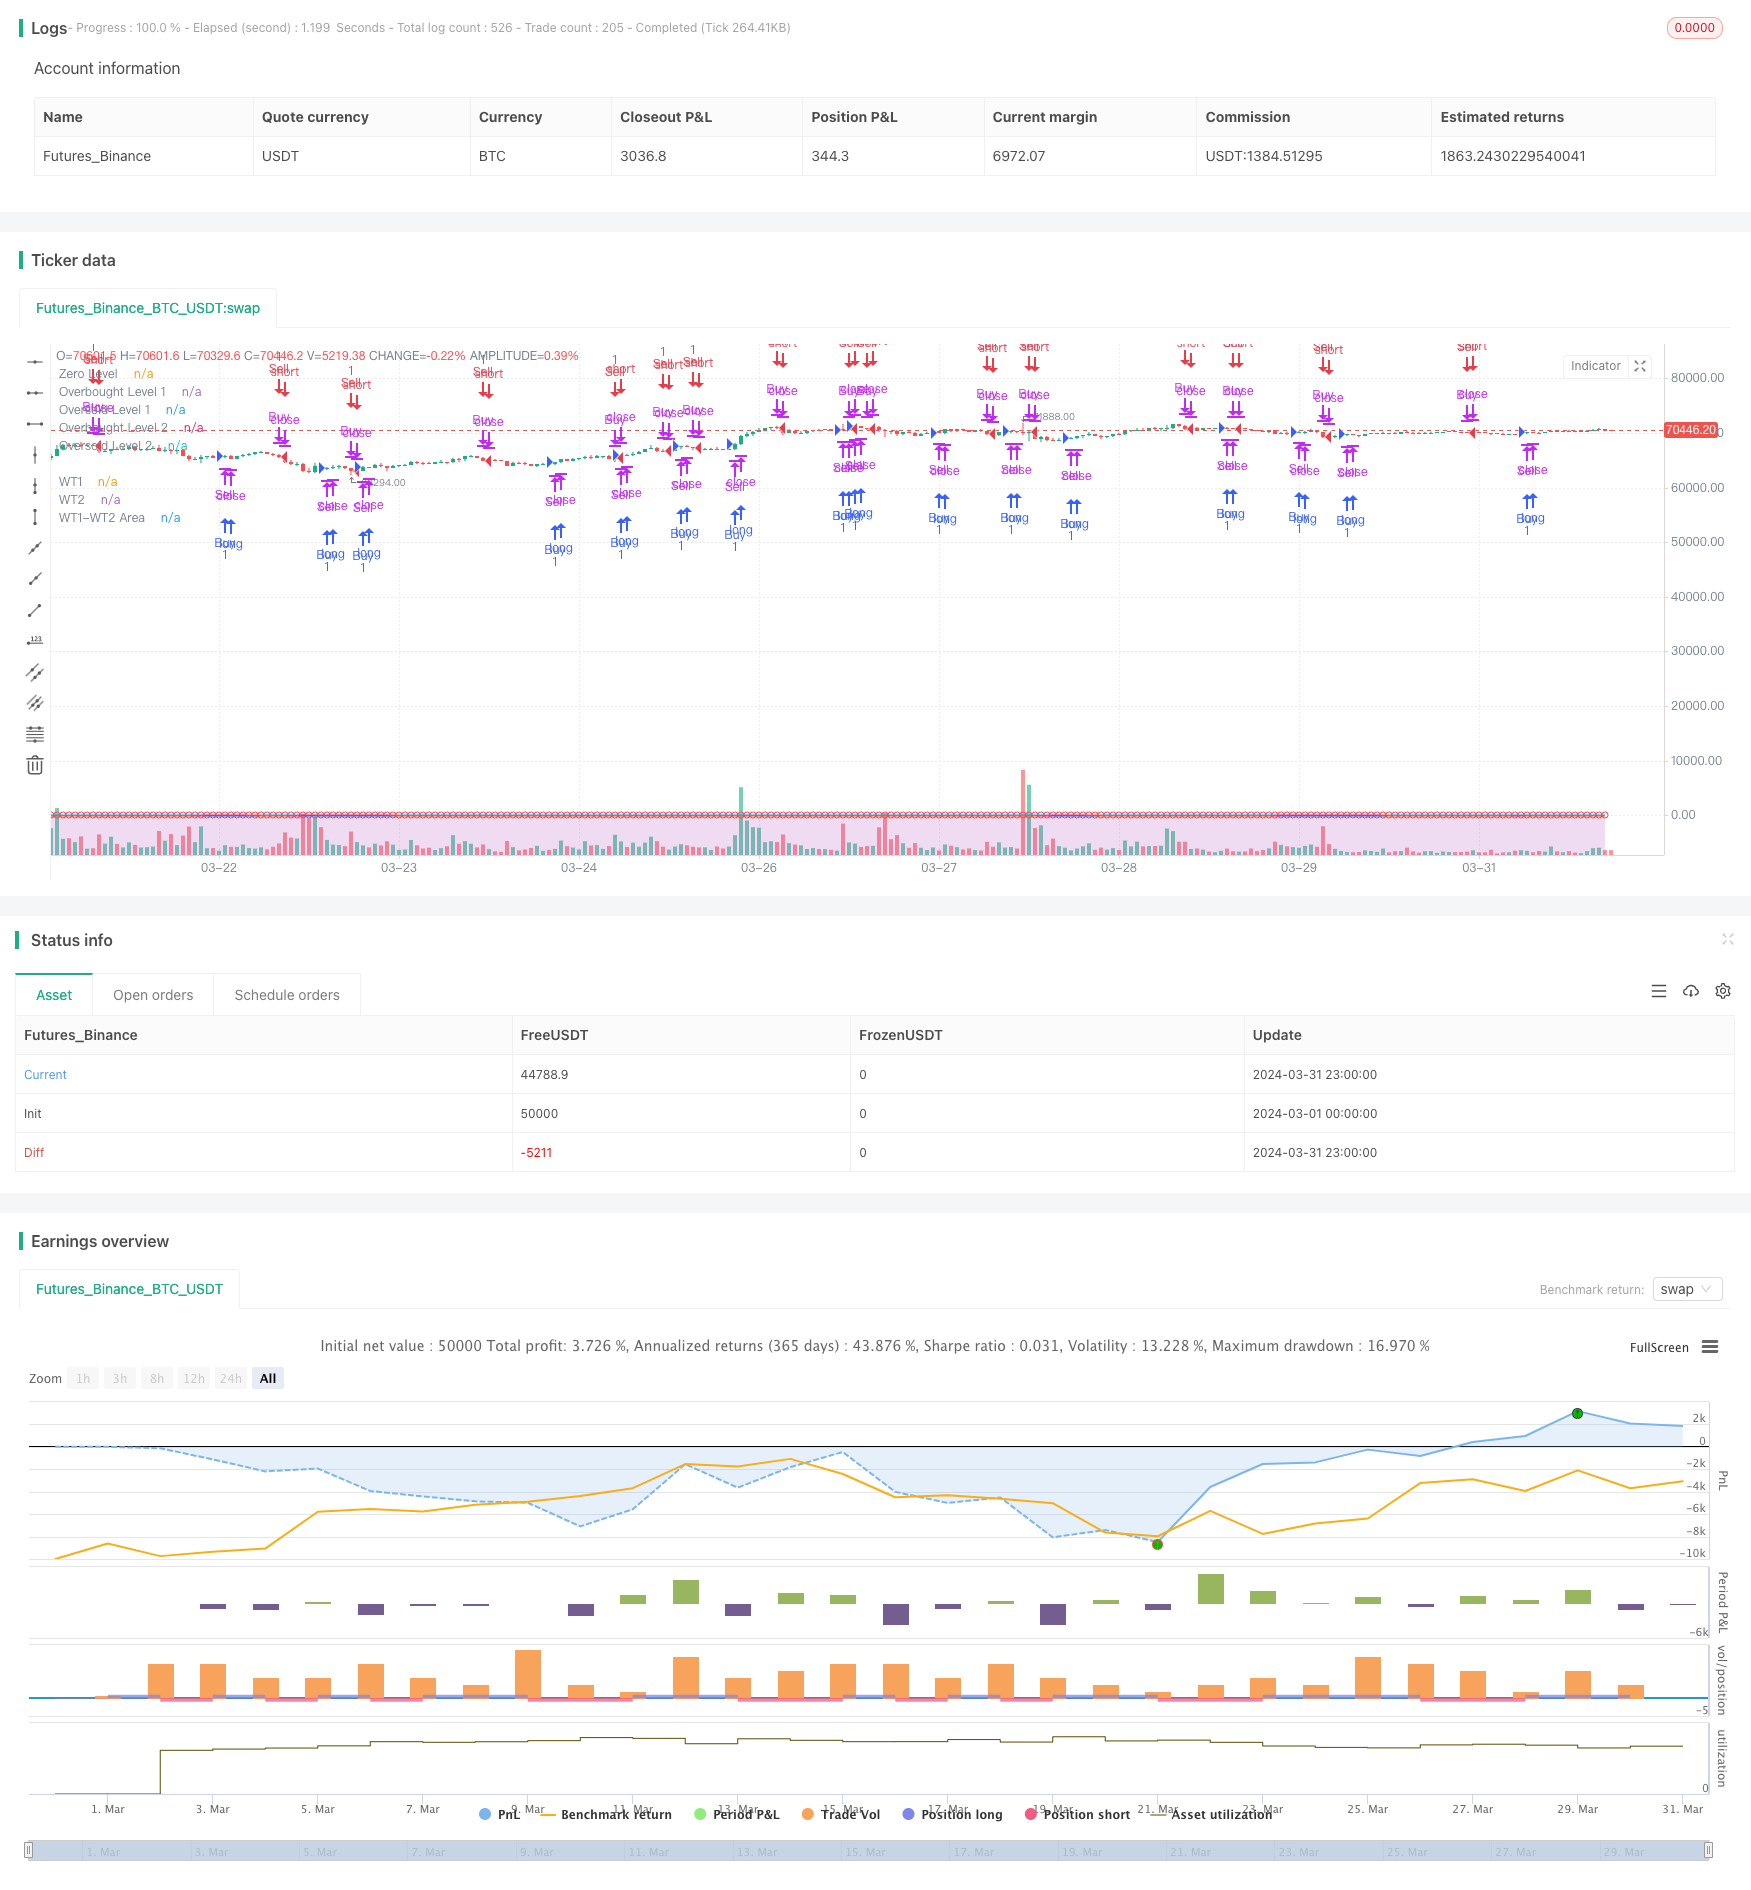
WaveTrend Cross LazyBear Strategy
Author: ChaoZhang, Date: 2024-04-28 13:56:27Tags: EMASMAHLCC3ESA

Overview
The WaveTrend Cross LazyBear strategy is a trading strategy based on the WaveTrend indicator. The strategy uses two WaveTrend indicator lines with different periods. When the faster-period WaveTrend indicator line crosses above the slower-period WaveTrend indicator line, it generates a buy signal. When the faster-period WaveTrend indicator line crosses below the slower-period WaveTrend indicator line, it generates a sell signal. The strategy also sets overbought and oversold zones to assist in judging market conditions.
Strategy Principle
The core of this strategy is the WaveTrend indicator, which is calculated by the following steps:
- Calculate the typical price (AP), which is equal to the average of the high, low, and close prices.
- Calculate the exponential moving average (ESA) of AP with a period of n1.
- Calculate the exponential moving average d of the absolute value of the difference between AP and ESA with a period of n1.
- Calculate the indicator CI, which is equal to (AP - ESA) / (0.015 * d).
- Calculate the exponential moving average TCI of CI with a period of n2 to get the WaveTrend indicator.
The strategy uses two WaveTrend indicator lines with different periods (default is 10 and 21), denoted as WT1 and WT2 respectively. When WT1 crosses above WT2, it generates a buy signal; when WT1 crosses below WT2, it generates a sell signal. In addition, the strategy also sets 4 auxiliary levels: overbought level 1, overbought level 2, oversold level 1, and oversold level 2, to assist in judging market conditions.
Strategy Advantages
- The WaveTrend indicator combines the characteristics of momentum and volatility, which can better capture market trends.
- The dual-period WaveTrend indicator can effectively filter out some noise signals.
- The setting of overbought and oversold levels can prevent the strategy from trading frequently when the market fluctuates greatly to a certain extent.
- The strategy logic is clear and easy to understand and implement.
Strategy Risks
- The strategy may generate more false signals in a oscillating market.
- The choice of parameters has a great impact on the strategy performance, and different parameters may lead to large differences in strategy performance.
- The strategy does not consider risk control and may experience large drawdowns in extreme market conditions.
Strategy Optimization Directions
- Consider adding trend filtering conditions, such as the direction of the long-term moving average, to reduce false signals in oscillating markets.
- Optimize the setting of overbought and oversold levels to make them more dynamically adapt to different market conditions.
- Add stop-loss and take-profit mechanisms to control the risk of a single transaction.
- Find the optimal parameter combination through parameter optimization.
Summary
The WaveTrend Cross LazyBear strategy is a trend-tracking strategy based on the WaveTrend indicator. Through the design of dual-period indicators and the auxiliary judgment of overbought and oversold levels, it captures trends while also taking into account certain risk control. However, the strategy may generate more false signals in oscillating markets and lacks strict risk management measures. Further optimization and improvement are needed in practical applications.
/*backtest
start: 2024-03-01 00:00:00
end: 2024-03-31 23:59:59
period: 1h
basePeriod: 15m
exchanges: [{"eid":"Futures_Binance","currency":"BTC_USDT"}]
*/

// This Pine Script™ code is subject to the terms of the Mozilla Public License 2.0 at https://mozilla.org/MPL/2.0/
// © burakaydingr

//@version=5
strategy("WaveTrend with Crosses [LazyBear]", shorttitle="WT_CROSS_LB", overlay=true)

// Kullanıcı girişleri
n1 = input(10, title="Channel Length")
n2 = input(21, title="Average Length")
obLevel1 = input(60, title="Over Bought Level 1")
obLevel2 = input(53, title="Over Bought Level 2")
osLevel1 = input(-60, title="Over Sold Level 1")
osLevel2 = input(-53, title="Over Sold Level 2")

// Temel hesaplamalar
ap = hlc3
esa = ta.ema(ap, n1)
d = ta.ema(math.abs(ap - esa), n1)
ci = (ap - esa) / (0.015 * d)
tci = ta.ema(ci, n2)

// WaveTrend göstergeleri
wt1 = tci
wt2 = ta.sma(wt1, 4)

// Al ve Sat Sinyalleri
buySignal = ta.crossover(wt1, wt2)
sellSignal = ta.crossunder(wt1, wt2)

// Alım ve Satım pozisyonları
if (buySignal)
    if (strategy.position_size <= 0) // Eğer şu anda açık bir satış pozisyonu varsa, onu kapat
        strategy.close("Sell")
    strategy.entry("Buy", strategy.long, comment="Buy Signal: Price crossed above WT2")

if (sellSignal)
    if (strategy.position_size >= 0) // Eğer şu anda açık bir alım pozisyonu varsa, onu kapat
        strategy.close("Buy")
    strategy.entry("Sell", strategy.short, comment="Sell Signal: Price crossed below WT2")

// Renkler ve diğer görseller
plot(0, color=color.new(color.gray, 0), title="Zero Level")
plot(obLevel1, color=color.new(color.red, 0), title="Overbought Level 1")
plot(osLevel1, color=color.new(color.green, 0), title="Oversold Level 1")
plot(obLevel2, color=color.new(color.purple, 0), title="Overbought Level 2")
plot(osLevel2, color=color.new(color.orange, 0), title="Oversold Level 2")

plot(wt1, color=color.new(color.red, 0), title="WT1")
plot(wt2, color=color.new(color.blue, 0), title="WT2")
plot(wt1-wt2, color=color.new(color.purple, 80), style=plot.style_area, title="WT1-WT2 Area")

// İşaretler
plotshape(buySignal, location=location.absolute, color=color.new(color.yellow, 0), style=shape.circle, size=size.small, title="Buy Signal")
plotshape(sellSignal, location=location.absolute, color=color.new(color.red, 0), style=shape.circle, size=size.small, title="Sell Signal")
- Intelligent Wave-Trend Dollar Cost Averaging Cyclical Trading Strategy
- Multi-EMA Trend Momentum Recognition and Stop-Loss Trading System
- EMA5 and EMA13 Crossover Strategy
- Multi-EMA Crossover Momentum Strategy
- EMA Crossover Momentum Scalping Strategy
- Dual EMA Volume Trend Confirmation Strategy for Quantitative Trading
- Trading ABC
- Super Moving Average and Upperband Crossover Strategy
- SMA Dual Moving Average Crossover Strategy
- EMA, SMA, Moving Average Crossover, Momentum Indicator
- VWAP Trading Strategy
- Multi-Indicator Combination Strategy (CCI, DMI, MACD, ADX)
- RSI2 Strategy Intraday Reversal Win Rate Backtest
- Hurst Future Lines of Demarcation Strategy
- Trend Following Strategy Based on OBV and MA Crossover Signals
- GBS TOP BOTTOM Confirmed Strategy
- Multi-Indicator Trend Following Strategy
- Squeeze Backtest Transformer v2.0
- Fibonacci Trend Reversal Strategy
- HTF Zigzag Path Strategy
- CCI, DMI, and MACD Hybrid Long-Short Strategy
- AlphaTradingBot Trading Strategy
- Vegas SuperTrend Enhanced Strategy
- Quantitative Trading Strategy Based on Modified Hull Moving Average and Ichimoku Kinko Hyo
- RSI Trend Reversal Strategy
- Stochastic Crossover Indicator Momentum Trading Strategy
- RSI and Dual EMA Crossover Signal Quantitative Strategy
- Elliott Wave Theory 4-9 Impulse Wave Automatic Detection Trading Strategy
- Stochastic Oscillator and Moving Average Crossover Strategy with Stop Loss and Stochastic Filter
- Intraday Scalable Volatility Trading Strategy