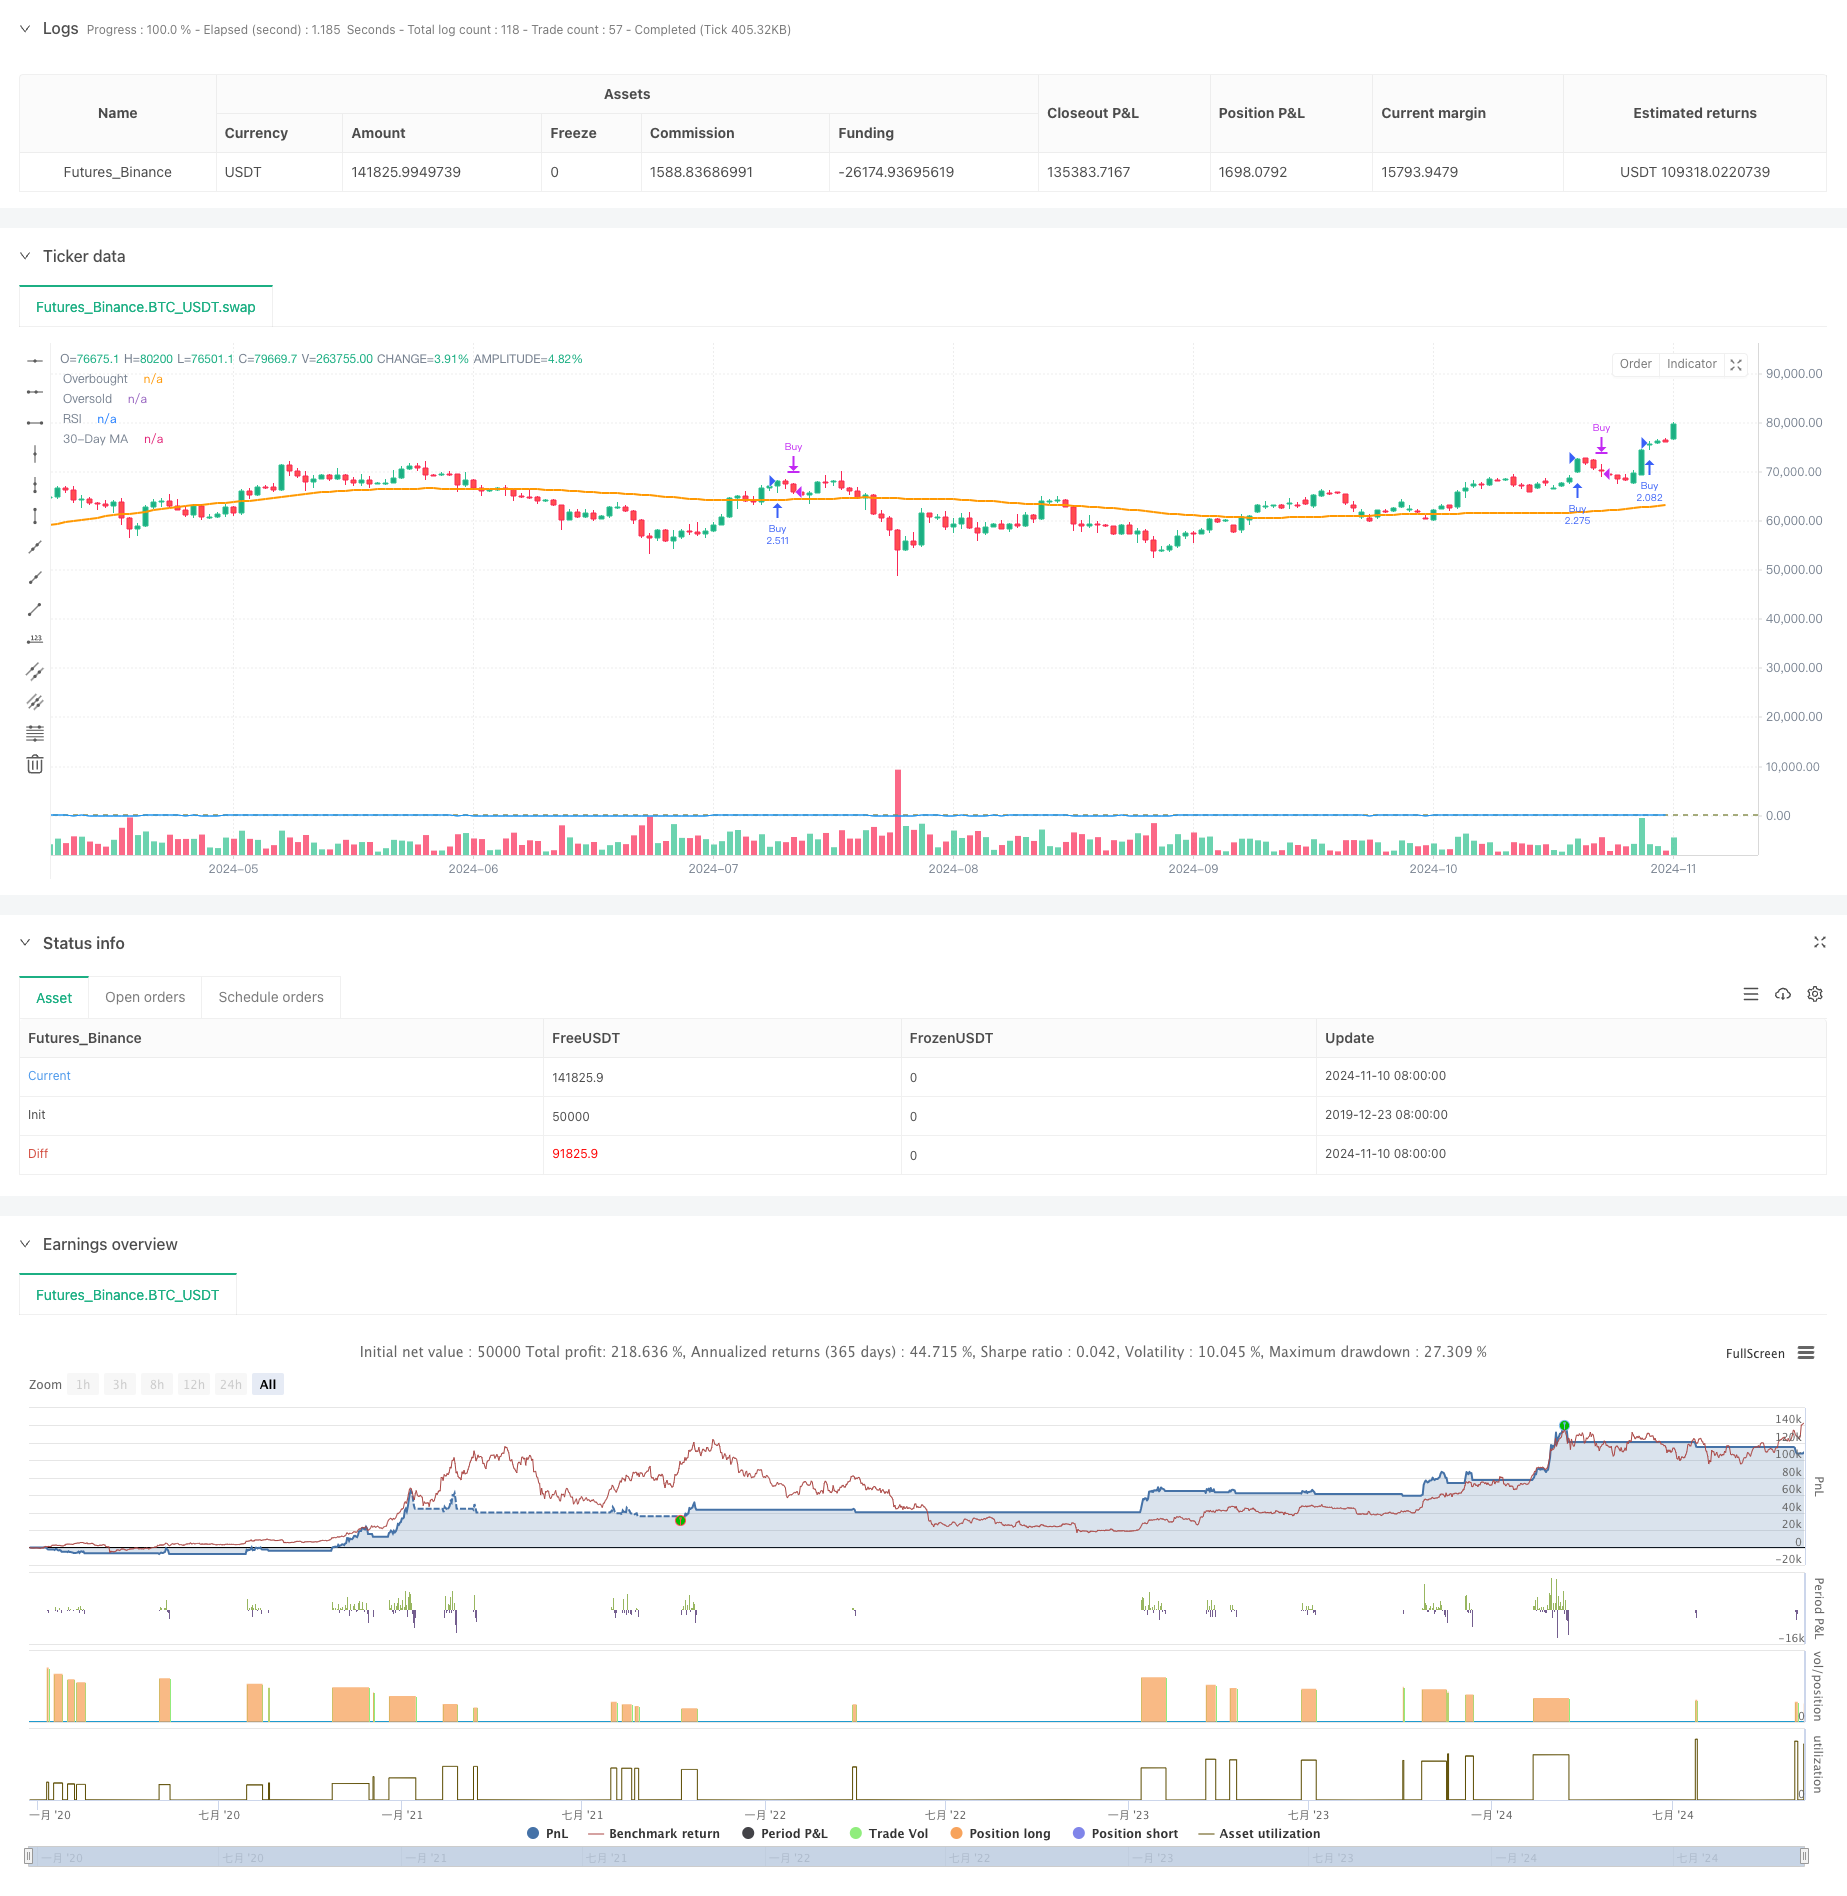
Adaptive Trend Momentum RSI Strategy with Moving Average Filter System
Author: ChaoZhang, Date: 2024-11-12 16:02:31Tags: RSISMAMATS

Overview
This strategy is a trend-following trading system that combines the Relative Strength Index (RSI) with Moving Average (MA). The core mechanism utilizes RSI to capture price momentum changes while incorporating a 90-day moving average as a trend filter, effectively tracking market trends. The strategy features adjustable RSI overbought/oversold thresholds and implements a 2500-day lookback period limitation to ensure practicality and stability.
Strategy Principles
The strategy is built on several core components: 1. RSI Configuration: Uses 12-period RSI with 70 and 62 as overbought/oversold thresholds to capture market momentum. 2. Moving Average: Employs 90-day moving average as trend confirmation indicator. 3. Position Management: Automatically calculates position size based on current account equity when long signals appear. 4. Time Window: Implements 2500-day lookback period to ensure strategy operates within a reasonable timeframe.
Buy signals are triggered when RSI crosses above 70, while sell signals generate when RSI drops below 62. The system automatically calculates and executes full position entries when entry conditions are met within the valid lookback period.
Strategy Advantages
- Dynamic Adaptability: Adjustable RSI thresholds allow strategy adaptation to different market conditions
- Robust Risk Control: Dual confirmation using RSI and MA reduces false breakout risks
- Scientific Position Management: Dynamic position sizing based on account equity ensures efficient capital utilization
- Reasonable Time Window: 2500-day lookback period prevents overfitting to historical data
- Visualization Support: Strategy provides real-time visualization of RSI and MA for monitoring and adjustment
Strategy Risks
- Trend Reversal Risk: Potential false breakouts in highly volatile markets
- Parameter Sensitivity: Strategy performance heavily influenced by RSI and MA period selection
- Slippage Impact: Full position trading may face slippage risks in low liquidity conditions
- Lookback Period Limitation: Fixed lookback period might miss certain historical patterns
Risk Control Recommendations: - Dynamically adjust RSI thresholds based on market characteristics - Add stop-loss and take-profit functions to enhance risk management - Consider implementing staged position building to reduce slippage impact - Regularly evaluate parameter effectiveness
Optimization Directions
Signal System Optimization:
- Add more technical indicators for confirmation
- Incorporate volume analysis to enhance signal reliability
Position Management Optimization:
- Implement staged position building and reduction
- Add dynamic stop-loss and take-profit functionality
Risk Control Optimization:
- Introduce volatility adaptive mechanism
- Add market environment analysis module
Backtesting System Optimization:
- Add more backtesting statistics
- Implement automatic parameter optimization
Summary
The strategy constructs a relatively complete trading system by combining RSI momentum indicator with MA trend filter. Its strengths lie in strong adaptability and comprehensive risk control, but attention must be paid to parameter sensitivity and market environment changes. Through the suggested optimization directions, the strategy has significant room for improvement to enhance its stability and profitability further.
/*backtest
start: 2019-12-23 08:00:00
end: 2024-11-11 00:00:00
period: 1d
basePeriod: 1d
exchanges: [{"eid":"Futures_Binance","currency":"BTC_USDT"}]
*/

//@version=5
strategy("Simple RSI Strategy - Adjustable Levels with Lookback Limit and 30-Day MA", overlay=true)

// Parameters
rsi_length = input.int(12, title="RSI Length", minval=1)  // RSI period
rsi_overbought = input.int(70, title="RSI Overbought Level", minval=1, maxval=100)  // Overbought level
rsi_oversold = input.int(62, title="RSI Oversold Level", minval=1, maxval=100)  // Oversold level
ma_length = input.int(90, title="Moving Average Length", minval=1)  // Moving Average period

// Calculate lookback period (2000 days)
lookback_period = 2500
start_date = timestamp(year(timenow), month(timenow), dayofmonth(timenow) - lookback_period)

// RSI Calculation
rsi_value = ta.rsi(close, rsi_length)

// 30-Day Moving Average Calculation
ma_value = ta.sma(close, ma_length)

// Buy Condition: Buy when RSI is above the overbought level
long_condition = rsi_value > rsi_overbought

// Sell Condition: Sell when RSI drops below the oversold level
sell_condition = rsi_value < rsi_oversold

// Check if current time is within the lookback period
in_lookback_period = (time >= start_date)

// Execute Buy with 100% equity if within lookback period
if (long_condition and strategy.position_size == 0 and in_lookback_period)
    strategy.entry("Buy", strategy.long, qty=strategy.equity / close)

if (sell_condition and strategy.position_size > 0)
    strategy.close("Buy")

// Plot RSI on a separate chart for visualization
hline(rsi_overbought, "Overbought", color=color.red)
hline(rsi_oversold, "Oversold", color=color.green)
plot(rsi_value, title="RSI", color=color.blue)

// Plot the 30-Day Moving Average on the chart
plot(ma_value, title="30-Day MA", color=color.orange, linewidth=2)
- Multi-MA Crossover with RSI Dynamic Trailing Stop Loss Quantitative Trading Strategy
- MA, SMA, MA Slope, Trailing Stop Loss, Re-Entry
- Multi-Moving Average Momentum Trend Following Strategy
- Dynamic Support-Resistance Breakout Moving Average Crossover Strategy
- Dual Moving Average RSI Trend Momentum Strategy
- Dual Moving Average-RSI Multi-Signal Trend Trading Strategy
- Multi-Technical Indicator Cross-Trend Tracking Strategy: RSI and Stochastic RSI Synergy Trading System
- Multi-Period Moving Average and RSI Momentum Cross Trend Following Strategy
- Multi-Period Moving Average and RSI Momentum Cross Strategy
- Triple-Validated RSI Mean Reversion with Moving Average Filter Strategy
- Multi-Strategy Adaptive Trend Following and Breakout Trading System
- Multi-Level Moving Average with Candlestick Pattern Recognition Trading System
- Multi-Timeframe EMA Trend Momentum Trading Strategy
- Intelligent Time-Based Long-Short Rotation Balanced Trading Strategy
- Advanced MACD Dynamic Trend Quantitative Trading Strategy
- Trend Breakout Trading System with Moving Average (TBMA Strategy)
- ATR-Based Multi-Trend Following Strategy with Take-Profit and Stop-Loss Optimization System
- RSI Momentum-based Smart Adaptive Trading System with Multi-level Risk Management
- Adaptive RSI Oscillator Dynamic Trading Strategy with Threshold Optimization
- RSI and AO Synergistic Trend Following Quantitative Trading Strategy
- Dual Moving Average Cross RSI Momentum Strategy with Risk-Reward Optimization System
- Multi-Indicator Crossover Dynamic Strategy System: A Quantitative Trading Model Based on EMA, RVI and Trading Signals
- RSI Dynamic Range Reversal Quantitative Strategy with Volatility Optimization Model
- Bollinger Bands Momentum Trend Following Quantitative Strategy
- Multi-Period Technical Analysis and Market Sentiment Trading Strategy
- Dynamic Holding Period Strategy Based on 123 Point Reversal Pattern
- Multi-Technical Indicator Crossover Momentum Quantitative Trading Strategy - Integration Analysis Based on EMA, RSI and ADX
- Parabolic SAR Divergence Trading Strategy
- Combined Momentum SMA Crossover Strategy with Market Sentiment and Resistance Level Optimization System
- Multi-Period RSI Momentum and Triple EMA Trend Following Composite Strategy