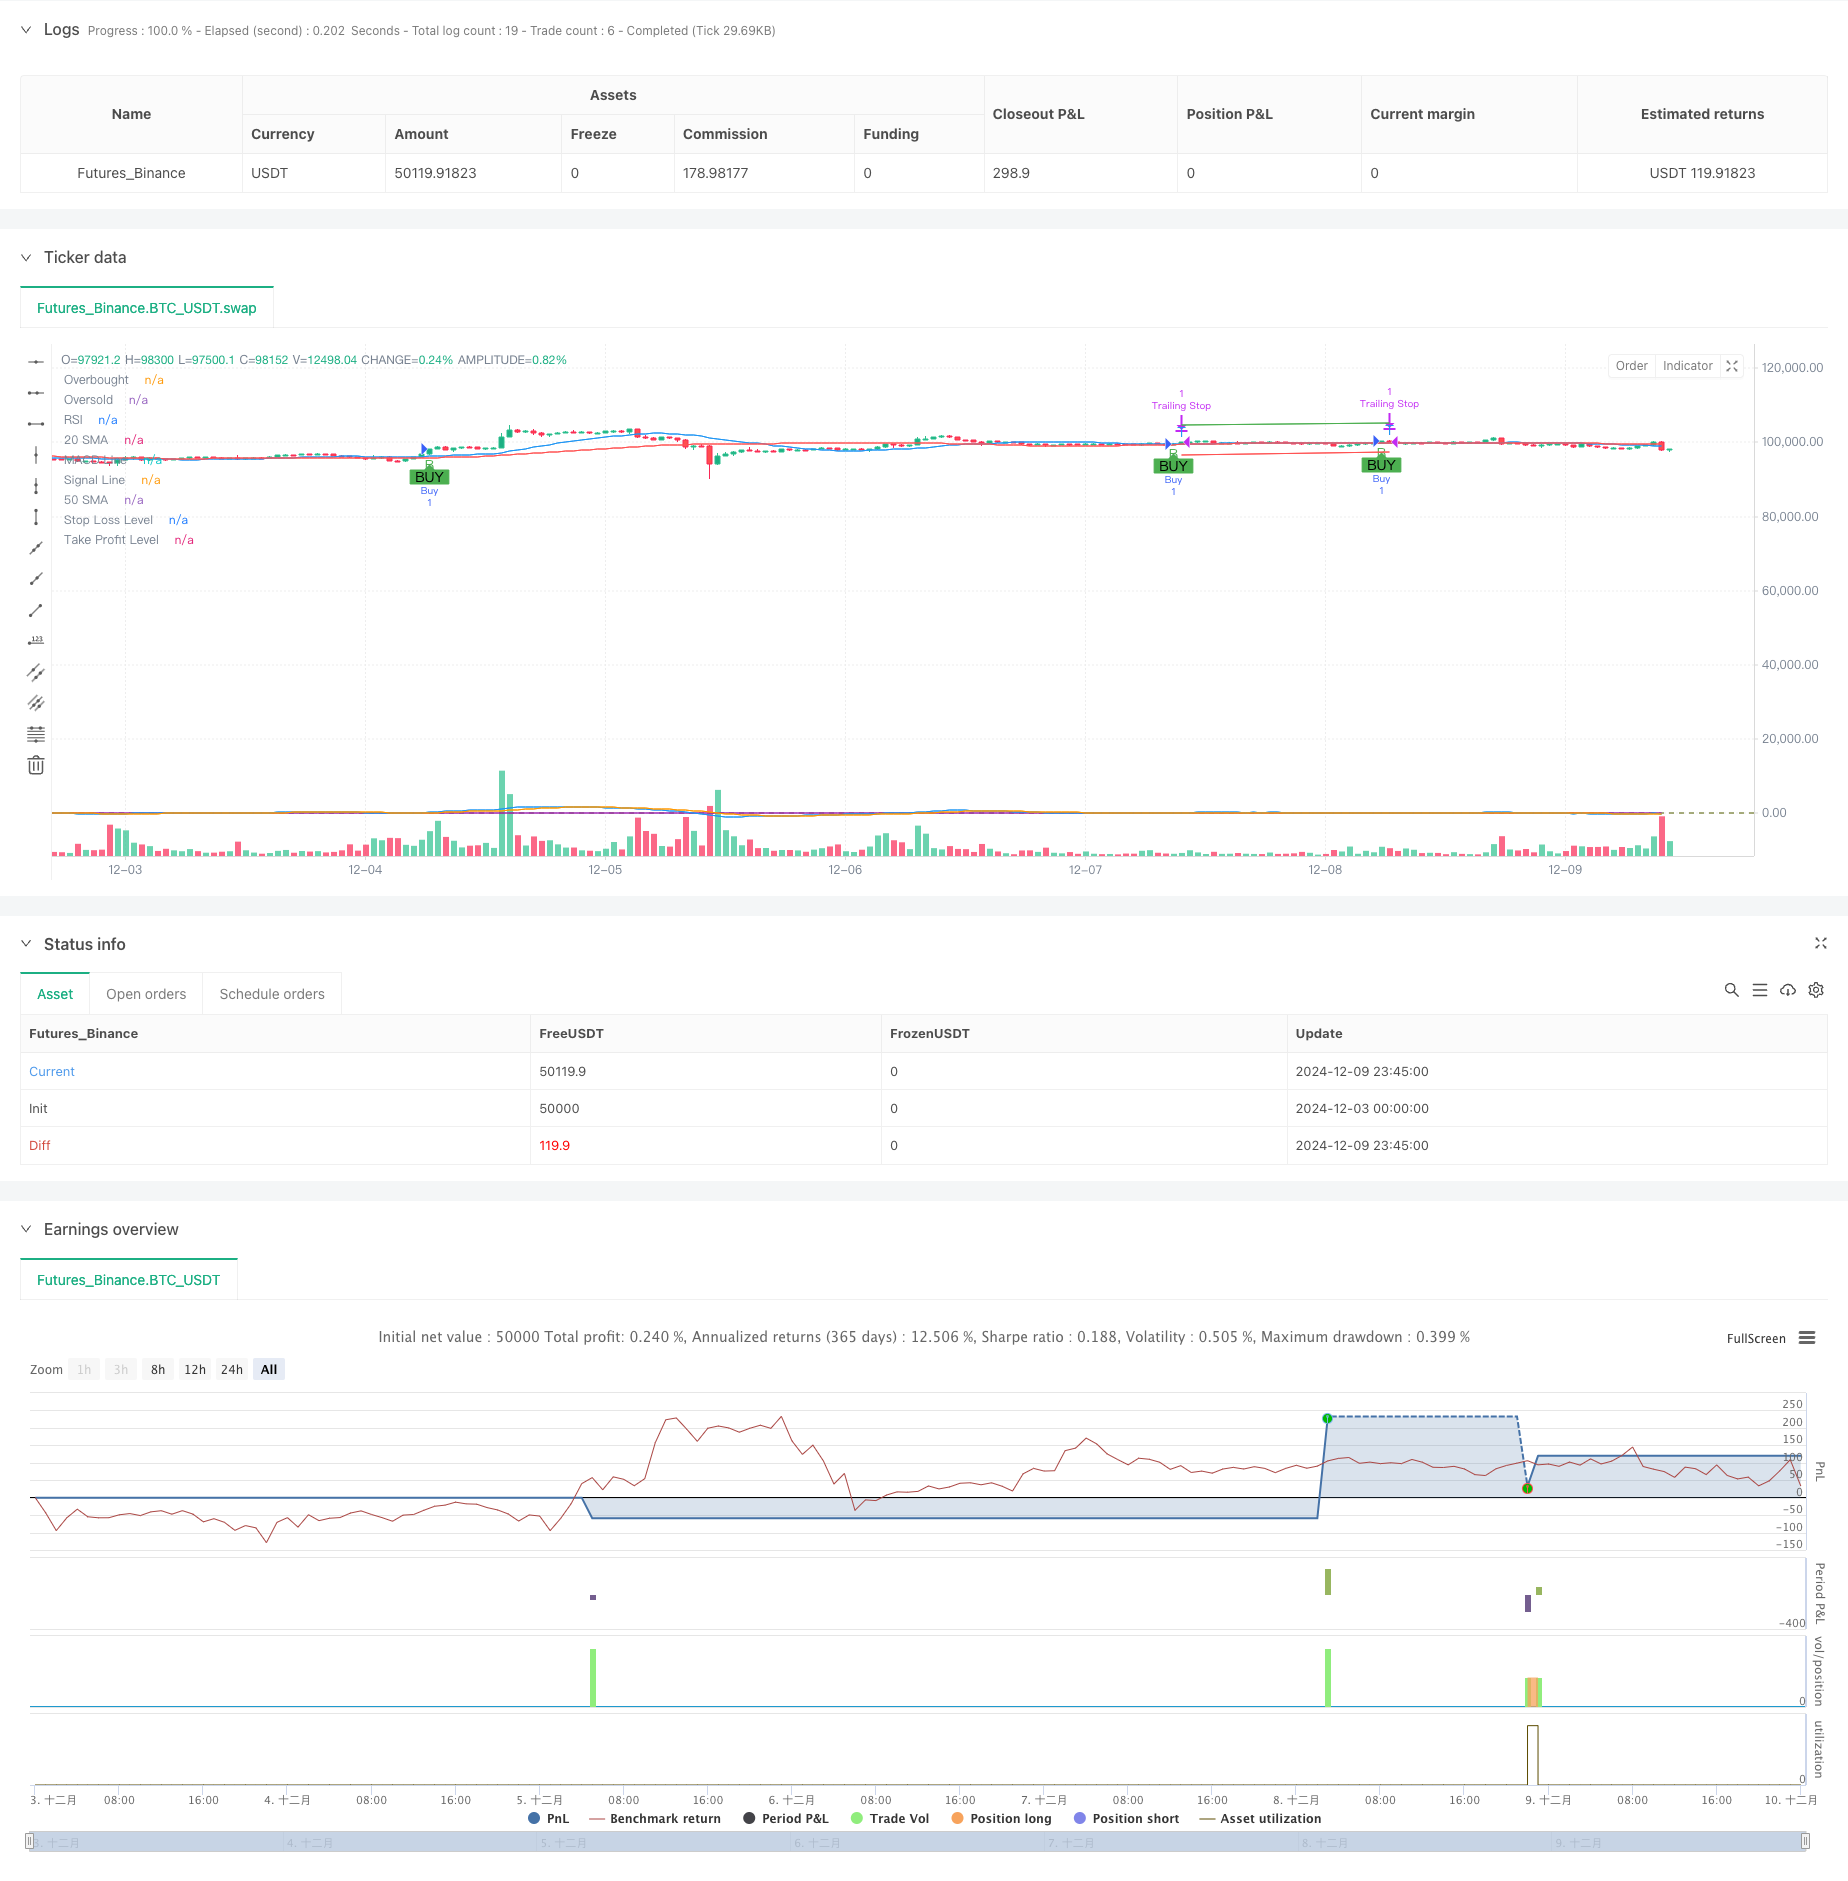
Aperçu
La stratégie est un système de trading de suivi de tendance combinant plusieurs indicateurs techniques. Elle traite les transactions lorsque la tendance du marché est claire en intégrant plusieurs indicateurs techniques tels que le RSI (indicateur de la force relative), le MACD (indicateur de la dispersion de la tendance des moyennes mobiles) et le SMA (indicateur de la moyenne mobile simple). La stratégie comprend également des mécanismes de gestion des risques tels que le stop loss, le stop loss et le suivi des stop losses pour une meilleure gestion des fonds.
Principe de stratégie
La stratégie est basée sur les conditions suivantes:
- L’indicateur MACD présente une fourchette d’or ((ligne de signal sur la ligne MACD)
- RSI inférieur à 70, évitez les zones de surachat
- Le prix est au-dessus de la moyenne à court terme (la moyenne à 20 jours)
- La moyenne à court terme est située au-dessus de la moyenne à long terme (la moyenne à 50 jours)
Lorsque les conditions ci-dessus sont réunies, le système émet plusieurs signaux. De plus, la stratégie a un objectif de stop-loss de 5%, une limite de stop-loss de 3% et un stop-loss de suivi de 2% pour protéger les bénéfices déjà réalisés. Cette conception de conditions de transaction à plusieurs niveaux contribue à améliorer l’exactitude et la sécurité des transactions.
Avantages stratégiques
- L’utilisation intégrée d’indicateurs techniques multiples améliore la fiabilité des signaux de négociation
- Filtrez les zones de survente par le RSI pour éviter d’entrer en position haute
- L’utilisation d’un système linéaire permet de confirmer les tendances à moyen et long terme
- Un mécanisme de gestion des risques adapté, y compris des arrêts fixes et des arrêts de suivi
- Les paramètres de la stratégie peuvent être ajustés de manière flexible pour s’adapter à différentes conditions de marché
- La durée de la transaction est personnalisable pour faciliter le retracement et l’application sur le marché
Risque stratégique
- Les multiples indicateurs peuvent entraîner des retards de signal et affecter le temps d’entrée.
- De faux signaux peuvent survenir sur des marchés volatils
- Un stop loss fixe peut ne pas être adapté à tous les environnements de marché.
- Le suivi des arrêts de perte peut entraîner une sortie prématurée d’une position avantageuse en cas de forte volatilité du marché. Les mesures d’atténuation comprennent: l’ajustement approprié des paramètres des indicateurs, l’ajustement du ratio de stop-loss en fonction des différentes caractéristiques du marché, l’ajout de filtres d’environnement du marché, etc.
Orientation de l’optimisation de la stratégie
- L’introduction d’indicateurs de volatilité (comme l’ATR) qui rendent le stop loss plus adaptable
- Augmentation de l’efficacité des signaux de vérification des indicateurs de trafic
- Ajout d’un mécanisme de jugement de l’environnement du marché, avec différents paramètres dans différentes conditions de marché
- Optimisation des paramètres MACD pour améliorer la rapidité du signal
- Considérer l’ajout d’un signal de recul pour la mise en place d’une fonction de ventilation Ces mesures d’optimisation permettent d’améliorer l’adaptabilité et la stabilité des stratégies.
Résumer
La stratégie a permis d’établir un système de trading relativement parfait grâce à l’utilisation combinée de multiples indicateurs techniques. Elle contient non seulement la logique de base du suivi des tendances, mais intègre également des considérations de gestion des risques. Bien qu’il existe des endroits qui nécessitent une optimisation, le cadre global présente une bonne extensibilité et une bonne adaptabilité.
/*backtest
start: 2024-12-03 00:00:00
end: 2024-12-10 00:00:00
period: 45m
basePeriod: 45m
exchanges: [{"eid":"Futures_Binance","currency":"BTC_USDT"}]
*/

//@version=5
strategy("Flexible Swing Trading Strategy with Trailing Stop and Date Range", overlay=true)

// Input parameters
rsiPeriod = input.int(14, title="RSI Period")
macdFastLength = input.int(12, title="MACD Fast Length")
macdSlowLength = input.int(26, title="MACD Slow Length")
macdSignalSmoothing = input.int(9, title="MACD Signal Smoothing")
smaShortPeriod = input.int(20, title="Short-term SMA Period")
smaLongPeriod = input.int(50, title="Long-term SMA Period")
takeProfitPercent = input.float(5.0, title="Take Profit Percentage")
stopLossPercent = input.float(3.0, title="Stop Loss Percentage")
trailingStopPercent = input.float(2.0, title="Trailing Stop Percentage")

// Date range inputs
startDate = input(timestamp("2023-01-01 00:00"), title="Start Date")
endDate = input(timestamp("2023-12-31 23:59"), title="End Date")

// Calculate RSI
rsi = ta.rsi(close, rsiPeriod)

// Calculate MACD
[macdLine, signalLine, _] = ta.macd(close, macdFastLength, macdSlowLength, macdSignalSmoothing)

// Calculate SMAs
smaShort = ta.sma(close, smaShortPeriod)
smaLong = ta.sma(close, smaLongPeriod)

// Buy condition
buyCondition = ta.crossover(macdLine, signalLine) and rsi < 70 and close > smaShort and smaShort > smaLong

// Execute buy orders within the date range
if (buyCondition )
    strategy.entry("Buy", strategy.long)

// Calculate take profit and stop loss levels
takeProfitLevel = strategy.position_avg_price * (1 + takeProfitPercent / 100)
stopLossLevel = strategy.position_avg_price * (1 - stopLossPercent / 100)

// Set take profit, stop loss, and trailing stop
strategy.exit("Take Profit", "Buy", limit=takeProfitLevel)
strategy.exit("Stop Loss", "Buy", stop=stopLossLevel)
strategy.exit("Trailing Stop", "Buy", trail_price=close * (1 - trailingStopPercent / 100), trail_offset=trailingStopPercent / 100)

// Plot Buy signals
plotshape(series=buyCondition, location=location.belowbar, color=color.green, style=shape.labelup, text="BUY")

// Plot SMAs
plot(smaShort, color=color.blue, title="20 SMA")
plot(smaLong, color=color.red, title="50 SMA")

// Plot MACD and Signal Line
plot(macdLine, color=color.blue, title="MACD Line")
plot(signalLine, color=color.orange, title="Signal Line")

// Plot RSI
hline(70, "Overbought", color=color.red)
hline(30, "Oversold", color=color.green)
plot(rsi, color=color.purple, title="RSI")

// Debugging plots
plotchar(buyCondition , char='B', location=location.belowbar, color=color.green, size=size.small)
plotchar(strategy.opentrades > 0, char='T', location=location.abovebar, color=color.blue, size=size.small)
plot(stopLossLevel, color=color.red, title="Stop Loss Level")
plot(takeProfitLevel, color=color.green, title="Take Profit Level")