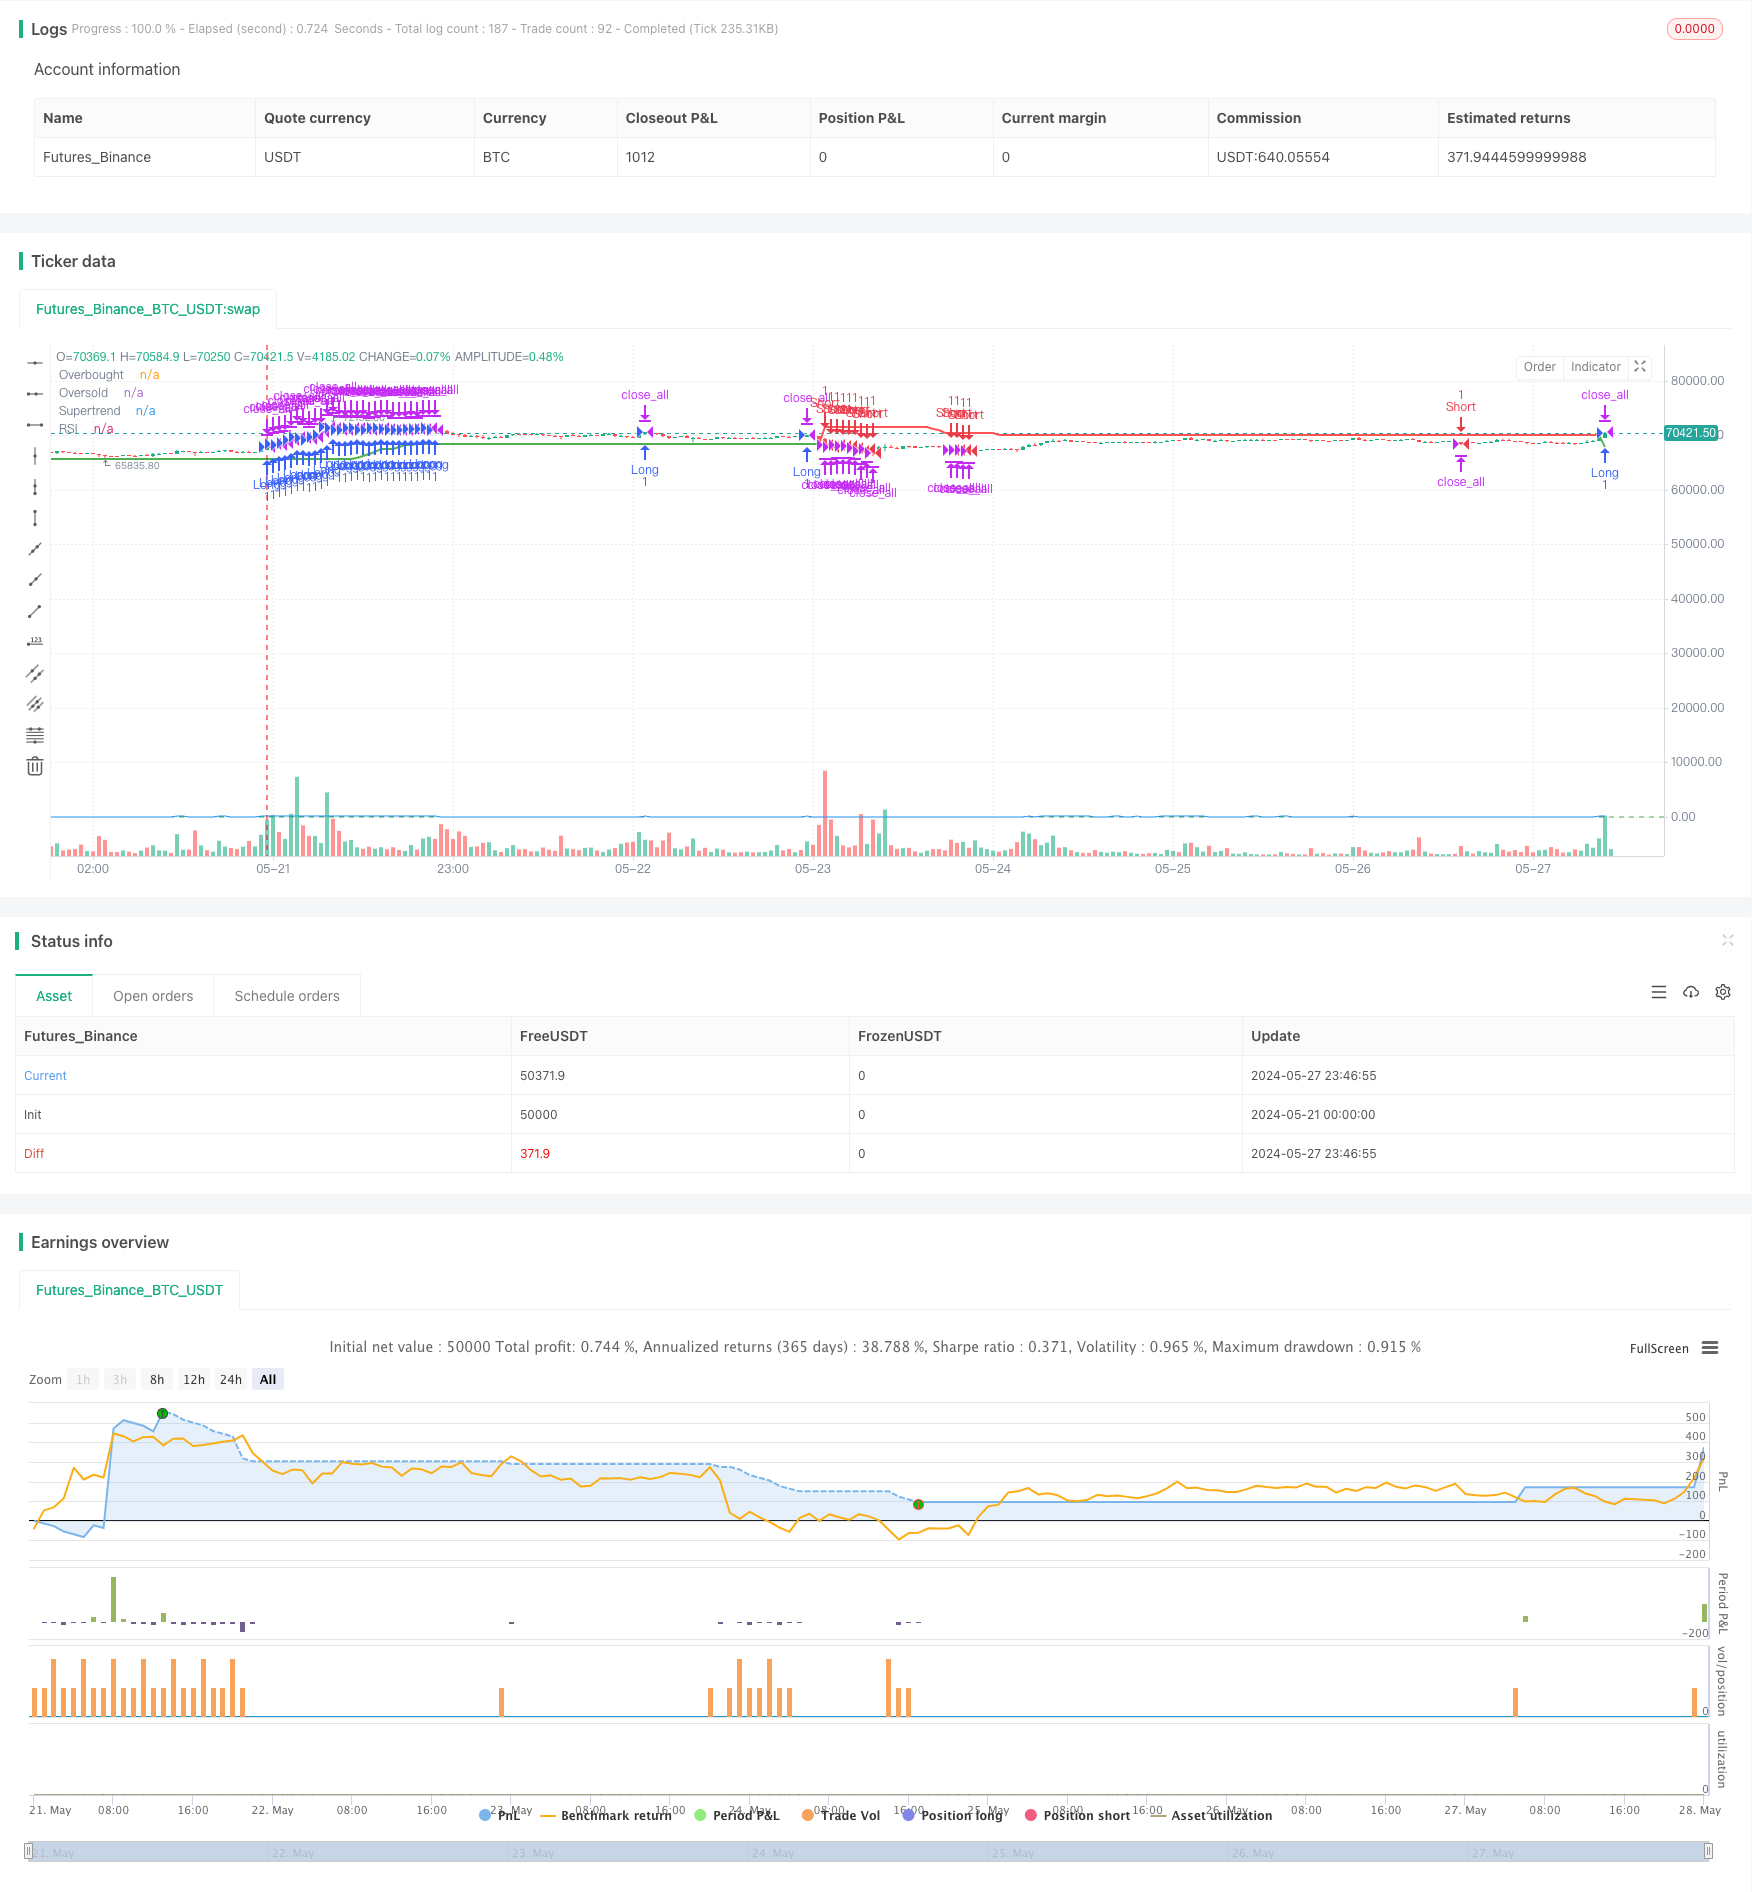
RSI+Supertrend Strategi Trading Mengikuti Tren
Penulis:ChaoZhang, Tanggal: 2024-05-29 17:28:06Tag:RSI

Gambaran umum
Strategi ini menggabungkan Indeks Kekuatan Relatif (RSI) dan indikator teknis Supertrend untuk menangkap tren pasar dan mengidentifikasi peluang perdagangan potensial. Ide utama di balik strategi ini adalah menggunakan RSI untuk menentukan kondisi pasar overbought dan oversold sambil menggunakan indikator Supertrend untuk mengkonfirmasi arah tren. Ketika kedua indikator RSI dan Supertrend memenuhi kondisi tertentu secara bersamaan, strategi menghasilkan sinyal beli atau jual.
Prinsip Strategi
- Menghitung nilai indikator RSI dan Supertrend.
- Ketika RSI melintasi di atas 58 dan indikator Supertrend menunjukkan warna hijau, menghasilkan sinyal beli dan membuka posisi panjang.
- Ketika RSI melintasi di bawah 50 dan indikator Supertrend berubah menjadi merah, tutup posisi panjang.
- Ketika RSI melintasi di bawah 38 dan indikator Supertrend menunjukkan warna merah, menghasilkan sinyal jual dan membuka posisi short.
- Ketika RSI melintasi di atas 45 dan indikator Supertrend berubah menjadi hijau, tutup posisi pendek.
Analisis Keuntungan
- Menggabungkan indikator momentum (RSI) dan indikator tren (Supertrend), secara efektif menangkap tren pasar.
- RSI membantu mengidentifikasi kondisi pasar yang terlalu banyak dibeli dan terlalu banyak dijual, menghindari perdagangan dalam situasi ekstrem.
- Indikator Supertrend memberikan sinyal arah tren yang jelas, membantu dalam membuat keputusan perdagangan yang benar.
- Logika strategi jelas dan mudah dipahami dan diterapkan.
Analisis Risiko
- Dalam pasar yang berosilasi, sinyal perdagangan yang sering dapat menyebabkan frekuensi perdagangan dan biaya transaksi yang berlebihan.
- Indikator RSI dan Supertrend dapat menghasilkan sinyal yang bertentangan, mengurangi efektivitas strategi.
- Strategi ini didasarkan pada pengaturan parameter tetap, yang mungkin tidak beradaptasi dengan lingkungan pasar yang berbeda.
Arahan Optimasi
- Pertimbangkan untuk memasukkan indikator teknis lainnya, seperti rata-rata bergerak, untuk meningkatkan keandalan strategi.
- Mengoptimalkan parameter RSI dan Supertrend untuk beradaptasi dengan kondisi pasar yang berbeda.
- Menerapkan langkah-langkah manajemen risiko, seperti stop-loss dan ukuran posisi, untuk mengendalikan potensi kerugian.
- Backtest dan memantau strategi secara real-time, menyesuaikan parameter strategi sesuai kebutuhan.
Ringkasan
RSI+Supertrend Trend-Following Trading Strategy secara efektif menangkap tren pasar dan menghasilkan sinyal perdagangan dengan menggabungkan indikator teknis RSI dan Supertrend. Keuntungan strategi terletak pada logika yang jelas, kemudahan implementasi, dan pertimbangan momentum dan faktor tren. Namun, strategi ini juga memiliki beberapa risiko, seperti perdagangan yang sering dan keterbatasan dalam pengaturan parameter. Untuk meningkatkan kinerja strategi, seseorang dapat mempertimbangkan memperkenalkan indikator lain, mengoptimalkan parameter, memperkuat langkah-langkah manajemen risiko, dan terus memantau dan menyesuaikan strategi.
/*backtest
start: 2024-05-21 00:00:00
end: 2024-05-28 00:00:00
period: 45m
basePeriod: 5m
exchanges: [{"eid":"Futures_Binance","currency":"BTC_USDT"}]
*/

//@version=5
strategy("RSI + Supertrend Strategy", overlay=true)

// Input parameters
rsiLength = input.int(14, title="RSI Length")
rsiOverbought = input.int(58, title="RSI Overbought Level")
rsiOversold = input.int(38, title="RSI Oversold Level")

supertrendLength = input.int(10, title="Supertrend Length")
supertrendMultiplier = input.int(3, title="Supertrend Multiplier")

// Calculate indicators
rsiValue = ta.rsi(close, rsiLength)

[supertrend, _] = ta.supertrend(supertrendLength, supertrendMultiplier)

// Plot Supertrend on main chart
plot(supertrend, color = supertrend < close ? color.green : color.red, linewidth = 2, title="Supertrend")

// Plot RSI
hline(rsiOverbought, "Overbought", color.red)
hline(rsiOversold, "Oversold", color.green)
plot(rsiValue, title="RSI", color=color.blue)

// Strategy
var float entryPrice = na

// Long conditions
longCondition = (rsiValue > rsiOverbought) and (supertrend < close)

// Short conditions
shortCondition = (rsiValue < rsiOversold) and (supertrend > close)

// Exit conditions
longExitCondition = (rsiValue < 50) and (supertrend > close)
shortExitCondition = (rsiValue > 45) and (supertrend < close)

// Execute strategy
if (longCondition)
    strategy.entry("Long", strategy.long)
    entryPrice := close

if (shortCondition)
    strategy.entry("Short", strategy.short)
    entryPrice := close

if (longExitCondition and strategy.position_size > 0)
    strategy.close("Long")

if (shortExitCondition and strategy.position_size < 0)
    strategy.close("Short")

// Date and time range for backtest
startDate = timestamp("2023-01-01 00:00")
endDate = timestamp("2024-01-01 00:00")
if (time < startDate or time > endDate)
    strategy.close_all()
- Strategi pembalikan rata-rata yang ditingkatkan dengan Bollinger Bands dan Integrasi RSI
- Divergensi RSI Multi-Periode dengan Strategi Perdagangan Kuantitatif Dukungan/Resistensi
- Adaptive Trend Following Strategy dengan Sistem Pengendalian Penarikan Dinamis
- Multi-Technical Indicator Cross-Trend Tracking Strategy: RSI dan Stochastic RSI Synergy Trading System
- MACD-RSI Crossover Trend Mengikuti Strategi dengan Sistem Optimasi Bollinger Bands
- Strategi Optimasi Perdagangan Dinamis Multi-Indikator
- Strategi Trading Tren Stop-Loss Dinamis Multi-Indicator
- Strategi Trading Rata-rata Bergerak Cerdas Penembusan Tren Multi-Filter
- Strategi Optimasi Momentum Tren Dinamis dengan Indikator G-Channel
- Tren Multi-Indikator Mengikuti Opsi Trading EMA Cross Strategy
- Strategi Trading Volatilitas Multi-Indikator RSI-EMA-ATR
- Dual Moving Average Crossover Stop Loss dan Take Profit Strategi
- Strategi TEMA Dual Moving Average Crossover
- Trend SMA Multi-Timeframe Mengikuti Strategi dengan Stop Loss Dinamis
- Bollinger Bands Akurat Entry Dan Strategi Pengendalian Risiko
- Bollinger Bands + RSI + Strategi RSI Stochastic Berdasarkan Indikator Volatilitas dan Momentum
- Turtle-ATR Bollinger Bands Breakout Strategi
- VWAP dan Super Trend Strategi Beli/Jual
- Strategi MACD Lanjutan dengan Martingale Terbatas
- Keltner Channels EMA Strategi ATR
- MA MACD BB Multi-Indikator Trading Strategy Backtesting Tool
- Ichimoku Kumo Strategi Perdagangan
- Strategi Crossover Rata-rata Gerak Dinamis ATR Stop Loss and Take Profit
- EMA Trend Momentum Candlestick Pattern Strategi
- Strategi Deteksi Tren G-Channel
- Moving Average Crossover dengan Strategi Stop Loss Trailing
- EMA Crossover Trading Strategy dengan Dynamic Take Profit dan Stop Loss
- Bollinger Bands dan EMA Trend Mengikuti Strategi
- Strategi Divergensi Osilator WaveTrend
- Strategi Optimisasi Rezim Pasar Jangka Pendek Berbasis Volatilitas dan Regresi Linear
- Strategi Kuantitatif Z-Score Binomial Hibrida