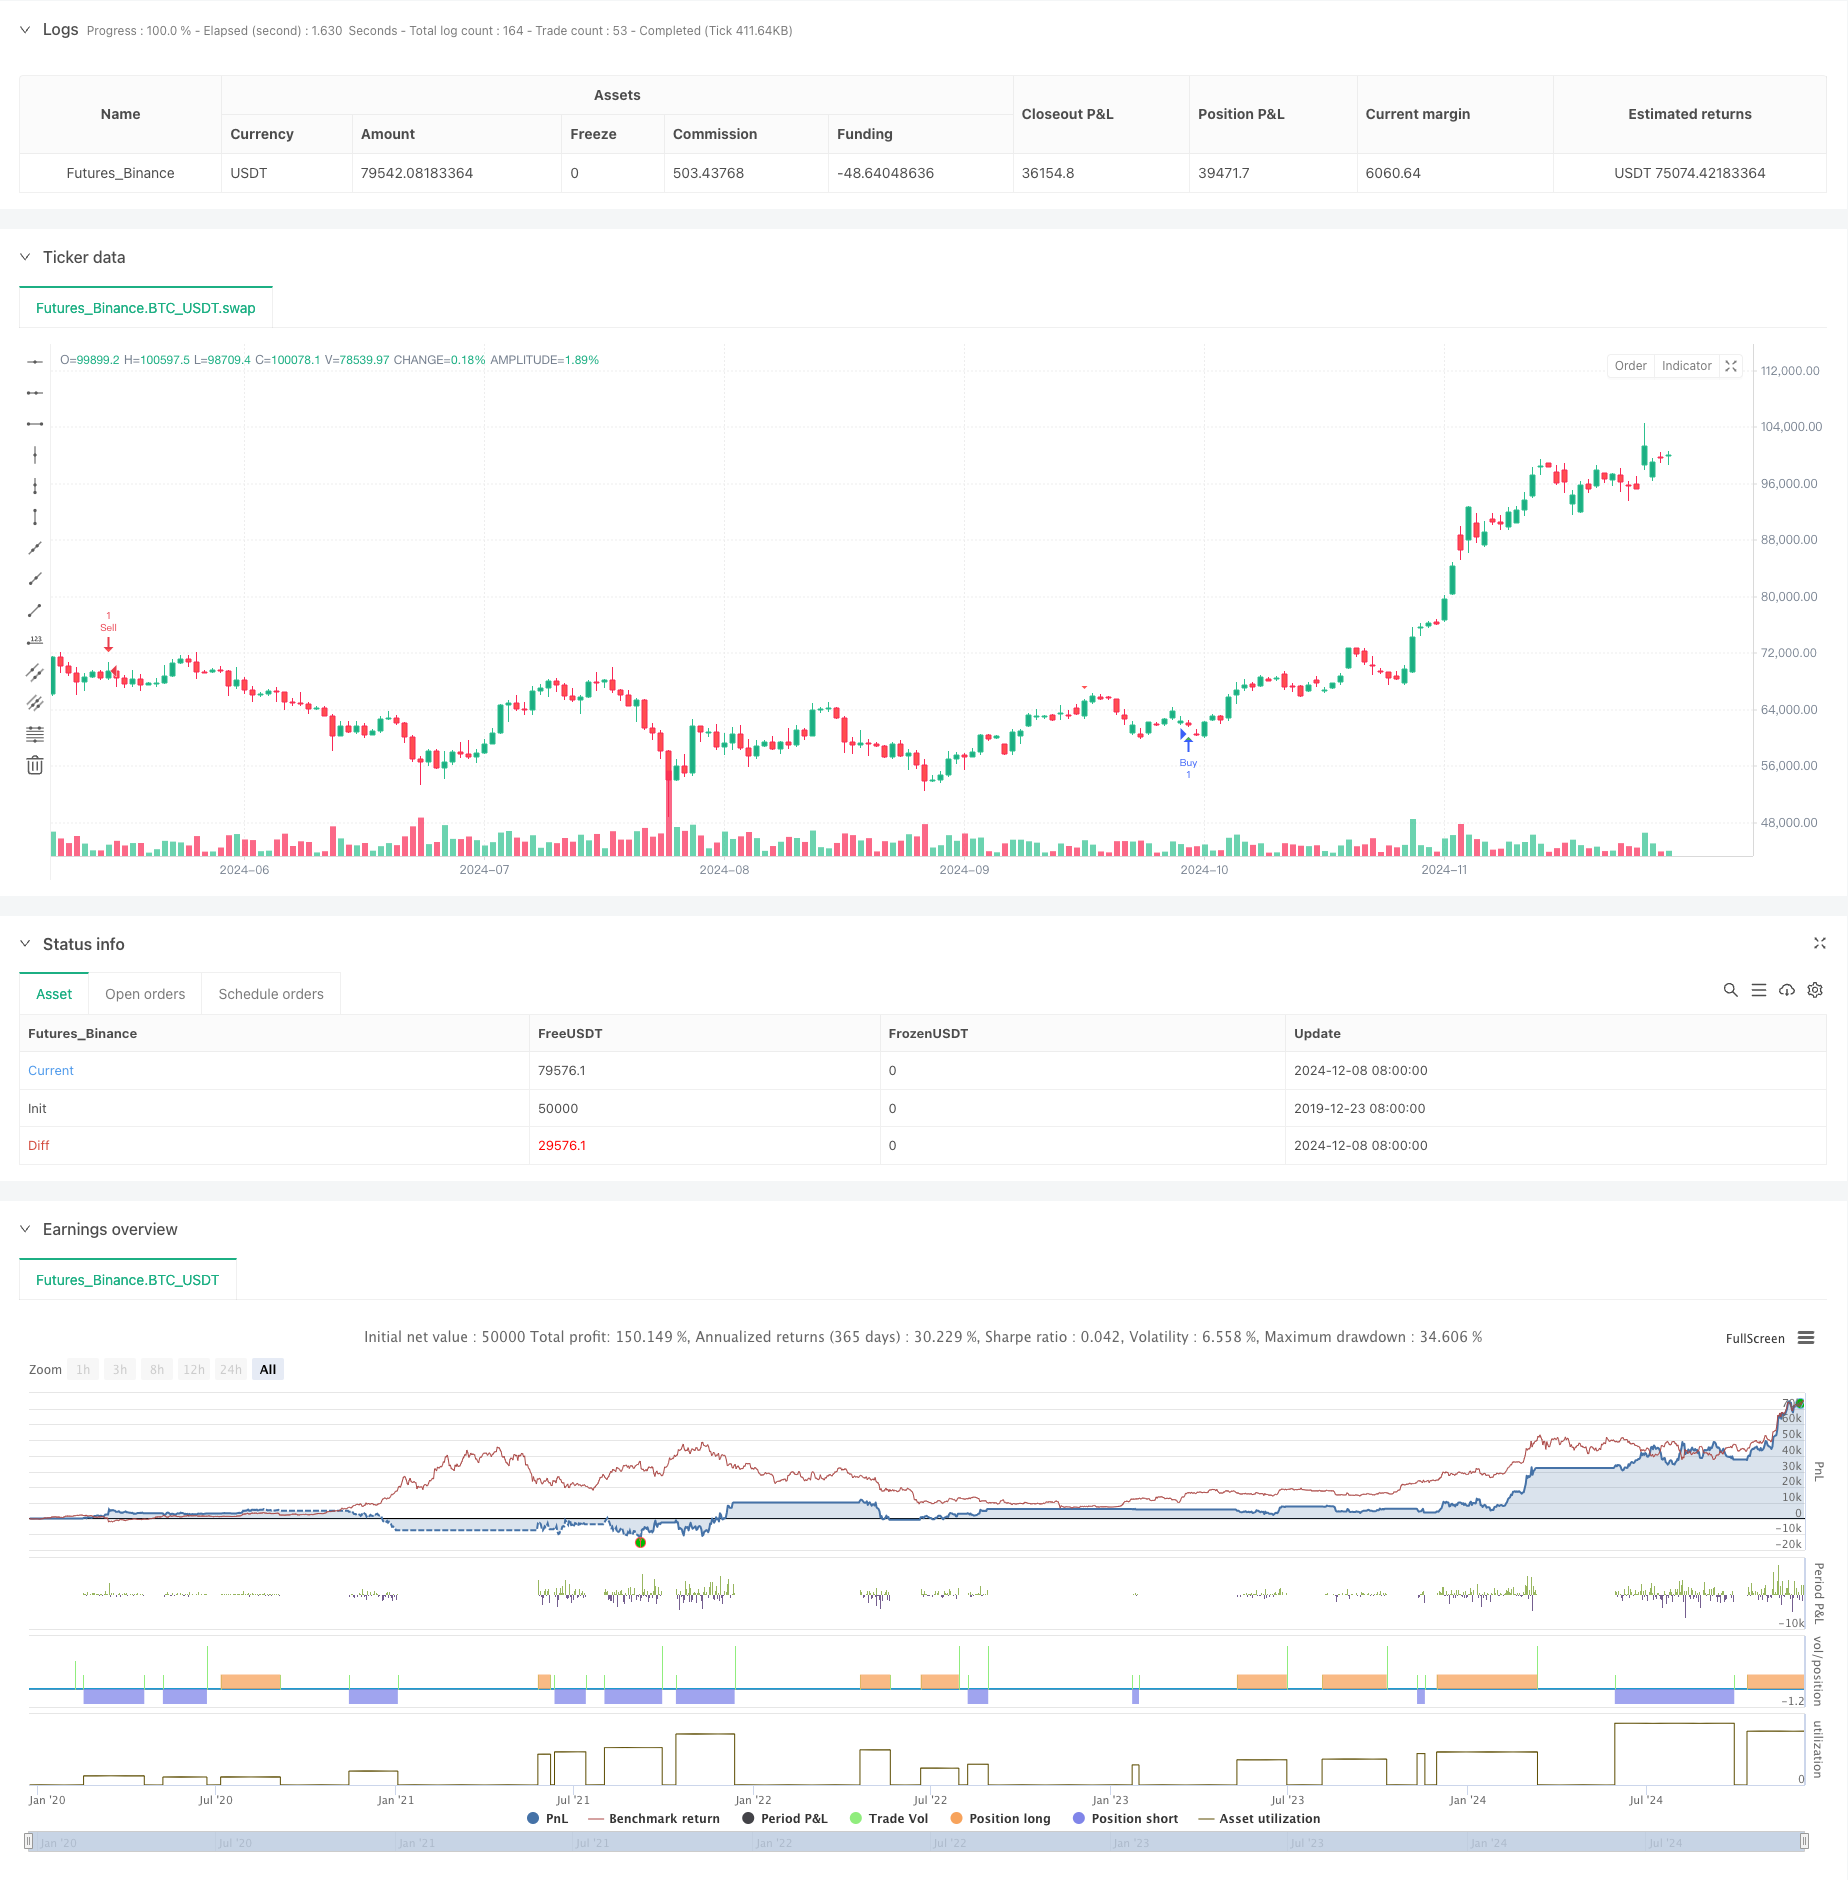
Strategi Perdagangan Kuantitatif Osilator Momentum dan Divergensi Stochastic yang Ditingkatkan
Penulis:ChaoZhang, Tanggal: 2024-12-11 17:34:01Tag:ACRSISMASTOCHTPSLAODIV

Gambaran umum
Strategi ini adalah sistem perdagangan kuantitatif yang menggabungkan indikator Akselerator Oscillator (AC) dan Stochastic. Strategi ini menangkap pergeseran momentum pasar dengan mengidentifikasi perbedaan antara indikator harga dan teknis untuk memprediksi potensi pembalikan tren. Strategi ini juga menggabungkan Rata-rata Bergerak Sederhana (SMA) dan Indeks Kekuatan Relatif (RSI) untuk meningkatkan keandalan sinyal, dengan tingkat mengambil keuntungan dan stop-loss tetap untuk pengendalian risiko.
Prinsip Strategi
Logika inti didasarkan pada sinergi dari beberapa indikator teknis. AC dihitung dengan menggunakan perbedaan antara SMA 5 periode dan 34 periode dari titik tengah harga, dikurangi rata-rata bergerak N-periode. Nilai K dan D stokastis dihitung untuk mengkonfirmasi sinyal divergensi. divergensi bullish terbentuk ketika harga membuat level terendah baru sementara AC naik; divergensi bearish terbentuk ketika harga membuat level tertinggi baru sementara AC turun. RSI dimasukkan sebagai indikator konfirmasi tambahan, menggunakan validasi silang dari beberapa indikator untuk meningkatkan akurasi sinyal.
Keuntungan Strategi
- Sinergi beberapa indikator: Efektif menyaring sinyal palsu melalui kombinasi AC, Stochastic, dan RSI
- Pengendalian risiko otomatis: Pengaturan take profit dan stop-loss yang terintegrasi secara efektif mengendalikan risiko per perdagangan
- Tanda visual: sinyal beli dan jual yang jelas ditandai pada grafik untuk identifikasi peluang yang cepat
- Fleksibilitas yang tinggi: penyesuaian parameter yang kuat yang cocok untuk kondisi pasar dan kerangka waktu yang berbeda
- Peringatan real-time: Sistem peringatan terintegrasi memastikan tidak ada peluang perdagangan yang dilewatkan
Risiko Strategi
- Risiko pecah palsu: Dapat menghasilkan sinyal divergensi palsu di pasar yang berbeda
- Risiko slippage: Fixed pip take profit dan stop loss dapat menghadapi slippage yang signifikan di pasar yang volatile
- Sensitivitas parameter: Kombinasi parameter yang berbeda dapat menyebabkan kinerja strategi yang berbeda
- Ketergantungan pada lingkungan pasar: Strategi dapat berkinerja buruk di pasar tanpa tren yang jelas
- Lag sinyal: Beberapa lag mungkin ada karena perhitungan rata-rata bergerak
Arah Optimasi Strategi
- Pendapatan yang tidak dapat diukur
- Integrasi indikator volume: Meningkatkan keandalan sinyal melalui konfirmasi volume
- Penyaringan lingkungan pasar: Tambahkan modul penilaian tren untuk kondisi pasar yang berbeda
- Optimasi parameter: Gunakan metode pembelajaran mesin untuk mengoptimalkan kombinasi parameter indikator
- Penyaringan waktu: Pertimbangkan karakteristik waktu pasar untuk menghindari periode perdagangan yang tidak menguntungkan
Ringkasan
Ini adalah strategi perdagangan kuantitatif yang mengintegrasikan beberapa indikator teknis, menangkap titik balik pasar melalui sinyal divergensi. Kekuatannya terletak pada validasi silang dari beberapa indikator dan sistem pengendalian risiko yang komprehensif, sementara perhatian harus diberikan pada kegagalan palsu dan optimasi parameter. Melalui optimalisasi dan perbaikan terus-menerus, strategi menunjukkan janji untuk mempertahankan kinerja yang stabil di berbagai lingkungan pasar.
/*backtest
start: 2019-12-23 08:00:00
end: 2024-12-09 08:00:00
period: 1d
basePeriod: 1d
exchanges: [{"eid":"Futures_Binance","currency":"BTC_USDT"}]
*/

// This Pine Script™ code is subject to the terms of the Mozilla Public License 2.0 at https://mozilla.org/MPL/2.0/
// © JayQwae


//@version=5
strategy("Enhanced AC Divergence Strategy with Stochastic Divergence", overlay=true)

// Input settings
tp_pips = input.float(0.0020, "Take Profit (in price)", step=0.0001)
sl_pips = input.float(0.0040, "Stop Loss (in price)", step=0.0001)  // 40 pips
ac_length = input.int(5, "AC Length")
rsi_length = input.int(14, "RSI Length")
stoch_k = input.int(14, "Stochastic K Length")
stoch_d = input.int(3, "Stochastic D Smoothing")
stoch_ob = input.float(80, "Stochastic Overbought Level")
stoch_os = input.float(20, "Stochastic Oversold Level")

// Accelerator Oscillator Calculation
high_low_mid = (high + low) / 2
ao = ta.sma(high_low_mid, 5) - ta.sma(high_low_mid, 34)
ac = ao - ta.sma(ao, ac_length)

// RSI Calculation
rsi = ta.rsi(close, rsi_length)

// Stochastic Oscillator Calculation
k = ta.sma(ta.stoch(close, high, low, stoch_k), stoch_d)
d = ta.sma(k, stoch_d)

// Stochastic Divergence Detection
stoch_bull_div = ta.lowest(close, 5) < ta.lowest(close[1], 5) and ta.lowest(k, 5) > ta.lowest(k[1], 5)
stoch_bear_div = ta.highest(close, 5) > ta.highest(close[1], 5) and ta.highest(k, 5) < ta.highest(k[1], 5)

// Main Divergence Detection
bullish_div = ta.lowest(close, 5) < ta.lowest(close[1], 5) and ac > ac[1] and stoch_bull_div
bearish_div = ta.highest(close, 5) > ta.highest(close[1], 5) and ac < ac[1] and stoch_bear_div

// Plot divergences
plotshape(bullish_div, title="Bullish Divergence", location=location.belowbar, color=color.green, style=shape.triangleup, size=size.small)
plotshape(bearish_div, title="Bearish Divergence", location=location.abovebar, color=color.red, style=shape.triangledown, size=size.small)

// Strategy rules
if (bullish_div)
    strategy.entry("Buy", strategy.long)
    strategy.exit("Take Profit/Stop Loss", "Buy", limit=close + tp_pips, stop=close - sl_pips)

if (bearish_div)
    strategy.entry("Sell", strategy.short)
    strategy.exit("Take Profit/Stop Loss", "Sell", limit=close - tp_pips, stop=close + sl_pips)

// Alerts
if (bullish_div)
    alert("Bullish Divergence detected! Potential Buy Opportunity", alert.freq_once_per_bar)

if (bearish_div)
    alert("Bearish Divergence detected! Potential Sell Opportunity", alert.freq_once_per_bar)
- RSI dan AO Synergistic Trend Setelah Strategi Perdagangan Kuantitatif
- Strategi Perdagangan Volume Momentum Multi-Target yang Cerdas
- Trend Rata-rata Bergerak Ganda Mengikuti Strategi dengan RSI Filter
- Moving Average Crossover dengan RSI Trend Momentum Tracking Strategy
- Opsi sinergi RSI-Rata-rata bergerak ganda Strategi perdagangan kuantitatif
- Tren Mengikuti RSI dan Moving Average Combined Quantitative Trading Strategy
- OBV-SMA Crossover dengan RSI Filter Strategi Perdagangan Momentum Multidimensional
- Strategi Perdagangan Dinamis Multi-Indikator
- Strategi kuantitatif rebound over-sold RSI stop-loss ATR dinamis
- Smooth Moving Average Stop Loss & Take Profit Strategy dengan Trend Filter dan Exception Exit
- Tren Mengikuti Strategi Pengukuran Posisi Garis Dinamis
- Dual BBI (Bulls and Bears Index) Strategi Crossover
- Strategi perdagangan swing panjang/pendek yang dinamis dengan sistem sinyal crossover rata-rata bergerak
- Trend Indikator Multi-Teknis Mengikuti Strategi Perdagangan
- Strategi Trading Revolusi Volatilitas Mean Advanced: Sistem Trading Kuantitatif Multidimensional Berdasarkan VIX dan Moving Average
- Strategi Momentum Pembalikan Saluran Tren Emas
- Strategi Perdagangan Tren Momentum EMA Lanjutan
- Strategi Trading Intensitas Tren Multi-MA - Sistem Trading Pintar Fleksibel Berdasarkan Penyimpangan MA
- Sistem Deteksi Tren Dual Volume-Weighted
- Strategi perdagangan kontra-tren multi-faktor
- Retracement Fibonacci Multi-Timeframe dengan Strategi Trading Trend Breakout
- Tren Multi-Indikator Mengikuti Strategi dengan Optimasi Keuntungan
- Strategi Perdagangan Momentum Breakout Fraktal dengan Optimasi Keuntungan
- Adaptive Mean-Reversion Trading Strategy Berdasarkan Chande Momentum Oscillator
- MACD-Supertrend Tren Konfirmasi Ganda Mengikuti Strategi Perdagangan
- Strategi Perdagangan Dinamis SuperTrend Multi-Periode
- Multi-Timeframe EMA dengan Fibonacci Retracement dan Pivot Points Trading Strategy
- Strategi perdagangan EMA-Squeeze Stop-Loss Dinamis Multi-Timeframe
- MACD dan Strategi Perdagangan Cerdas Sinyal Ganda Regresi Linear
- Tren Multi-EMA Mengikuti Strategi Perdagangan