Trend Indikator Multi-Teknis Mengikuti Strategi Perdagangan
Penulis:ChaoZhang, Tanggal: 2024-12-12 11:00:01Tag:RSIMACDSMATPSLTS

Gambaran umum
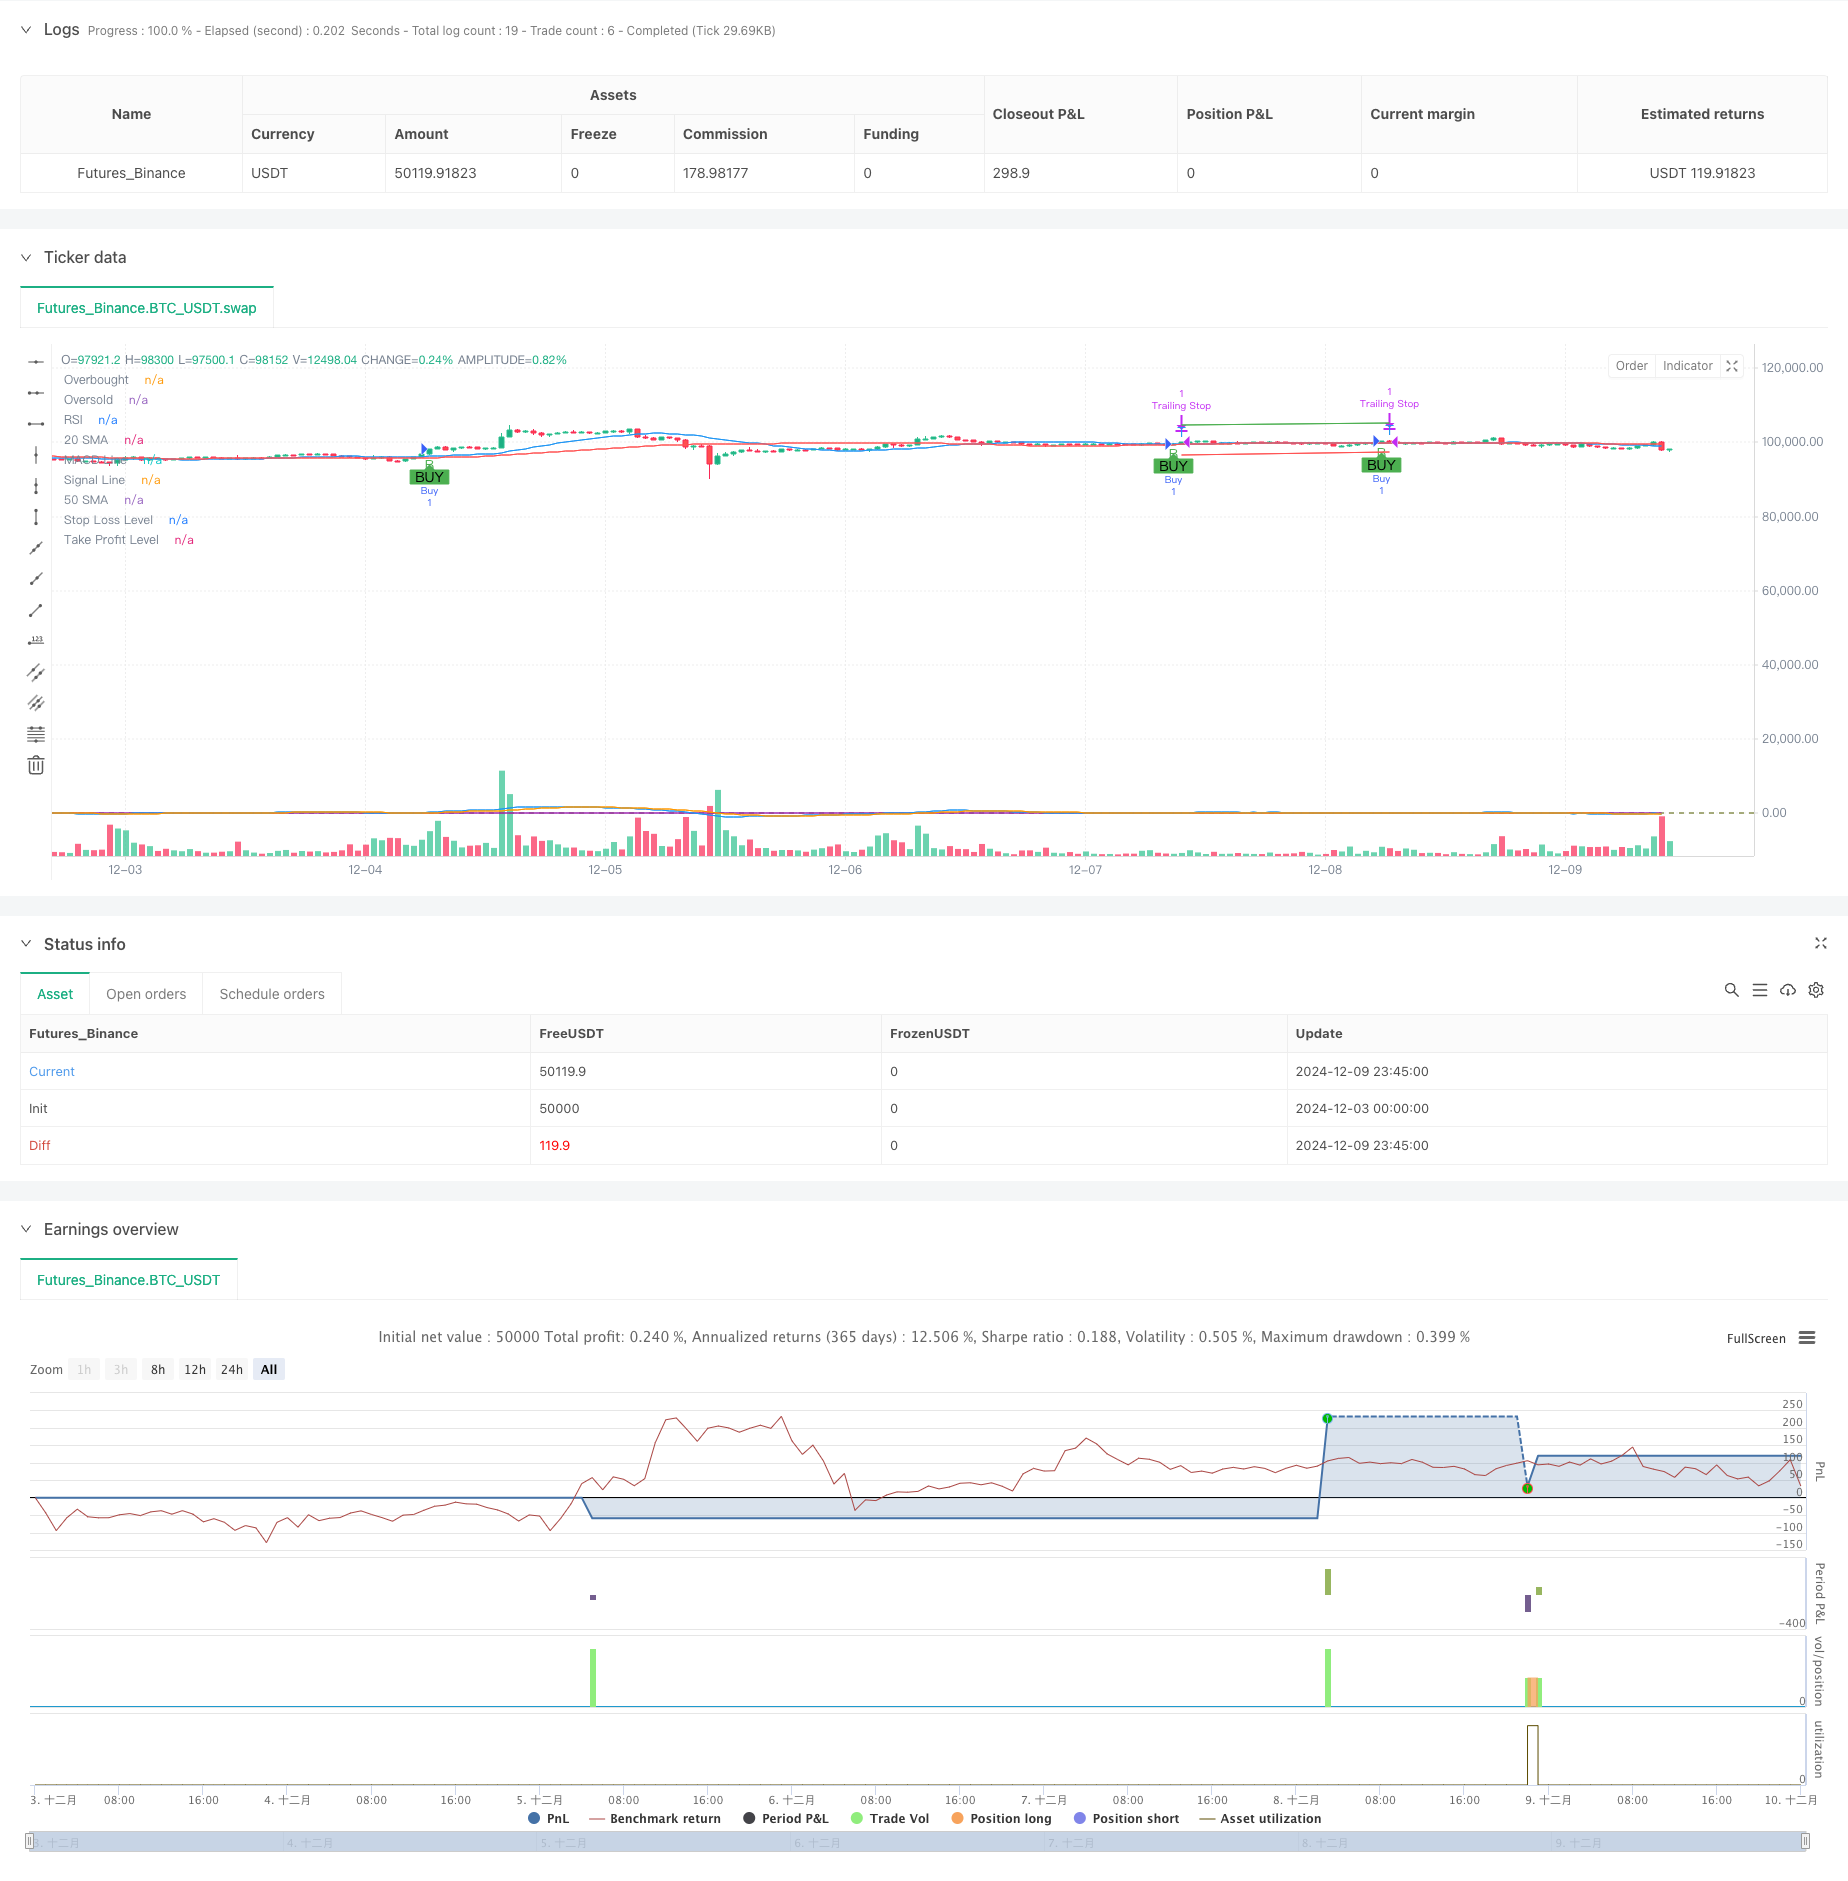
Strategi ini adalah sistem perdagangan trend-mengikuti yang menggabungkan beberapa indikator teknis. Ini mengintegrasikan RSI (Relative Strength Index), MACD (Moving Average Convergence Divergence), dan SMA (Simple Moving Average) untuk mengeksekusi perdagangan ketika tren pasar didefinisikan dengan jelas. Strategi ini juga menggabungkan mengambil keuntungan, stop loss, dan trailing stop mekanisme untuk manajemen risiko yang lebih baik.
Prinsip Strategi
Strategi mengeksekusi perdagangan berdasarkan kondisi inti berikut: 1. MACD menunjukkan salib emas (garis MACD melintasi di atas garis sinyal) 2. RSI di bawah 70, menghindari wilayah overbought Harga berada di atas rata-rata bergerak jangka pendek (20 hari SMA) Rata-rata bergerak jangka pendek berada di atas rata-rata bergerak jangka panjang (50 hari SMA)
Ketika semua kondisi ini terpenuhi secara bersamaan, sistem menghasilkan sinyal panjang. Selain itu, strategi menetapkan target keuntungan 5%, batas stop loss 3%, dan stop trailing 2% untuk melindungi keuntungan yang terkumpul. Pendekatan multi-layer untuk kondisi perdagangan ini membantu meningkatkan akurasi dan keamanan.
Keuntungan Strategi
- Integrasi beberapa indikator teknis meningkatkan keandalan sinyal
- Penyaringan RSI mencegah masuk ke area overbought
- Sistem rata-rata bergerak membantu mengkonfirmasi tren jangka menengah hingga panjang
- Sistem manajemen risiko yang komprehensif termasuk stop tetap dan trailing
- Penyesuaian parameter yang fleksibel untuk kondisi pasar yang berbeda
- Rentang tanggal yang dapat disesuaikan untuk backtesting dan perdagangan langsung
Risiko Strategi
- Beberapa indikator dapat menyebabkan sinyal tertunda
- Sinyal palsu mungkin terjadi di pasar yang berbeda
- Tingkat fixed take profit dan stop loss mungkin tidak sesuai dengan semua kondisi pasar
- Trailing stop mungkin keluar dari perdagangan yang menguntungkan terlalu awal di pasar yang volatile Langkah-langkah mitigasi meliputi: penyesuaian parameter indikator, penyesuaian rasio laba/rugi dengan karakteristik pasar, dan penambahan filter lingkungan pasar.
Arahan Optimasi
- Menggabungkan indikator volatilitas (seperti ATR) untuk tingkat laba/rugi adaptif
- Tambahkan indikator volume untuk memvalidasi kekuatan sinyal
- Melakukan analisis kondisi pasar untuk penyesuaian parameter
- Mengoptimalkan parameter MACD untuk sinyal yang lebih tepat waktu
- Pertimbangkan untuk menambahkan sinyal pembalikan untuk posisi pendek Optimalisasi ini akan meningkatkan kemampuan dan stabilitas strategi.
Ringkasan
Strategi ini menetapkan sistem perdagangan yang komprehensif melalui kombinasi beberapa indikator teknis. Ini mencakup kedua logika mengikuti tren dan pertimbangan manajemen risiko. Meskipun ada bidang untuk optimasi, kerangka kerja keseluruhan memberikan skalabilitas dan kemampuan beradaptasi yang baik. Implementasi yang sukses mengharuskan pedagang untuk mengoptimalkan parameter dan meningkatkan strategi berdasarkan kondisi pasar yang sebenarnya.
/*backtest
start: 2024-12-03 00:00:00
end: 2024-12-10 00:00:00
period: 45m
basePeriod: 45m
exchanges: [{"eid":"Futures_Binance","currency":"BTC_USDT"}]
*/

//@version=5
strategy("Flexible Swing Trading Strategy with Trailing Stop and Date Range", overlay=true)

// Input parameters
rsiPeriod = input.int(14, title="RSI Period")
macdFastLength = input.int(12, title="MACD Fast Length")
macdSlowLength = input.int(26, title="MACD Slow Length")
macdSignalSmoothing = input.int(9, title="MACD Signal Smoothing")
smaShortPeriod = input.int(20, title="Short-term SMA Period")
smaLongPeriod = input.int(50, title="Long-term SMA Period")
takeProfitPercent = input.float(5.0, title="Take Profit Percentage")
stopLossPercent = input.float(3.0, title="Stop Loss Percentage")
trailingStopPercent = input.float(2.0, title="Trailing Stop Percentage")

// Date range inputs
startDate = input(timestamp("2023-01-01 00:00"), title="Start Date")
endDate = input(timestamp("2023-12-31 23:59"), title="End Date")

// Calculate RSI
rsi = ta.rsi(close, rsiPeriod)

// Calculate MACD
[macdLine, signalLine, _] = ta.macd(close, macdFastLength, macdSlowLength, macdSignalSmoothing)

// Calculate SMAs
smaShort = ta.sma(close, smaShortPeriod)
smaLong = ta.sma(close, smaLongPeriod)

// Buy condition
buyCondition = ta.crossover(macdLine, signalLine) and rsi < 70 and close > smaShort and smaShort > smaLong

// Execute buy orders within the date range
if (buyCondition )
    strategy.entry("Buy", strategy.long)

// Calculate take profit and stop loss levels
takeProfitLevel = strategy.position_avg_price * (1 + takeProfitPercent / 100)
stopLossLevel = strategy.position_avg_price * (1 - stopLossPercent / 100)

// Set take profit, stop loss, and trailing stop
strategy.exit("Take Profit", "Buy", limit=takeProfitLevel)
strategy.exit("Stop Loss", "Buy", stop=stopLossLevel)
strategy.exit("Trailing Stop", "Buy", trail_price=close * (1 - trailingStopPercent / 100), trail_offset=trailingStopPercent / 100)

// Plot Buy signals
plotshape(series=buyCondition, location=location.belowbar, color=color.green, style=shape.labelup, text="BUY")

// Plot SMAs
plot(smaShort, color=color.blue, title="20 SMA")
plot(smaLong, color=color.red, title="50 SMA")

// Plot MACD and Signal Line
plot(macdLine, color=color.blue, title="MACD Line")
plot(signalLine, color=color.orange, title="Signal Line")

// Plot RSI
hline(70, "Overbought", color=color.red)
hline(30, "Oversold", color=color.green)
plot(rsi, color=color.purple, title="RSI")

// Debugging plots
plotchar(buyCondition , char='B', location=location.belowbar, color=color.green, size=size.small)
plotchar(strategy.opentrades > 0, char='T', location=location.abovebar, color=color.blue, size=size.small)
plot(stopLossLevel, color=color.red, title="Stop Loss Level")
plot(takeProfitLevel, color=color.green, title="Take Profit Level")
- Strategi DCA dinamis berbasis volume
- Strategi Perdagangan Volume Momentum Multi-Target yang Cerdas
- Trend Rata-rata Bergerak Ganda Mengikuti Strategi dengan RSI Filter
- Opsi sinergi RSI-Rata-rata bergerak ganda Strategi perdagangan kuantitatif
- Moving Average Crossover dengan RSI Trend Momentum Tracking Strategy
- Multi-MA Crossover dengan RSI Dynamic Trailing Stop Loss Strategi Perdagangan Kuantitatif
- Tren Mengikuti RSI dan Moving Average Combined Quantitative Trading Strategy
- Strategi kuantitatif rebound over-sold RSI stop-loss ATR dinamis
- Strategi Perdagangan Dinamis Multi-Indikator
- OBV-SMA Crossover dengan RSI Filter Strategi Perdagangan Momentum Multidimensional
- Adaptive Trailing Drawdown Balanced Trading Strategy dengan Take Profit dan Stop Loss
- Sistem Pengamatan Tren yang Ditingkatkan: Identifikasi Tren Dinamis Berdasarkan ADX dan SAR Parabolik
- Strategi Trading Momentum Stochastic Dual Timeframe
- Adaptive Bollinger Bands Strategi Manajemen Posisi Dinamis
- RSI Dinamis Smart Timing Swing Trading Strategi
- Strategi perdagangan dua arah berdasarkan analisis pola penyerapan candlestick
- Bollinger Breakout dengan Reversi Rata-rata 4H Strategi Perdagangan Kuantitatif
- Tren Mengikuti Strategi Pengukuran Posisi Garis Dinamis
- Dual BBI (Bulls and Bears Index) Strategi Crossover
- Strategi perdagangan swing panjang/pendek yang dinamis dengan sistem sinyal crossover rata-rata bergerak
- Strategi Trading Revolusi Volatilitas Mean Advanced: Sistem Trading Kuantitatif Multidimensional Berdasarkan VIX dan Moving Average
- Strategi Momentum Pembalikan Saluran Tren Emas
- Strategi Perdagangan Tren Momentum EMA Lanjutan
- Strategi Trading Intensitas Tren Multi-MA - Sistem Trading Pintar Fleksibel Berdasarkan Penyimpangan MA
- Sistem Deteksi Tren Dual Volume-Weighted
- Strategi perdagangan kontra-tren multi-faktor
- Strategi Perdagangan Kuantitatif Osilator Momentum dan Divergensi Stochastic yang Ditingkatkan
- Retracement Fibonacci Multi-Timeframe dengan Strategi Trading Trend Breakout
- Tren Multi-Indikator Mengikuti Strategi dengan Optimasi Keuntungan
- Strategi Perdagangan Momentum Breakout Fraktal dengan Optimasi Keuntungan