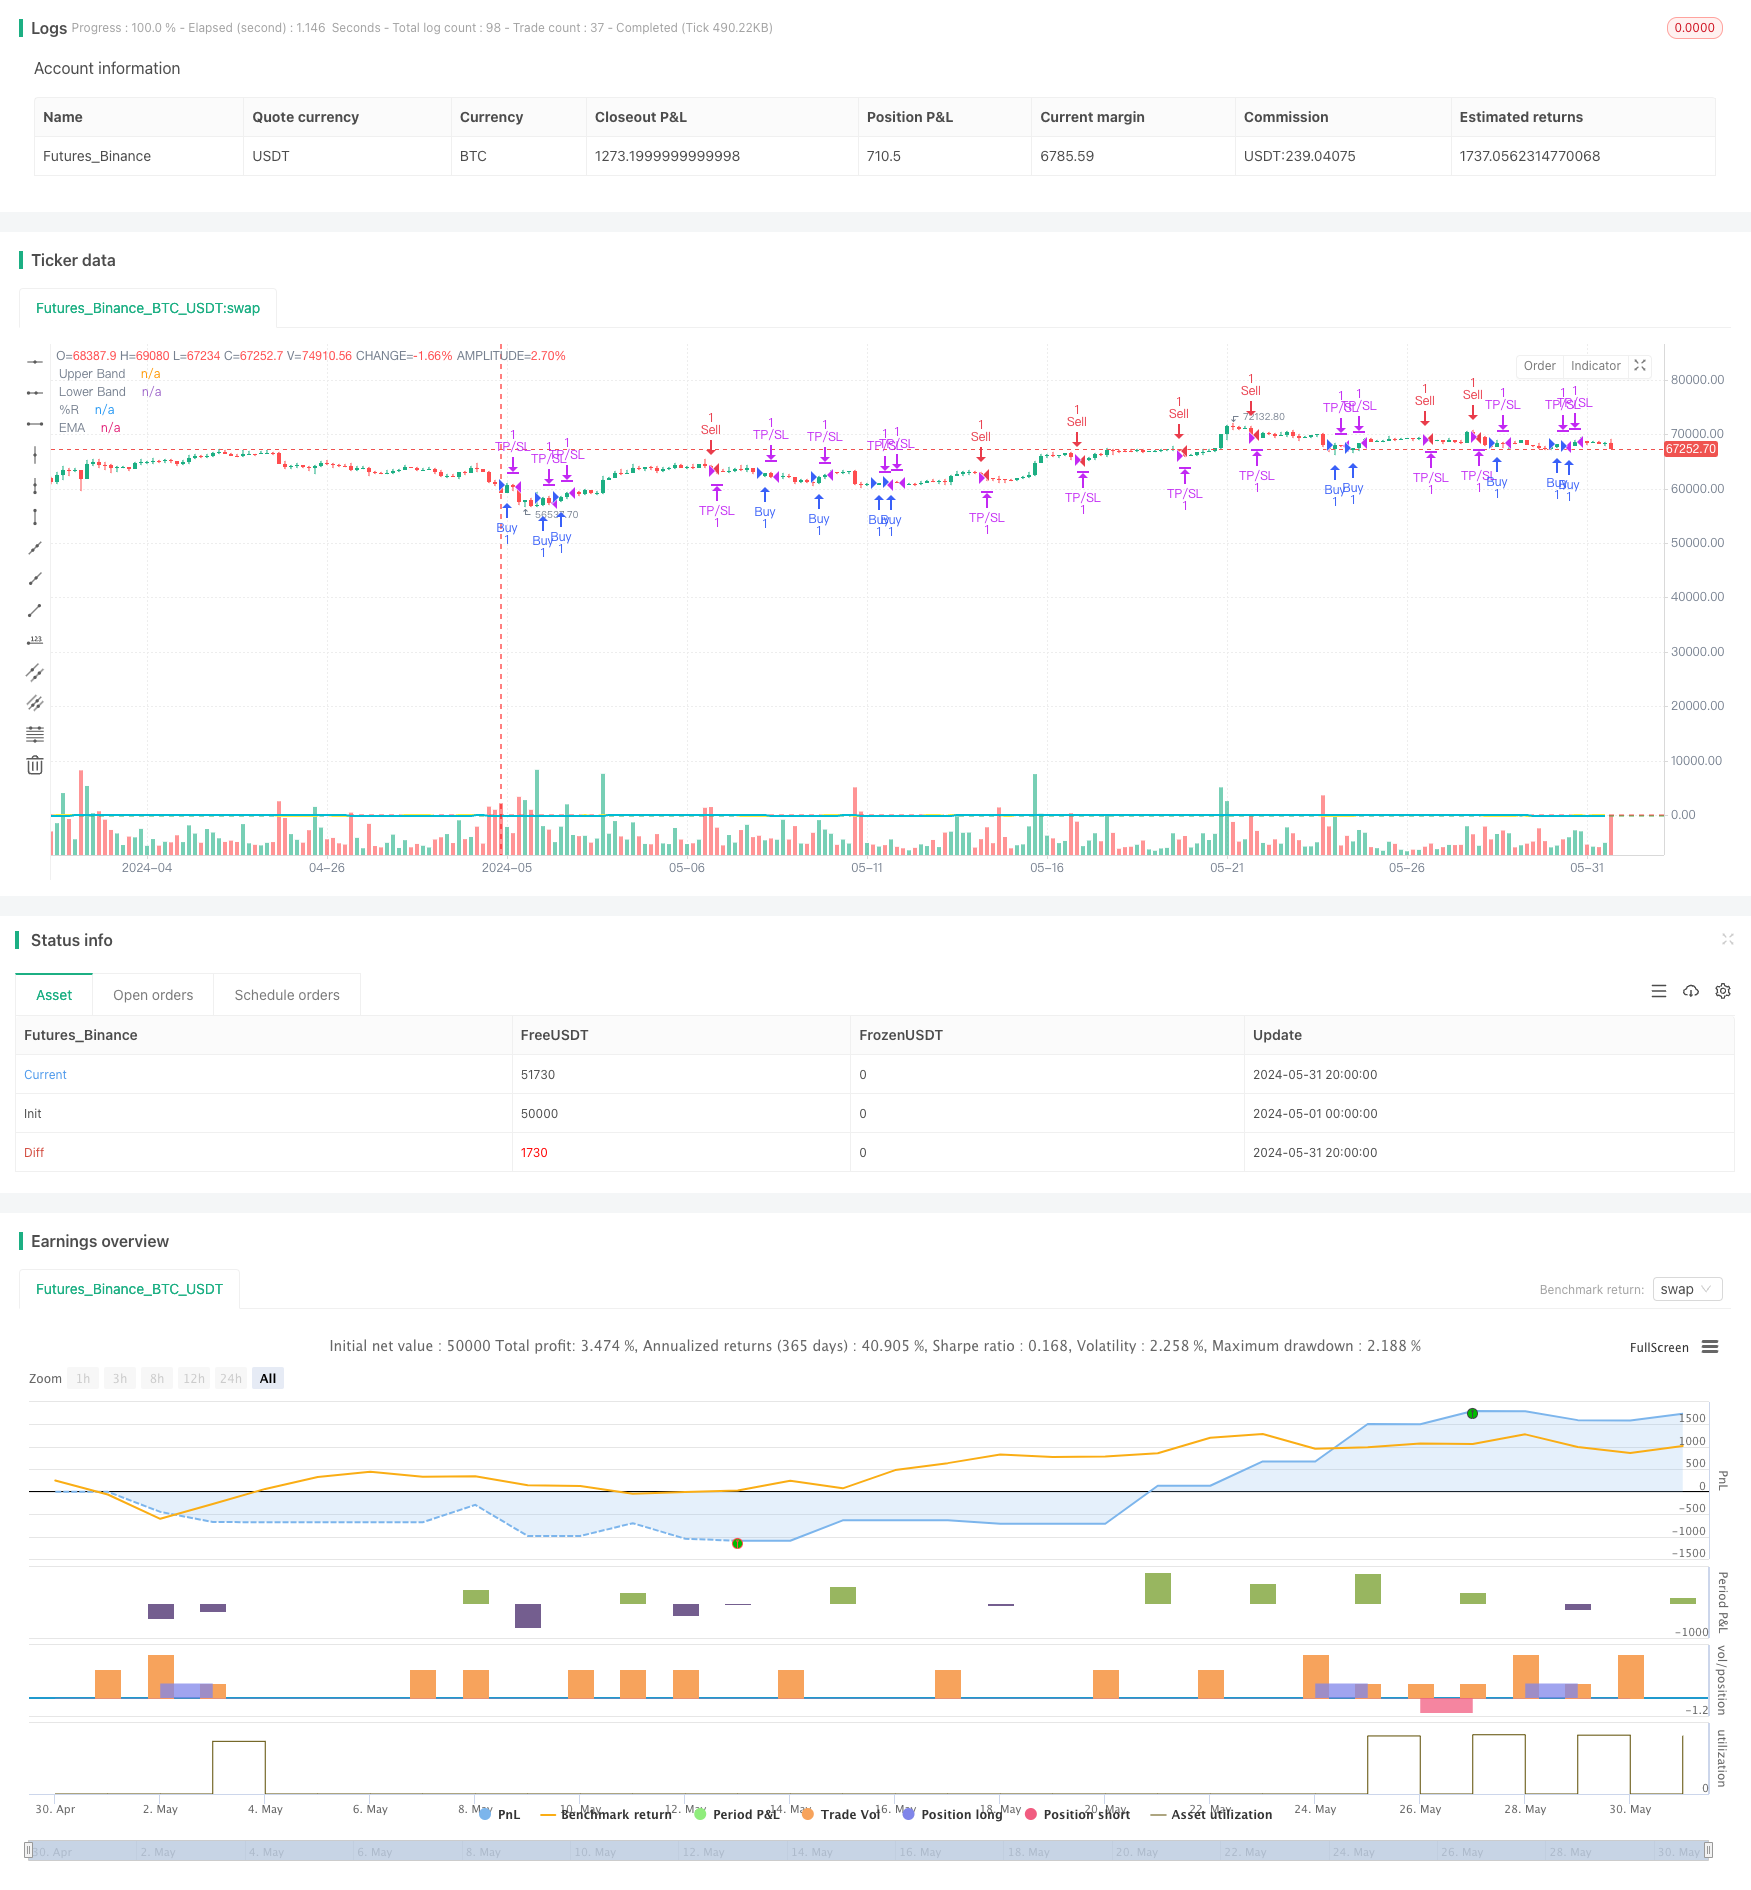
Williams %R ダイナミック TP/SL 調整戦略
作者: リン・ハーンチャオチャン開催日:2024年6月7日15時52分55秒タグ:エイマTPSL

概要
この戦略は,ウィリアムズ%R指標をベースにし,ダイナミックな取利益とストップロスのレベルを調整することで取引パフォーマンスを最適化します.ウィリアムズ%Rが過売りエリア (-80) を越えると買い信号が生成され,過買いエリア (-20) を越えると売れ信号が生成されます.指数関数移動平均 (EMA) がウィリアムズ%R値を滑らかにし,ノイズを減らすために使用されます.この戦略は,異なる市場条件とトレーダーの好みに適応するために,指標期間,取利益/ストップロスのレベル,取引時間,取引方向の選択を含む柔軟なパラメータ設定を提供しています.
戦略の原則
- 特定の期間の Williams %R 指標値を計算する.
- ウィリアムズ %R の指数関数移動平均 (EMA) を計算する.
- ウィリアムズ%Rが下から -80値を超えると 購入信号が発信され 上から -20値を超えると 販売信号が発信されます
- 購入エントリ後,利益とストップロスのレベルを設定します.TP/SL価格レベルに達するか,Williams %Rが逆信号を誘発したとき,取引は終了します.
- 売り入口後,取利益とストップ損失レベルを設定します.TP/SL価格レベルに達するか,Williams %Rが逆信号を誘発したとき,取引は終了します.
- オプションとして,指定された時間帯 (例えば9時~11時) 内に取引し,その時間の上部 (X分前からY分後) に取引するかどうかを選択します.
- オプションとして,トレード方向は,ロングのみ,ショートのみ,または両方として選択してください.
利点を分析する
- ダイナミック TP/SL: ユーザの設定に基づいて,収益とリスクをより適切に保護し,ストップロスのレベルをダイナミックに調整する.
- 柔軟なパラメータ:ユーザーは,異なる市場状況に適応するために,指標期間,TP/SLレベル,取引時間など,さまざまなパラメータを自分の好みに合わせて設定できます.
- 滑らかな指標:EMAを滑らかなウィリアム%R値に導入することで,指標のノイズが効果的に減少し,信号の信頼性が向上します.
- 制限された取引時間: 市場が非常に不安定な時期を避けるため,リスクを減らすため,特定の時間帯内でオプションで取引する.
- 調整可能な取引方向: 市場動向と個人的な判断に基づいて,ロングのみ,ショートのみ,または両方向での取引を選択します.
リスク分析
- パラメータの設定が不適切である場合: TP/SLの設定が過度に緩やかまたは過度に厳格である場合,利益損失または頻繁なストップアウトにつながる可能性があります.
- トレンド識別の誤り: ウィリアムズ %R インディケーターは,不安定な市場では不良なパフォーマンスを発揮し,誤った信号を生成する可能性があります.
- 時間制限の限られた効果: 取引時間を制限することで,戦略が良い取引機会を逃す可能性があります.
- 過剰な最適化:パラメータを過剰に最適化することで,将来の実際の取引で戦略のパフォーマンスが低下する可能性があります.
オプティマイゼーションの方向性
- 他の指標と組み合わせる: 傾向指標,変動指標など,信号確認の精度を向上させる.
- ダイナミックパラメータ最適化: トレンドとレンジング市場の異なるパラメータ設定を使用するなど,市場の状況に応じてリアルタイムでパラメータを調整します.
- TP/SL 方法の改善: 利益のよりよい保護とリスクの管理のために,ストップ損失を後押ししたり,部分的な利益を引き取ったりなどを使用すること.
- 資金管理を組み込む: 口座残高とリスク優先順位に基づいて,それぞれの取引のポジションサイズを動的に調整する.
概要
ウィリアムズ %RダイナミックTP/SL調整戦略は,異なる市場環境と取引スタイルに適応するために柔軟なパラメータ設定を提供しながら,単純で効果的な方法で過剰購入および過剰販売価格条件を把握します.この戦略は,リスクをより適切に制御し,利益を保護できる,収益率とストップ損失レベルを動的に調整します.しかし,この戦略を実践する際には,パラメータ設定,信号確認,取引時間の選択などの要因に注意を払い,戦略の安定性と収益性をさらに向上させなければなりません.
/*backtest
start: 2024-05-01 00:00:00
end: 2024-05-31 23:59:59
period: 4h
basePeriod: 15m
exchanges: [{"eid":"Futures_Binance","currency":"BTC_USDT"}]
*/

//@version=5
strategy("Williams %R Strategy defined buy/sell criteria with TP / SL", overlay=true)

// User inputs for TP and SL levels
tp_level = input.int(defval=60, title="Take Profit (ticks)", minval=10, maxval=500, step=10)
sl_level = input.int(defval=60, title="Stop Loss (ticks)", minval=10, maxval=200, step=10)

// Williams %R calculation
length = input.int(defval=21, title="Length", minval=5, maxval=50, step=1)
willy = 100 * (close - ta.highest(length)) / (ta.highest(length) - ta.lowest(length))

// Exponential Moving Average (EMA) of Williams %R
ema_length = input.int(defval=13, title="EMA Length", minval=5, maxval=50, step=1)
ema_willy = ta.ema(willy, ema_length)

// User inputs for Williams %R thresholds
buy_threshold = -80
sell_threshold = -20

// User input to enable/disable specific trading hours
use_specific_hours = input.bool(defval=false, title="Use Specific Trading Hours")
start_hour = input(defval=timestamp("0000-01-01 09:00:00"), title="Start Hour")
end_hour = input(defval=timestamp("0000-01-01 11:00:00"), title="End Hour")

// User input to choose trade direction
trade_direction = input.string(defval="Both", title="Trade Direction", options=["Buy Only", "Sell Only", "Both"])

// User input to enable/disable "Minutes Before" and "Minutes After" options
enable_minutes_before_after = input.bool(defval=true, title="Enable Minutes Before/After Options")
minutes_before = enable_minutes_before_after ? input.int(defval=10, title="Minutes Before the Top of the Hour", minval=0, maxval=59, step=1) : 0
minutes_after = enable_minutes_before_after ? input.int(defval=10, title="Minutes After the Top of the Hour", minval=0, maxval=59, step=1) : 0

// Condition to check if the current minute is within the user-defined time window around the top of the hour
is_top_of_hour_range = (minute(time) >= (60 - minutes_before) and minute(time) <= 59) or (minute(time) >= 0 and minute(time) <= minutes_after)

// Condition to check if the current time is within the user-defined specific trading hours
in_specific_hours = true
if use_specific_hours
    in_specific_hours := (hour(time) * 60 + minute(time)) >= (hour(start_hour) * 60 + minute(start_hour)) and (hour(time) * 60 + minute(time)) <= (hour(end_hour) * 60 + minute(end_hour))

// Buy and Sell conditions with time-based restriction
buy_condition = ta.crossover(willy, buy_threshold) and is_top_of_hour_range and in_specific_hours
sell_condition = ta.crossunder(willy, sell_threshold) and is_top_of_hour_range and in_specific_hours

// Strategy entry and exit with TP and SL
if (trade_direction == "Buy Only" or trade_direction == "Both") and buy_condition
    strategy.entry("Buy", strategy.long)

if (trade_direction == "Sell Only" or trade_direction == "Both") and sell_condition
    strategy.entry("Sell", strategy.short)

// If a buy entry was taken, allow the trade to be closed after reaching TP and SL or if conditions for a sell entry are true
if (strategy.opentrades > 0)
    strategy.exit("TP/SL", profit=tp_level, loss=sl_level)

// Plot Williams %R and thresholds for visualization
hline(-20, "Upper Band", color=color.red)
hline(-80, "Lower Band", color=color.green)
plot(willy, title="%R", color=color.yellow, linewidth=2)
plot(ema_willy, title="EMA", color=color.aqua, linewidth=2)
関連性
- ダイナミック・テイク・プロフィートとストップ・ロスのEMAクロスオーバー・トレーディング戦略
- アダプティブ・トレンドフォロー・トレーディング・戦略: ダイナミック・リスク・マネジメント・システム付きの200 EMA・ブレイクアウト
- EMAのクロスオーバーとダブル・テイク・プロフィート・ストップ・ロスの戦略
- 自動化量的な取引システムと二重EMAクロスオーバーとリスク管理
- 先進的なEMAクロスオーバー戦略: ダイナミックなストップ・ロストとテイク・プロフィート目標を持つ適応型取引システム
- 多期指数関数移動平均のクロスオーバー戦略
- RSIモメンタム強化取引戦略とダブルEMAクロスオーバー
- スーパートレンドとEMAを組み合わせる戦略をフォローするダイナミックトレンド
- ポジションスケーリングによるマルチRSI-EMAモメントヘッジ戦略
- 精密な得益とストップ・ロスの戦略で動的な傾向を追求
もっと
- EMAのクロスオーバー・モメンタム・スカルピング戦略
- BBの脱出戦略
- VWAP と RSI ダイナミック・ボリンガー・バンドは,利益とストップ・ロスの戦略をとる
- チェンデ・クロール ストップ ダイナミックATRトレンド 戦略をフォローする
- この戦略はチャイキンマネーフロー (CMF) をベースに取引信号を生成します
- トレンドフィルタピンのバー逆転戦略
- サポート・レジスタンスレベルでの逆転パターンに基づく定量的な取引戦略
- MA,SMA,MA傾斜,ストップ損失を後押しし,再入力
- クロスオーバー TSI戦略
- EMAの二重移動平均のクロスオーバー戦略
- RSI ダイナミック・ドラウダウンストップ・ロスの戦略
- VWAP トレーディング 戦略とボリューム アノマリー検出
- スーパートレンドとEMAの組み合わせ戦略
- TGT 価格下落に基づいた買い上げ戦略
- EMAクロスオーバーとRSIフィルターによる二重トレンド戦略
- EMAとパラボリックSARの組み合わせ戦略
- MACDとRSI 多フィルター・イントラデイ・トレーディング・戦略
- 2つの市場間の価格関係に基づく仲裁取引戦略
- RSIに基づく取引戦略で 利回りとストップロスを パーセントベースにする
- 最適化されたロング取引のためのMACDとマルティンゲール組み合わせ戦略