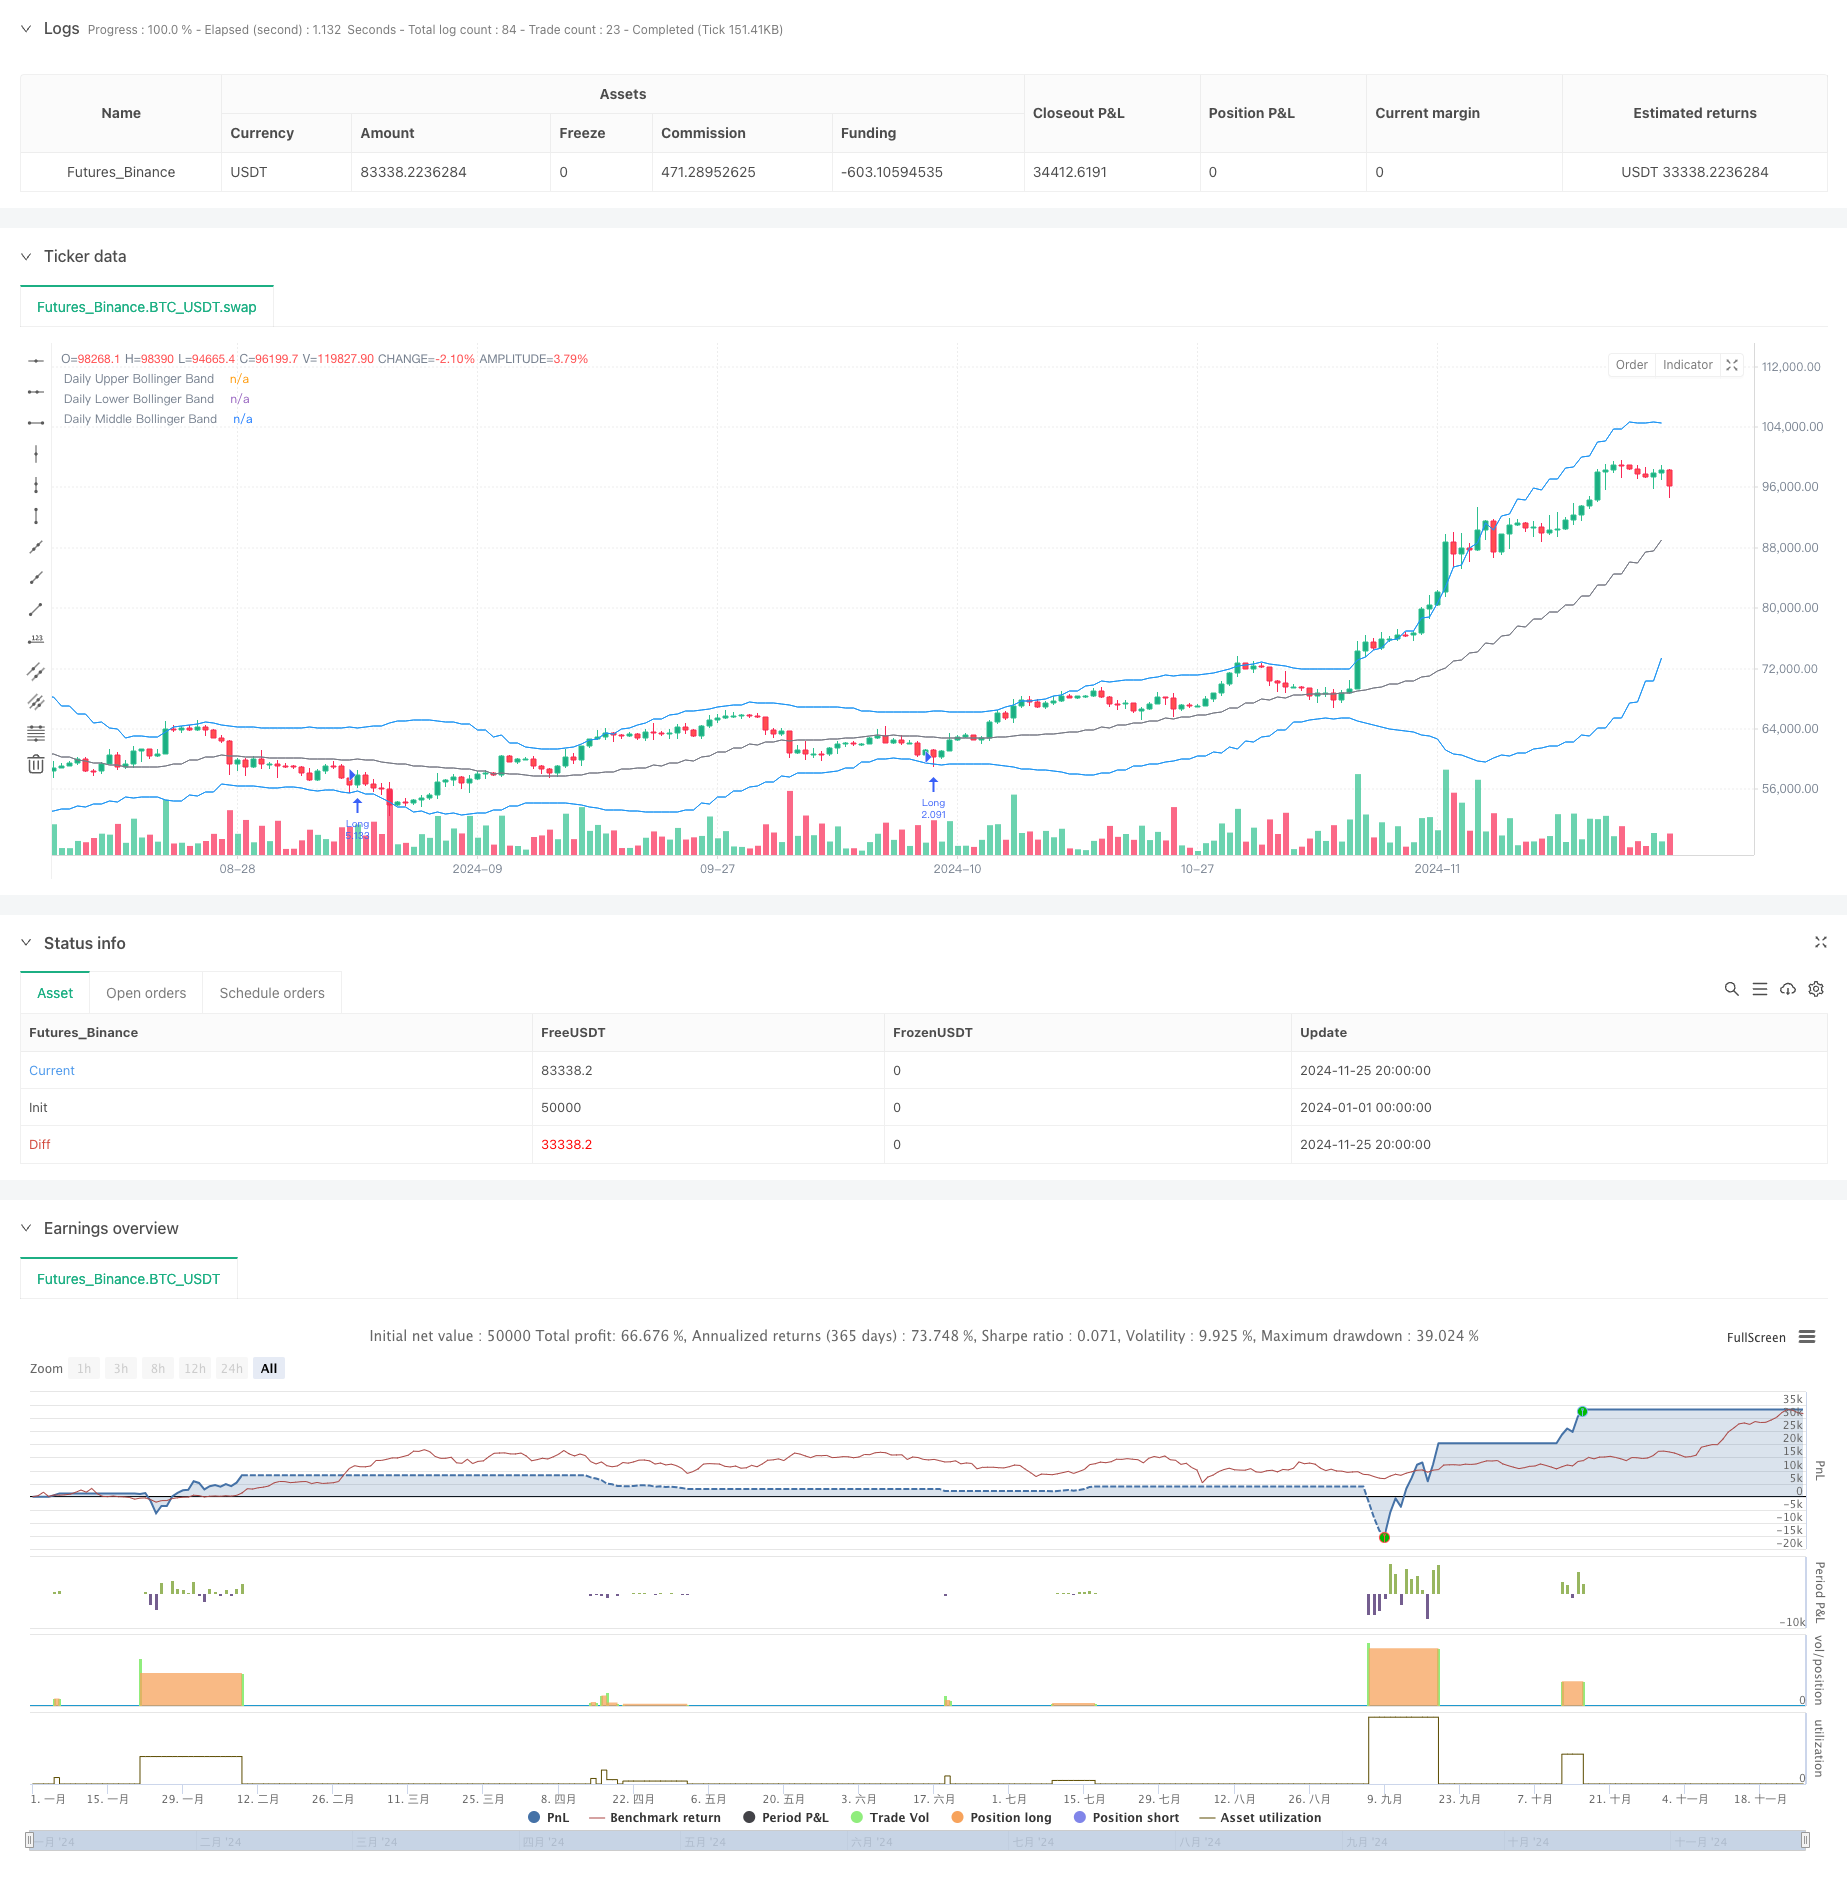
Bollinger Bands と Candlestick パターンに基づく高度なトレンド取引戦略
作者: リン・ハーンチャオチャン,日付: 2024年11月27日 14:18:33タグ:BBATRRRPSRマルチSDWBR

概要
Bollinger Bands (ボリンジャーバンド) とキャンドルスティックパターン分析をベースとしたトレンドフォロー戦略である.この戦略は,価格がボリンジャーバンドに触るとキャンドルスティックパターンを観察し,ウィックとボディの比率関係と組み合わせて,主に潜在的な市場逆転点を特定する.また,この戦略は取引ごとに露出を制御するために固定リスクモデルを使用し,取引の精度を高めるために複数のタイムフレーム分析を使用する.
戦略の原則
戦略のコアロジックは,いくつかの重要な要素に基づいています. まず,価格波動範囲を決定するために20期間のボリンジャーバンドを計算します. 次に,価格がボリンジャーバンドに触ると,上/下 wicksとキャンドルスティックボディの比率を分析し,比率が設定された
戦略 の 利点
- 正確なリスク管理: 取引ごとに制御されたリスク露出を確保する固定パーセントリスク管理モデルを使用する
- 柔軟なエントリーポイント: 異なる取引スタイルに対応する複数のエントリー価格オプションを提供します.
- 技術指標の組み合わせ: 信号の信頼性を向上させるために,ボリンジャー帯とキャンドルスタイクパターン分析を組み合わせます.
- 合理的なストップ・ロスの配置: 市場の動向に合わせて,主要なサポートとレジスタンスレベルに基づいてストップ・ロスを設定する
- 取引の包括的な管理: 誤った信号を避けるためのオーダーの有効期限のメカニズムを含む
戦略リスク
- 急速な市場の変動リスク: 変動する市場では,ウィック比率が誤った信号を生む可能性があります.
- 資金管理リスク: 固定割合リスクモデルは,連続した損失の後,ポジションが不足する可能性があります.
- ストップ・ロスの投資リスク: サポートとレジスタンス計算は,特定の市場条件下で正確ではない場合があります.
- タイムフレーム依存: 主に日々のタイムフレームに基づいた戦略は,より短いタイムフレームで機会を逃す可能性があります
戦略の最適化方向
- 音量指標を組み込む: 信頼性を向上させるために信号確認のための音量分析を追加
- ストップ・ロスのメカニズムを最適化する: 市場の変動に基づいて調整するダイナミックストップ・ロスの実施を検討する
- 市場環境フィルターを追加する: 異なる市場条件における戦略パラメータを調整するために,傾向強さの指標を含める.
- ポジション管理を改善する: 市場の変動に基づいて動的ポジションサイズ化を実施することを検討する
- 時間フィルターを追加: 変動が激しい市場セッションで取引を避けるために時間フィルターを追加します.
概要
この戦略は,比較的包括的な取引システムを構築するために,古典的な技術分析ツールと近代的なリスク管理方法を組み合わせます.主な利点は,厳格なリスク管理と柔軟なエントリーメカニズムにあります.一方で,市場環境の変化と実用的な応用における信号信頼性の検証に注意を払う必要があります.提案された最適化方向性を通じて,特に信号フィルタリングとリスク管理の側面において,さらなる改善の余地があります.
/*backtest
start: 2024-01-01 00:00:00
end: 2024-11-26 00:00:00
period: 12h
basePeriod: 12h
exchanges: [{"eid":"Futures_Binance","currency":"BTC_USDT"}]
*/

//@version=5
strategy("Trade Entry Detector, based on Wick to Body Ratio when price tests Bollinger Bands", overlay=true, default_qty_type=strategy.fixed)

// Input for primary analysis time frame
timeFrame = "D"  // Daily time frame

// Bollinger Band settings
length = input.int(20, title="Bollinger Band Length", minval=1)
mult = input.float(2.0, title="Standard Deviation Multiplier", minval=0.1)
source = input(close, title="Source")

// Entry ratio settings
wickToBodyRatio = input.float(1.0, title="Minimum Wick-to-Body Ratio", minval=0)

// Order Fill Timing Option
fillOption = input.string("Daily Close", title="Order Fill Timing", options=["Daily Close", "Daily Open", "HOD", "LOD"])

// Account and risk settings
accountBalance = 100000  // Account balance in dollars
riskPercentage = 1.0     // Risk percentage per trade
riskAmount = (riskPercentage / 100) * accountBalance // Fixed 1% risk amount

// Request daily data for calculations
dailyHigh = request.security(syminfo.tickerid, timeFrame, high)
dailyLow = request.security(syminfo.tickerid, timeFrame, low)
dailyClose = request.security(syminfo.tickerid, timeFrame, close)
dailyOpen = request.security(syminfo.tickerid, timeFrame, open)

// Calculate Bollinger Bands on the daily time frame
dailyBasis = request.security(syminfo.tickerid, timeFrame, ta.sma(source, length))
dailyDev = mult * request.security(syminfo.tickerid, timeFrame, ta.stdev(source, length))
dailyUpperBand = dailyBasis + dailyDev
dailyLowerBand = dailyBasis - dailyDev

// Calculate the body and wick sizes on the daily time frame
dailyBodySize = math.abs(dailyOpen - dailyClose)
dailyUpperWickSize = dailyHigh - math.max(dailyOpen, dailyClose)
dailyLowerWickSize = math.min(dailyOpen, dailyClose) - dailyLow

// Conditions for a candle with an upper wick or lower wick that touches the Bollinger Bands
upperWickCondition = (dailyUpperWickSize / dailyBodySize >= wickToBodyRatio) and (dailyHigh > dailyUpperBand)
lowerWickCondition = (dailyLowerWickSize / dailyBodySize >= wickToBodyRatio) and (dailyLow < dailyLowerBand)

// Define the swing high and swing low for stop loss placement
var float swingLow = na
var float swingHigh = na

if (ta.pivothigh(dailyHigh, 5, 5))
    swingHigh := dailyHigh[5]

if (ta.pivotlow(dailyLow, 5, 5))
    swingLow := dailyLow[5]

// Determine entry price based on chosen fill option
var float longEntryPrice = na
var float shortEntryPrice = na

if lowerWickCondition
    longEntryPrice := fillOption == "Daily Close" ? dailyClose :
                      fillOption == "Daily Open" ? dailyOpen :
                      fillOption == "HOD" ? dailyHigh : dailyLow

if upperWickCondition
    shortEntryPrice := fillOption == "Daily Close" ? dailyClose :
                       fillOption == "Daily Open" ? dailyOpen :
                       fillOption == "HOD" ? dailyHigh : dailyLow

// Execute the long and short entries with expiration
var int longOrderExpiry = na
var int shortOrderExpiry = na

if not na(longEntryPrice)
    longOrderExpiry := bar_index + 2  // Order expires after 2 days

if not na(shortEntryPrice)
    shortOrderExpiry := bar_index + 2  // Order expires after 2 days

// Check expiration and execute orders
if (longEntryPrice and bar_index <= longOrderExpiry and high >= longEntryPrice)
    longStopDistance = close - nz(swingLow, close)
    longPositionSize = longStopDistance > 0 ? riskAmount / longStopDistance : na
    if (not na(longPositionSize))
        strategy.entry("Long", strategy.long, qty=longPositionSize)
    longEntryPrice := na  // Reset after entry

if (shortEntryPrice and bar_index <= shortOrderExpiry and low <= shortEntryPrice)
    shortStopDistance = nz(swingHigh, close) - close
    shortPositionSize = shortStopDistance > 0 ? riskAmount / shortStopDistance : na
    if (not na(shortPositionSize))
        strategy.entry("Short", strategy.short, qty=shortPositionSize)
    shortEntryPrice := na  // Reset after entry

// Exit logic: hit the opposing Bollinger Band
if (strategy.position_size > 0) // Long position
    strategy.exit("Exit Long", "Long", limit=dailyUpperBand)
else if (strategy.position_size < 0) // Short position
    strategy.exit("Exit Short", "Short", limit=dailyLowerBand)

if (strategy.position_size > 0) // Long position
    strategy.exit("Stop Loss Long", "Long", stop=swingLow)
else if (strategy.position_size < 0) // Short position
    strategy.exit("Stop Loss Short", "Short", stop=swingHigh)

// Plot daily Bollinger Bands and levels on the chosen time frame
plot(dailyUpperBand, color=color.blue, linewidth=1, title="Daily Upper Bollinger Band")
plot(dailyLowerBand, color=color.blue, linewidth=1, title="Daily Lower Bollinger Band")
plot(dailyBasis, color=color.gray, linewidth=1, title="Daily Middle Bollinger Band")
関連性
- Bollinger Bands と ATR に基づく多レベルインテリジェント・ダイナミック・トレリングストップ戦略
- トリプルスタンダードデバイエーション ボリンガー帯 100日移動平均最適化によるブレイクアウト戦略
- 強化されたダイナミック・ボリンガー・バンド取引戦略
- 多期フラクタルブレイクオーダーブロック 適応型取引戦略
- 多期ボリンガー帯 触動トレンド逆転 定量取引戦略
- 目標とストップ・ロスの最適化により強化されたブレークアウト戦略
- Bollinger Bands と RSI 統合による強化された平均逆転戦略
- 複数の技術指標の統合を備えたAI最適化された適応型ストップ損失取引システム
- ボリンジャー帯とフラクタルブレイクアウトに基づくダイナミック・リバースポイント戦略
- 賢明な時間に基づく長短回転バランスのとれた取引戦略
もっと
- 調整可能なストップ・ロストとテイク・プロフィートを持つ二重移動平均クロスオーバー戦略
- 動向オシレーターに基づく戦略をフォローする適応傾向
- PVT-EMA トレンド・クロスオーバー・ボリューム・価格戦略
- MACD-EMA 多期動的クロスオーバー量的な取引システム
- MACD ダイナミック・オシレーション・クロスプレジクション戦略
- VWAP-ATR ダイナミック・プライス・アクション・トレーディング・システム
- Bollinger Bands と RSI クロス ベース ダイナミック トレンド 定量 戦略
- Bollinger Bands,RSI,ATRベースのダイナミックストップ・ロース・システムによる平均逆転戦略
- パラボリックSAR指標に基づくダイナミック取引戦略システム
- アダプティブ・ボラティリティ・アンド・モメント・量子トレード・システム (AVMQTS)
- 脱出戦略の後にATR波動性と移動平均に基づく適応傾向
- 全体キャンドルシグナルシステムとダブルEMAモメンタムトレンド・トレード戦略
- RSI最適化システムとダブルタイムフレームスーパートレンド
- ダイナミックストップ・ロストとテイク・プロフィートシステムによる戦略をフォローする二重移動平均クロスオーバートレンド
- ATRとMACD統合付きの多期トレンドフォロー・トレード・システム
- 2つのタイムフレームスーパートレンド RSI インテリジェント・トレーディング・戦略
- 双重MACD価格アクションブレイク トレイリング戦略
- マルチ-EMA トレンド・モメントム認識とストップ・ロスの取引システム
- 量的な取引のための二重EMA・ボリュームトレンド確認戦略
- ダイナミック・テイク・プロフィート/ストップ・ロスの EMA-RSI・クロスオーバー戦略