RSI 저점 반전 전략
저자:차오장, 날짜: 2024-06-17 15:32:18태그:RSISLTP

전반적인 설명
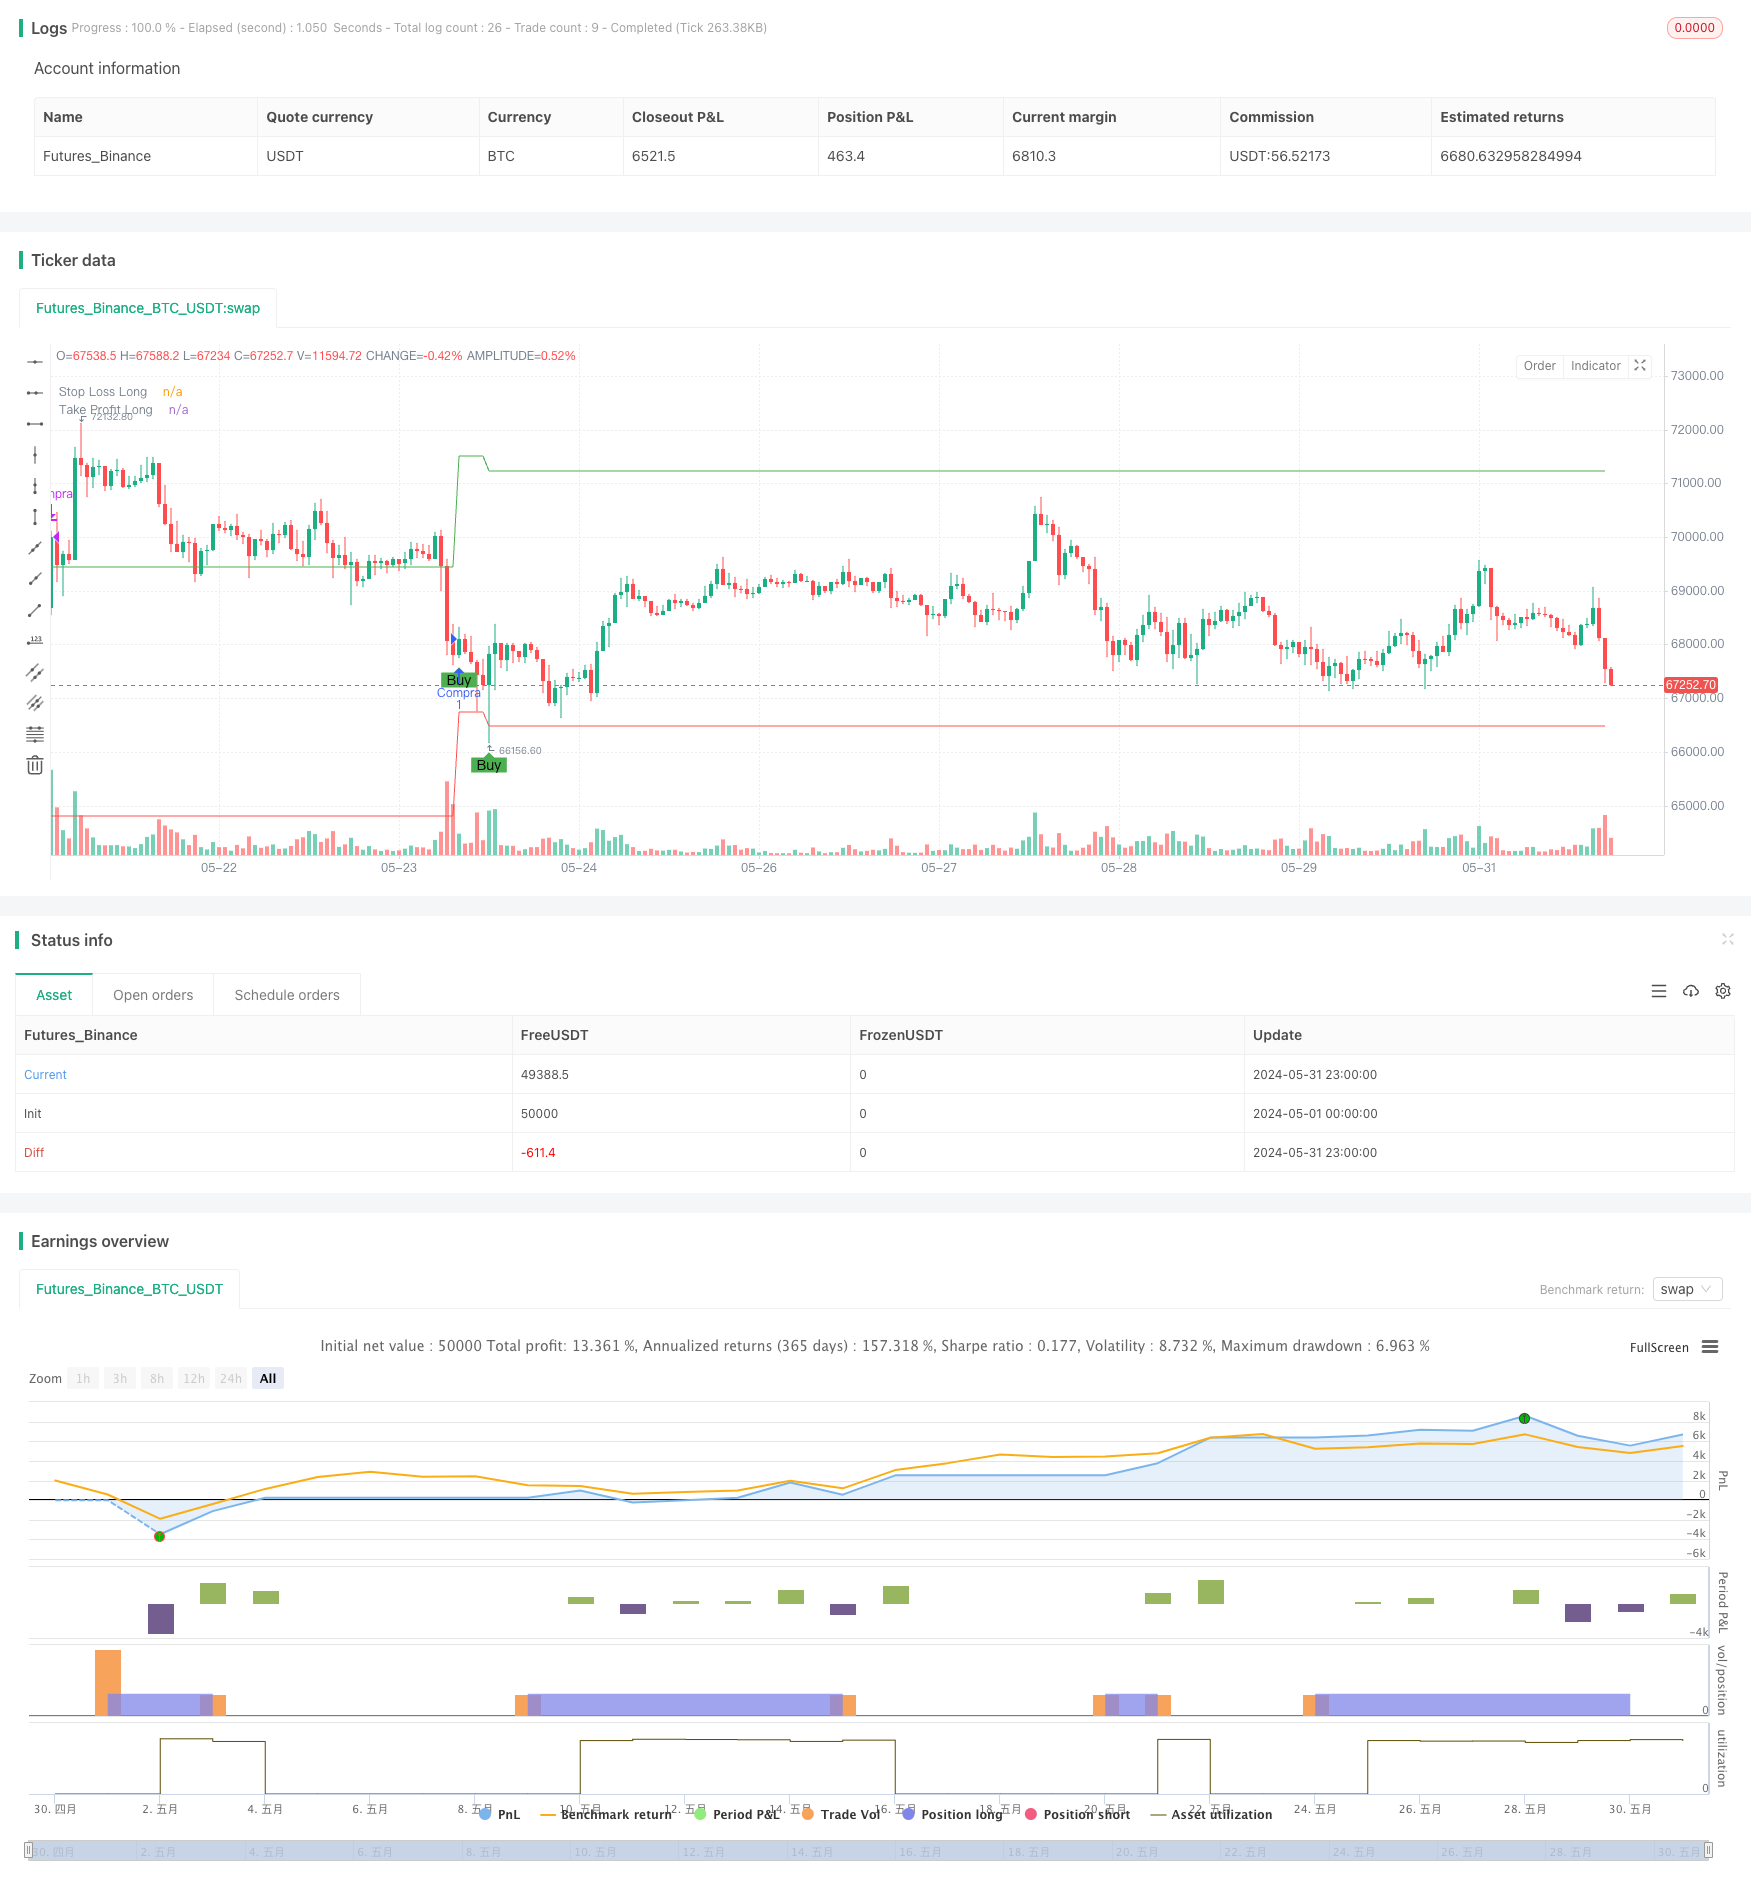
이 전략은 상대 강도 지수 (RSI) 를 활용하여 시장의 과잉 판매 상태를 결정합니다. RSI가 설정된 과잉 판매 한계 이하로 떨어지면 구매 신호를 생성합니다. 동시에 위험을 제어하고 이익을 잠금하기 위해 손해를 멈추고 이익을 취합니다. 전략은 단지 긴 포지션을 취하고 짧게하지 않습니다.
전략 원칙
- RSI 지표를 계산하여 시장의 과반 구매 및 과반 판매 상태를 측정합니다.
- RSI가 설정된 과반 판매 마이너스 이하로 떨어지면 (디폴트는 30) 구매 신호를 생성합니다.
- 구매 후 현재 종료 가격과 설정된 스톱 로스 및 스톱 로스 비율을 기준으로 스톱 로스 및 수익 가격을 계산합니다.
- 보유 기간 동안 가격이 스톱 로스 가격에 도달하면 손실로 포지션을 닫습니다. 가격이 수익 가격에 도달하면 수익으로 포지션을 닫습니다.
- 포지션을 보유하는 동안 현재 포지션이 닫히기 전까지는 새로운 구매 신호가 생성되지 않습니다.
전략적 장점
- 간단하고 사용하기 쉬운: 전략 논리는 명확하고 몇 가지 매개 변수를 설정하는 것 만으로 초보자 사용자에 적합합니다.
- 트렌드 추적: RSI 지표를 사용하여 과잉 판매 상황을 결정함으로써 트렌드의 초기 단계에 참여하고 잠재적 인 역전 기회를 포착 할 수 있습니다.
- 리스크 제어: 스톱 로스를 설정하고 이윤을 취함으로써 이미 얻은 이윤을 차단하면서 단일 거래의 위험 노출을 효과적으로 제어 할 수 있습니다.
전략 위험
- 매개 변수 최적화: 전략의 성능은 RSI 기간과 과잉 판매 한계와 같은 매개 변수 선택에 달려 있으며, 다른 매개 변수 설정은 다른 결과를 가져올 수 있습니다.
- 시장 위험: 시장이 계속 하락할 때, RSI는 과도한 판매 지역에서 오랫동안 남아있을 수 있으며, 빈번한 잘못된 신호로 이어질 수 있습니다.
- 트렌드 리스크: 트렌드 트래킹 능력이 부족하기 때문에 트렌드 트렌드가 강한 시장에서는 수익을 잃을 수 있습니다.
전략 최적화 방향
- 트렌드 필터링을 추가: 구매 신호를 생성하기 전에 먼저 현재 시장이 상승 추세인지 여부를 결정하십시오. 이동 평균 또는 다른 트렌드 지표가 판단에 도움이 될 수 있습니다.
- 스톱 로스를 최적화하고 이윤을 취하십시오. 후속 스톱 또는 동적 이윤을 취하는 것을 고려하여 가격 변화와 함께 자동으로 스톱 로스의 위치를 조정하고 수익을 취하여 더 높은 수익/위험 비율을 추구하십시오.
- 다른 지표와 결합: 신호의 신뢰성과 정확성을 향상시키기 위해 RSI를 다른 지표 (MACD, 볼링거 밴드 등) 와 결합하는 것을 고려하십시오.
요약
이 전략은 고정 스톱 손실을 설정하고 이익을 취하면서 시장에서 과판 역전 기회를 포착하기 위해 RSI 지표를 사용합니다. 전략 논리는 간단하고 명확하며 초보 사용자에게 적합합니다. 그러나이 전략에는 트렌드를 파악하는 능력이 약하고 신호 신뢰성이 개선되어야하는 것과 같은 특정 한계도 있습니다. 따라서 실용적인 응용에서는 트렌드 판단, 스톱 손실 및 이익 취득 최적화 및 더 강력한 거래 성과를 얻기 위해 지표 조합과 같은 측면에서 전략을 최적화하고 개선하는 것을 고려 할 수 있습니다.
/*backtest
start: 2024-05-01 00:00:00
end: 2024-05-31 23:59:59
period: 1h
basePeriod: 15m
exchanges: [{"eid":"Futures_Binance","currency":"BTC_USDT"}]
*/

//@version=5
strategy("Estratégia com RSI (Apenas Compras)", overlay=true)

// Parâmetros de entrada
rsiLength = input.int(14, title="Período do RSI")
oversold = input.int(30, title="Nível de Sobrevenda (RSI)")
stopLossPercent = input.float(2.0, title="Stop Loss (%)")
takeProfitPercent = input.float(5.0, title="Take Profit (%)")

// Cálculo do RSI
rsi = ta.rsi(close, rsiLength)

// Sinal de Compra
buySignal = ta.crossover(rsi, oversold)

// Plotando o sinal de compra
plotshape(series=buySignal, location=location.belowbar, color=color.green, style=shape.labelup, title="Compra", text="Buy")

// Variáveis para Stop Loss e Take Profit
var float longStop = na
var float longTake = na

// Entrando na posição de compra
if (buySignal)
    entryPrice = close
    longStop := entryPrice * (1 - stopLossPercent / 100)
    longTake := entryPrice * (1 + takeProfitPercent / 100)
    strategy.entry("Compra", strategy.long)
    label.new(x=bar_index, y=low, text="Compra", style=label.style_label_up, color=color.green)

// Gerenciamento de Stop Loss e Take Profit
if (strategy.position_size > 0)
    if (close <= longStop)
        strategy.close("Compra", comment="Stop Loss")
        label.new(x=bar_index, y=low, text="Stop Loss", style=label.style_label_down, color=color.red)
    if (close >= longTake)
        strategy.close("Compra", comment="Take Profit")
        label.new(x=bar_index, y=high, text="Take Profit", style=label.style_label_up, color=color.green)

// Plotando as linhas de Stop Loss e Take Profit
plot(longStop, color=color.red, linewidth=1, title="Stop Loss Long")
plot(longTake, color=color.green, linewidth=1, title="Take Profit Long")
관련
- 다 구역 RSI 거래 전략
- RSI 기반의 거래 전략, 수익을 취하고 손실을 중지하는 비율
- 양적 거래 전략에 따른 RSI와 AO의 시너지 트렌드
- 이중 시간 프레임 스토카스틱 모멘텀 거래 전략
- 포지션 스케일링과 함께 멀티-RSI-EMA 모멘텀 헤딩 전략
- 멀티 타겟 지능형 볼륨 모멘텀 거래 전략
- 이중 EMA 크로스오버와 RSI 모멘텀 강화 거래 전략
- 다중 시간 프레임 RSI 과잉 매출 역전 전략
- 가중화 이동 평균 및 상대적 강도 지수 위험 관리 최적화 시스템과의 교차 전략
- 이중 이동 평균 트렌드 RSI 필터와 전략에 따라
더 많은
- 볼링거 밴드 및 기하급수적인 이동 평균 크로스오버 거래 전략
- EMA와 슈퍼트렌드 조합 양적 거래 전략
- EMA, RSI, TA, 다중 지표 거래 전략
- SUPERTREND 트렌드를 따르는 장기 포지션, 스톱 로스 및 영업 전략
- 크로스오버 이동 평균에 기초한 적응적 예상 가치 평가 전략의 추세
- EMA 상승적 크로스오버 전략
- EMA 동적 스톱 로스 거래 전략
- RSI, MACD, 볼링거 밴드 및 볼륨 기반의 하이브리드 거래 전략
- 부피 스파이크 검출과 함께 ZLSMA-Enhanced Chandelier 출구 전략
- 두 개의 이동 평균 크로스오버, RSI 및 스토카스틱 지표에 기초한 단기적인 양적 거래 전략
- 피셔 트랜스포름 동적 임계 트렌드 전략
- 평균 반전 전략
- EMA100 및 NUPL 상대적 실현되지 않은 이익 양적 거래 전략
- 스토카스틱 오시레이터 기반의 변동성 범위 거래 전략
- 간단한 복합 전략: 피보트 포인트 슈퍼 트렌드 및 DEMA
- EMA 트렌드 필터 전략
- 이동 평균 크로스오버 전략
- 3분 촛불 높음 낮은 지점에 기초한 내일 브레이크업 전략
- 이동 평균, 지원/저항 및 볼륨에 기반한 고급 진입 전략
- EMA RSI MACD 동적 취득 및 손실 중지 거래 전략