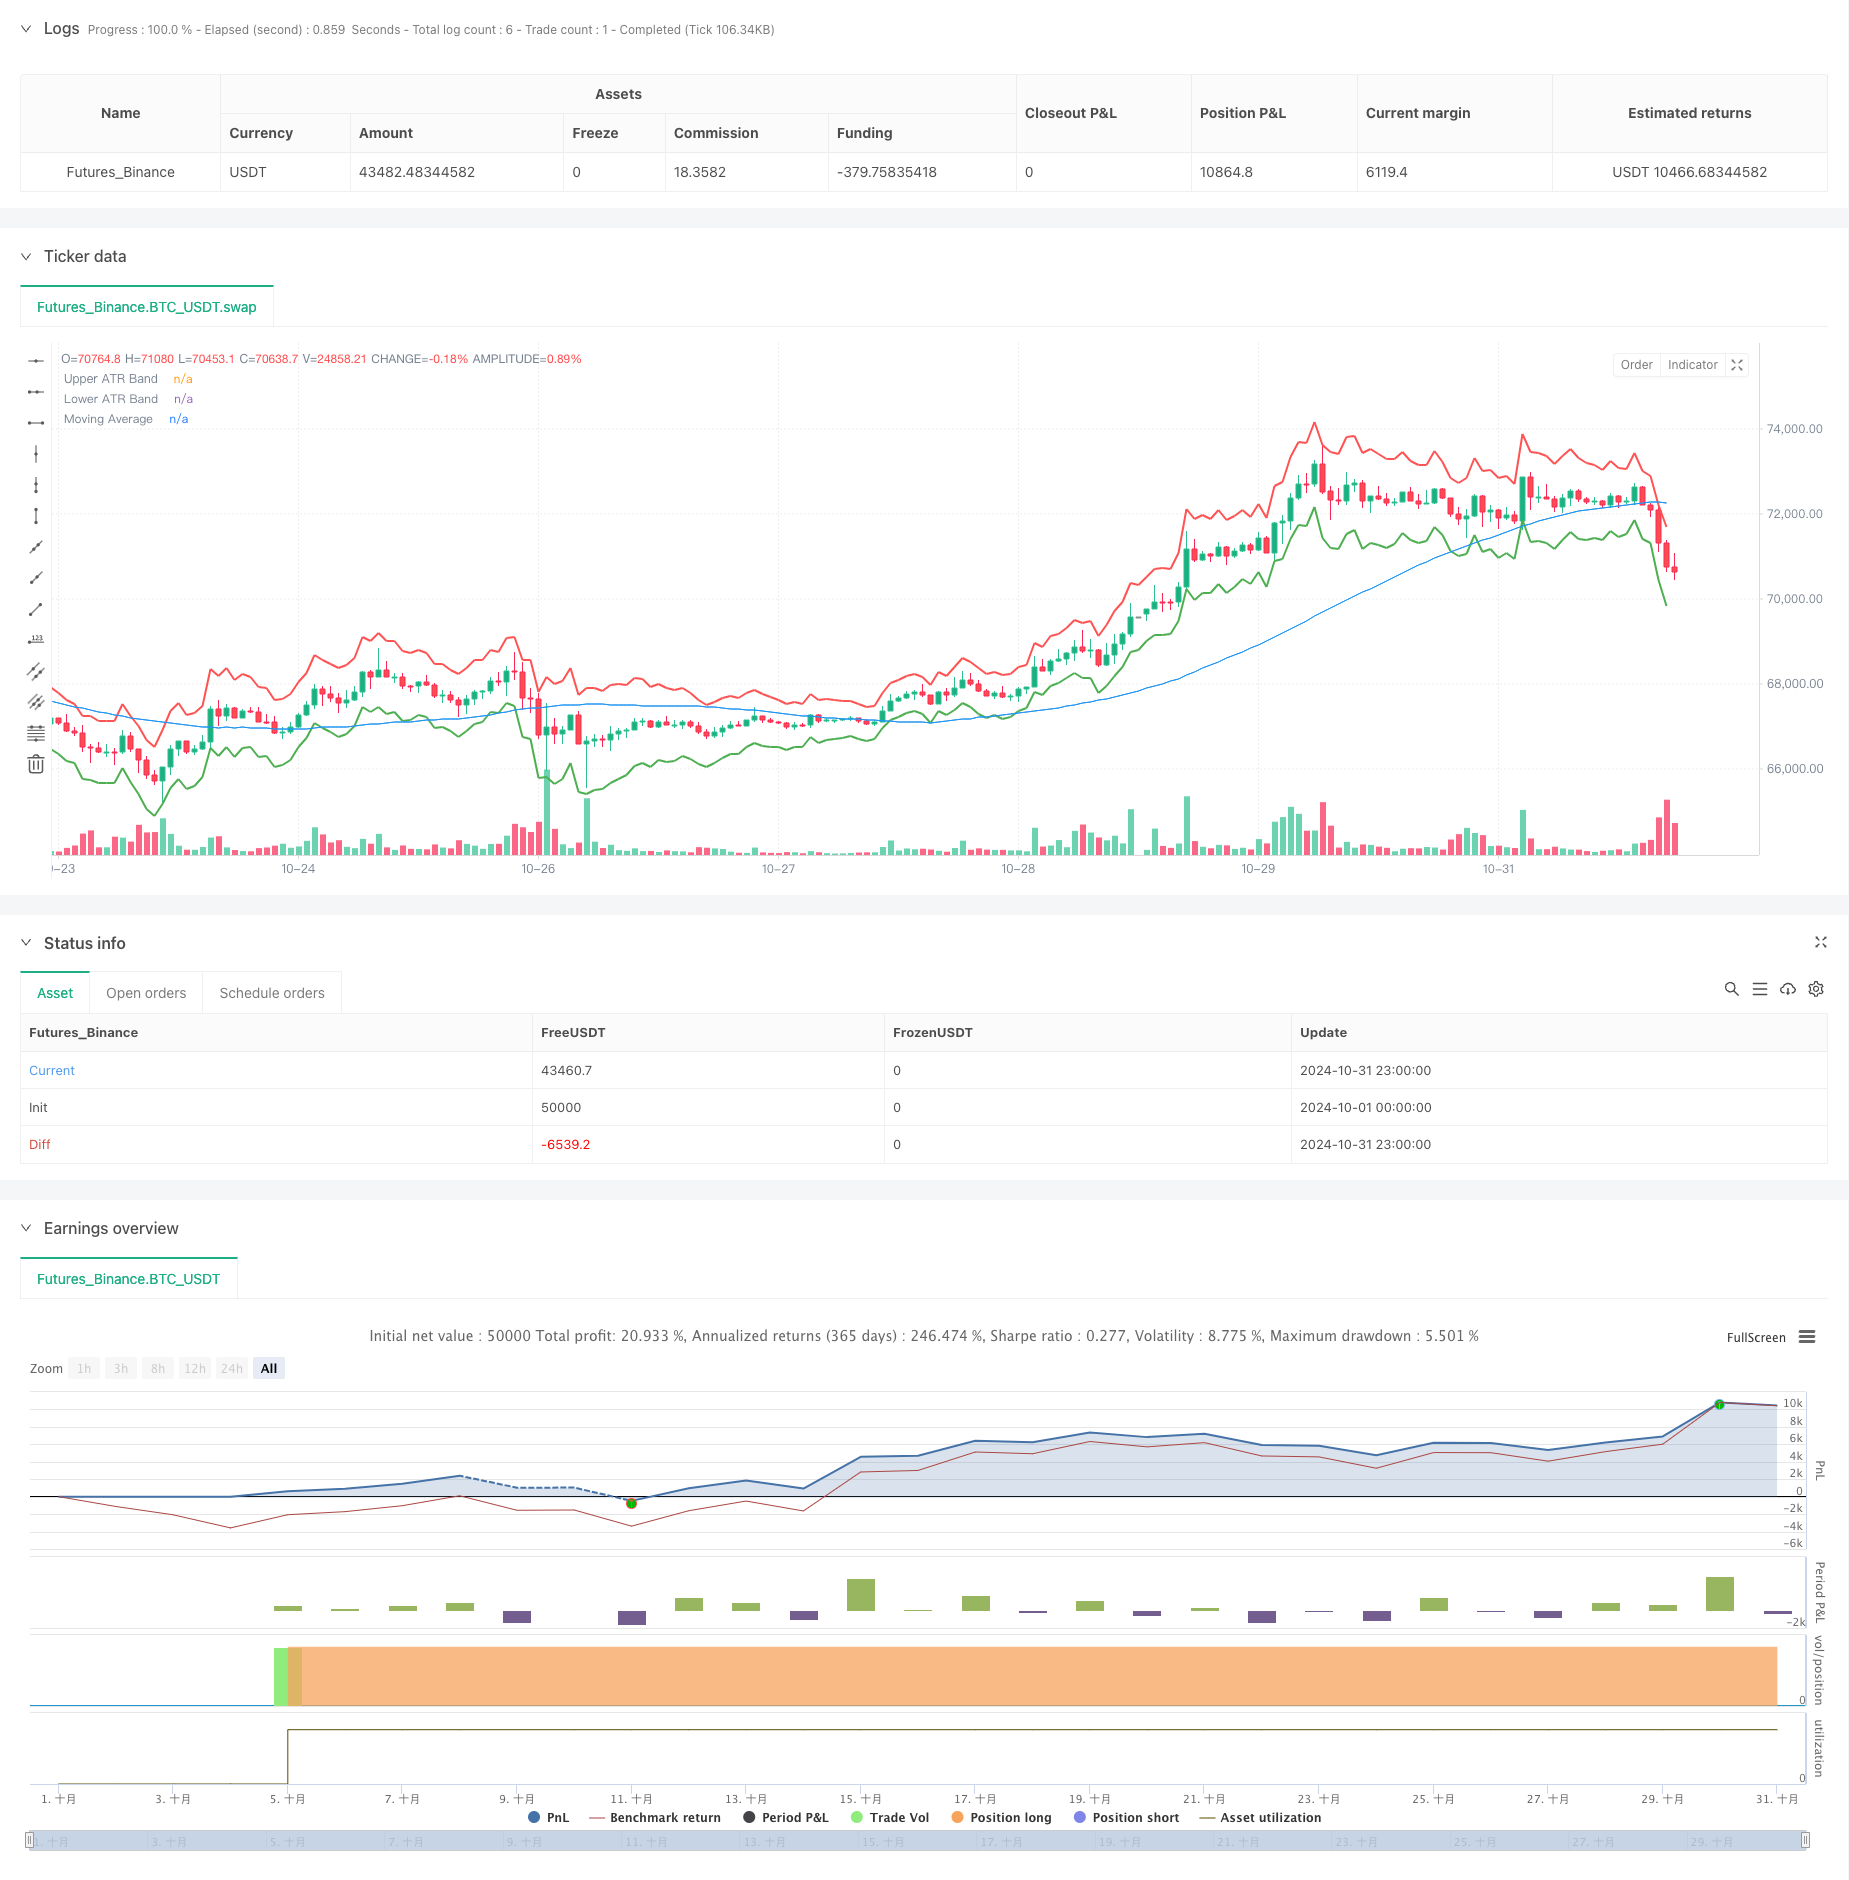
ATR 변동성 및 퇴출 전략에 따른 이동평균 기반 적응 추세
저자:차오장, 날짜: 2024-11-27 14:07:11태그:ATRSMAMABAND

전반적인 설명
이 전략은 ATR (Average True Range) 밴드 및 이동 평균에 기반한 트렌드 다음 전략이다. 이 전략은 ATR 지표를 활용하여 수익 취득 및 스톱 로스 포지션을 동적으로 조정하며, 이동 평균을 사용하여 시장 트렌드 방향을 결정하고 트렌드 캡처 및 리스크 통제를 달성합니다. 전략의 핵심은 동적인 출구 메커니즘으로 ATR 밴드를 사용하여 전략이 시장 변동성 변화에 따라 위치 출구 지점을 적응적으로 조정 할 수 있습니다.
전략 원칙
이 전략은 세 가지 핵심 요소로 구성되어 있습니다.
- ATR 폭계 계산: 14주기 ATR 지표를 사용하여 현재 종료 가격에서 ATR 값의 2배를 더하고 빼면서 상위 및 하위 변동 폭계를 구성합니다.
- 이동 평균 시스템: 트렌드 판단의 기초로 50기 간 간단한 이동 평균 (SMA) 을 사용합니다.
- 무역 신호 생성:
- 엔트리 신호: 가격이 이동 평균을 넘어서면 긴 포지션을 시작합니다.
- 출구 신호: 가격이 ATR 상위 또는 하위 범위에 닿을 때 포지션을 닫습니다.
이 전략은 트렌드 추적과 변동성 관리를 결합하여 시장 트렌드 포착과 시장 변동성 변화에 기초한 동적 위험 노출 조정을 가능하게 합니다.
전략적 장점
- 강한 적응력: ATR 지표는 시장 변동성 변화에 따라 수익 취득 및 스톱 로스 포지션을 자동으로 조정하여 시장의 좋은 적응력을 제공합니다.
- 합리적인 리스크 제어: ATR 곱셈값 설정을 통해 각 거래에 대한 리스크 노출을 효과적으로 제어합니다.
- 강력한 트렌드 캡처: 이동 평균을 통합하여 시장 트렌드 방향을 효과적으로 식별합니다.
- 유연한 매개 변수 설정: ATR 기간, 멀티플리커 및 이동 평균 기간을 조정하여 다른 시장 환경에 적응 할 수 있습니다.
- 명확한 실행 논리: 정확한 입출입 조건은 주관적인 판단의 간섭을 피합니다.
전략 위험
- 불규칙 시장 위험: 부상 시장에서 빈번한 잘못된 신호를 생성하여 과도한 거래 비용을 초래할 수 있습니다.
- 슬리퍼 리스크: 실제 실행 가격은 극심한 시장 변동성 중 이론 가격과 크게 다를 수 있습니다.
- 트렌드 역전 위험: 시장 트렌드가 갑자기 역전되면 적시에 손실을 멈추지 않을 수 있습니다.
- 매개 변수 최적화 위험: 최적 매개 변수는 다른 시장 환경에서 크게 다를 수 있습니다.
전략 최적화 방향
-
트렌드 강도 필터링을 포함:
- ADX 또는 DMI와 같은 트렌드 강도 지표를 추가하여 약한 트렌드 환경에서 거래 신호를 필터합니다.
- 더 큰 수익 잠재력을 포착하기 위해 강한 트렌드 환경에서 ATR 곱셈을 조정하십시오.
-
포지션 관리 개선:
- ATR 값에 따라 위치 크기를 동적으로 조정합니다.
- 단계적 위치 구축 및 감소 메커니즘을 구현합니다.
-
시장 환경 인식 추가:
- 변동성 주기 분석을 소개합니다.
- 시장 패턴 인식 모듈을 추가합니다.
-
출구 메커니즘 최적화:
- 동적 수익 보호
- 시간 기반의 스톱 로스 메커니즘을 추가합니다.
요약
이 전략은 ATR 대역과 이동 평균을 결합하여 적응적이고 위험 제어 트렌드 다음 시스템을 구축합니다. 핵심 장점은 이동 평균을 통해 시장 트렌드 방향을 파악하는 동안 시장 변동성 변화에 따라 위험 제어 포지션을 동적으로 조정하는 능력에 있습니다. 내재적인 위험이 있지만 제안된 최적화 방향은 전략 안정성과 수익성을 더욱 향상시킬 수 있습니다. 이것은 실전적 가치있는 전략 프레임워크입니다. 라이브 거래에서 심층 연구 및 응용에 적합합니다.
/*backtest
start: 2024-10-01 00:00:00
end: 2024-10-31 23:59:59
period: 1h
basePeriod: 1h
exchanges: [{"eid":"Futures_Binance","currency":"BTC_USDT"}]
*/

//@version=5
strategy("ATR Band Exit Strategy", overlay=true)

// Define input parameters
atrLength = input(14, title="ATR Length")
atrMultiplier = input(2.0, title="ATR Multiplier")
maLength = input(50, title="Moving Average Length")

// Calculate ATR and moving average
atrValue = ta.atr(atrLength)
maValue = ta.sma(close, maLength)

// Calculate upper and lower ATR bands
upperBand = close + atrMultiplier * atrValue
lowerBand = close - atrMultiplier * atrValue

// Plot ATR bands
plot(upperBand, title="Upper ATR Band", color=color.red, linewidth=2)
plot(lowerBand, title="Lower ATR Band", color=color.green, linewidth=2)

// Entry condition (for demonstration: long if price above moving average)
longCondition = ta.crossover(close, maValue)
if (longCondition)
    strategy.entry("Long", strategy.long)

// Exit conditions (exit if price crosses the upper or lower ATR bands)
if (close >= upperBand)
    strategy.close("Long", comment="Exit on Upper ATR Band")
if (close <= lowerBand)
    strategy.close("Long", comment="Exit on Lower ATR Band")

// Optional: Plot the moving average for reference
plot(maValue, title="Moving Average", color=color.blue)
관련
- MA, SMA, MA 슬로프, 트래일링 스톱 손실, 재입구
- 동적 ATR Stop Loss and Take Profit 이동 평균 크로스오버 전략
- 동적 변동성 지수 (VIDYA) 는 ATR 트렌드를 따르는 역전 전략과 함께
- 알파 트렌드와 이동 평균 필터와 함께 높은/낮은 브레이크업 전략
- 동적 리스크 관리와 함께 두 가지 이동 평균 크로스오버 전략
- 지능적인 시간 기반의 장기 단기 회전 균형 거래 전략
- 다중 지표 융합 평균 반전 추세 전략
- 동적 이동 평균 및 고정 스톱 손실 최적화 모델과 볼링거 밴드 교차 전략
- ATR 기반의 멀티 트렌드 추후 전략, 수익을 취하고 손실을 멈추는 최적화 시스템
- 후속 스톱 로스 전략과 함께 적응적인 이동 평균 크로스오버
더 많은
- 모멘텀 오시레이터 기반의 전략을 따르는 적응 트렌드
- PVT-EMA 트렌드 크로스오버 부피 가격 전략
- MACD-EMA 다기 동적 크로스오버 양적 거래 시스템
- MACD 동적 오스실레이션 크로스 예측 전략
- VWAP-ATR 동적 가격 행동 거래 시스템
- 볼링거 밴드 및 RSI 크로스 기반의 동적 트렌드 양적 전략
- 볼링거 밴드, RSI 및 ATR 기반의 동적 스톱 로스 시스템과 함께 평균 반전 전략
- 파라볼 SAR 지표에 기반한 동적 거래 전략 시스템
- 적응성 변동성 및 동력 양적 거래 시스템 (AVMQTS)
- 보린거 밴드 및 촛불 패턴에 기초한 고급 트렌드 거래 전략
- 풀 보디 촛불 신호 시스템으로 듀얼 EMA 모멘텀 트렌드 거래 전략
- RSI 최적화 시스템으로 듀얼 타임프레임 슈퍼트렌드
- 이중 이동 평균 크로스오버 트렌드 동적 스톱 로스 및 영업 취득 시스템 전략
- ATR 및 MACD 통합과 함께 거래 시스템을 따르는 다중 시간 프레임 트렌드
- 이중 시간 프레임 슈퍼 트렌드 RSI 지능형 거래 전략
- 이중 MACD 가격 행동 브레이크 트래일링 전략
- 멀티 EMA 트렌드 모멘텀 인식 및 스톱 로스 거래 시스템
- 양적 거래에 대한 이중 EMA 볼륨 트렌드 확인 전략
- 이중 EMA-RSI 크로스오버 전략
- 거래 체계를 따르는 증강된 다기동적 적응 추세