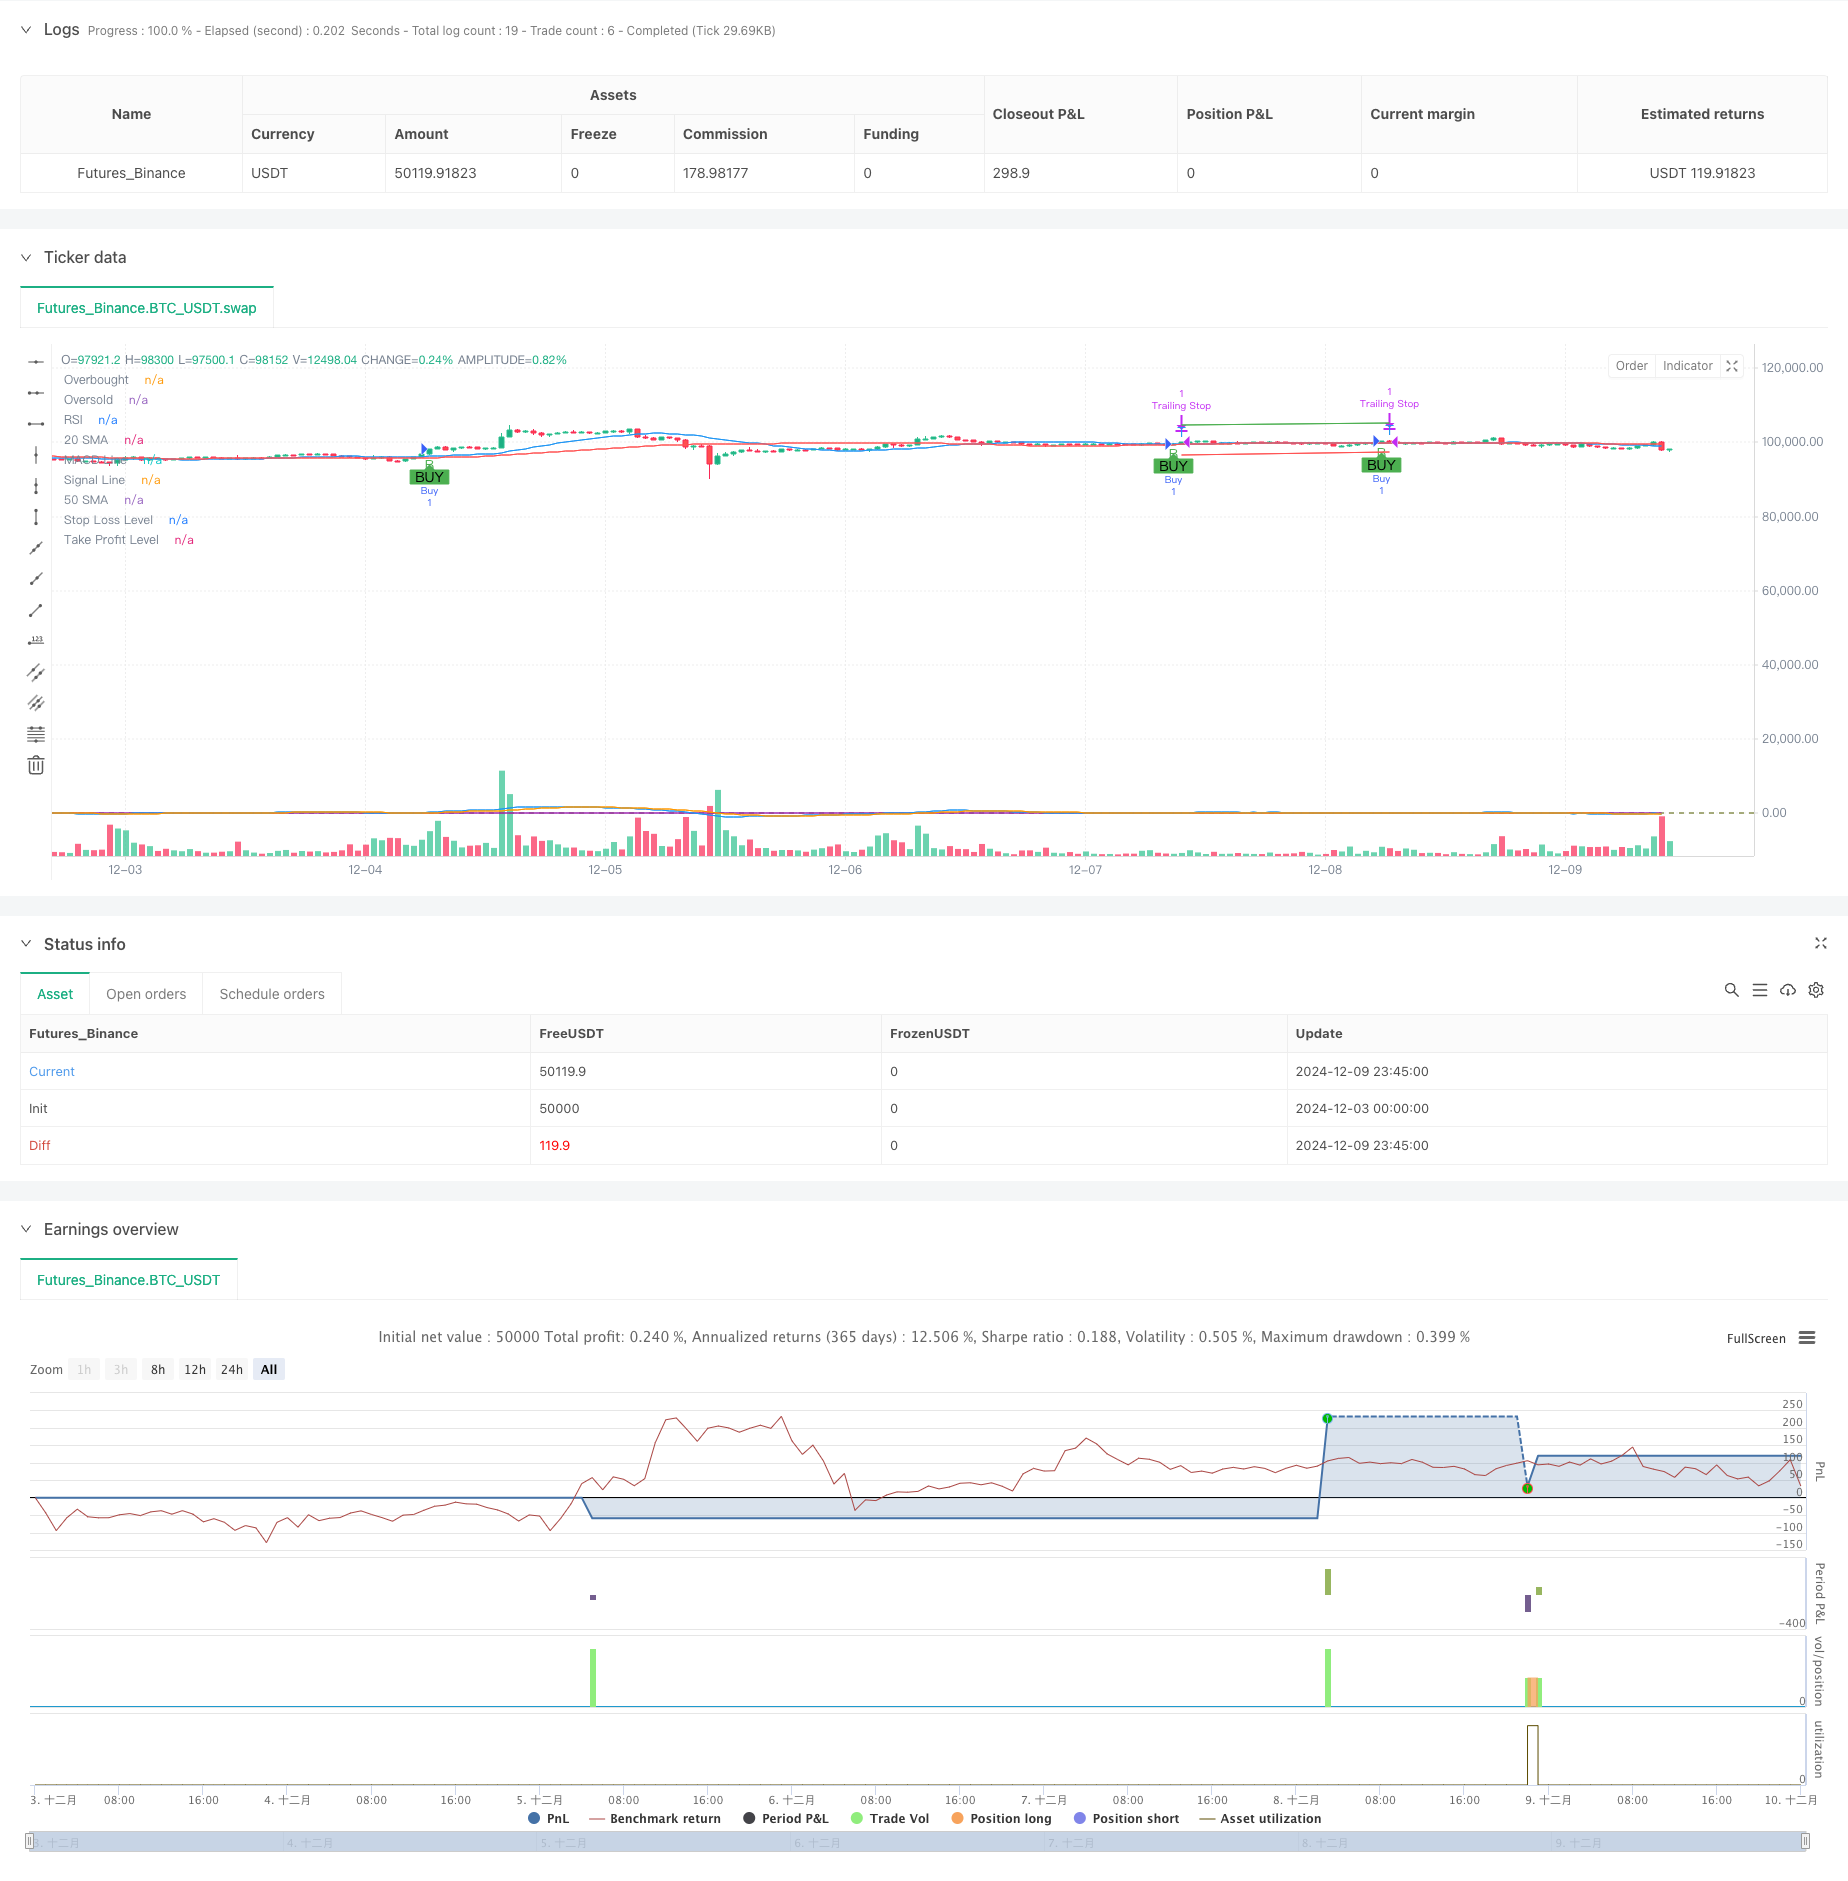
거래 전략에 따른 다기술 지표 트렌드
저자:차오장, 날짜: 2024-12-12 11:00:01태그:RSIMACDSMATPSLTS

전반적인 설명
이 전략은 여러 가지 기술적 지표를 결합한 트렌드-추천 거래 시스템입니다. 시장 트렌드가 명확하게 정의 될 때 거래를 실행하기 위해 RSI (비례 강도 지수), MACD (동기 평균 컨버전스 디버전스) 및 SMA (단순 이동 평균) 를 통합합니다. 이 전략은 또한 더 나은 리스크 관리를 위해 수익을 취하고, 손실을 멈추고, 후속 중지 메커니즘을 통합합니다.
전략 원칙
이 전략은 다음과 같은 핵심 조건에 따라 거래를 실행합니다. 1. MACD는 황금색 십자가를 나타냅니다. 2. RSI 는 70 이하 로, 과잉 구매 된 영역 을 피 합니다. 3. 가격은 단기 이동 평균 (20일 SMA) 보다 높습니다. 4. 단기 이동 평균은 장기 이동 평균 (50 일 SMA) 보다 높습니다.
이 모든 조건이 동시에 충족되면 시스템은 긴 신호를 생성합니다. 또한 전략은 5%의 수익 목표, 3%의 스톱 로스 제한, 그리고 2%의 트레일링 스톱을 설정하여 축적된 이익을 보호합니다. 거래 조건에 대한 이러한 다층 접근 방식은 정확성과 보안을 향상시키는 데 도움이됩니다.
전략적 장점
- 여러 가지 기술 지표의 통합은 신호 신뢰성을 향상시킵니다.
- RSI 필터링은 과잉 매입 지역에 진입을 방지합니다.
- 이동 평균 체계는 중장기 동향을 확인하는 데 도움이 됩니다.
- 고정 및 후속 정지까지 포함하는 포괄적 인 위험 관리 시스템
- 다양한 시장 조건에 따른 유연한 매개 변수 조정
- 백테스팅 및 라이브 거래용 사용자 정의 가능한 날짜 범위
전략 위험
- 여러 가지 지표로 인해 신호가 지연될 수 있습니다.
- 다양한 시장에서 잘못된 신호가 발생할 수 있습니다.
- 고정된 수익 및 손해 중지 수준은 모든 시장 조건에 적합하지 않을 수 있습니다.
- 트레일링 스톱은 불안정한 시장에서 수익성있는 거래를 너무 일찍 종료 할 수 있습니다. 감축 조치로는: 지표 매개 변수를 조정하고, 시장 특성에 대한 이익/손실 비율을 조정하고, 시장 환경 필터를 추가합니다.
최적화 방향
- 적응 수익/손실 수준에 대한 변동성 지표 (ATR과 같은) 를 포함합니다.
- 신호 강도를 검증하기 위해 볼륨 표시기를 추가합니다.
- 매개 변수 적응을 위한 시장 상황 분석을 실시
- 더 시시한 신호를 위해 MACD 매개 변수를 최적화
- 짧은 포지션에 대한 반전 신호를 추가하는 것을 고려하십시오. 이러한 최적화는 전략의 적응력과 안정성을 향상시킬 것입니다.
요약
이 전략은 여러 기술적 지표의 조합을 통해 포괄적인 거래 시스템을 구축합니다. 트렌드 다음 논리 및 리스크 관리 고려 사항을 모두 포함합니다. 최적화 할 수있는 영역이 있지만 전반적인 프레임워크는 좋은 확장성과 적응력을 제공합니다. 성공적인 구현은 거래자가 실제 시장 조건에 따라 매개 변수를 최적화하고 전략을 개선해야합니다.
/*backtest
start: 2024-12-03 00:00:00
end: 2024-12-10 00:00:00
period: 45m
basePeriod: 45m
exchanges: [{"eid":"Futures_Binance","currency":"BTC_USDT"}]
*/

//@version=5
strategy("Flexible Swing Trading Strategy with Trailing Stop and Date Range", overlay=true)

// Input parameters
rsiPeriod = input.int(14, title="RSI Period")
macdFastLength = input.int(12, title="MACD Fast Length")
macdSlowLength = input.int(26, title="MACD Slow Length")
macdSignalSmoothing = input.int(9, title="MACD Signal Smoothing")
smaShortPeriod = input.int(20, title="Short-term SMA Period")
smaLongPeriod = input.int(50, title="Long-term SMA Period")
takeProfitPercent = input.float(5.0, title="Take Profit Percentage")
stopLossPercent = input.float(3.0, title="Stop Loss Percentage")
trailingStopPercent = input.float(2.0, title="Trailing Stop Percentage")

// Date range inputs
startDate = input(timestamp("2023-01-01 00:00"), title="Start Date")
endDate = input(timestamp("2023-12-31 23:59"), title="End Date")

// Calculate RSI
rsi = ta.rsi(close, rsiPeriod)

// Calculate MACD
[macdLine, signalLine, _] = ta.macd(close, macdFastLength, macdSlowLength, macdSignalSmoothing)

// Calculate SMAs
smaShort = ta.sma(close, smaShortPeriod)
smaLong = ta.sma(close, smaLongPeriod)

// Buy condition
buyCondition = ta.crossover(macdLine, signalLine) and rsi < 70 and close > smaShort and smaShort > smaLong

// Execute buy orders within the date range
if (buyCondition )
    strategy.entry("Buy", strategy.long)

// Calculate take profit and stop loss levels
takeProfitLevel = strategy.position_avg_price * (1 + takeProfitPercent / 100)
stopLossLevel = strategy.position_avg_price * (1 - stopLossPercent / 100)

// Set take profit, stop loss, and trailing stop
strategy.exit("Take Profit", "Buy", limit=takeProfitLevel)
strategy.exit("Stop Loss", "Buy", stop=stopLossLevel)
strategy.exit("Trailing Stop", "Buy", trail_price=close * (1 - trailingStopPercent / 100), trail_offset=trailingStopPercent / 100)

// Plot Buy signals
plotshape(series=buyCondition, location=location.belowbar, color=color.green, style=shape.labelup, text="BUY")

// Plot SMAs
plot(smaShort, color=color.blue, title="20 SMA")
plot(smaLong, color=color.red, title="50 SMA")

// Plot MACD and Signal Line
plot(macdLine, color=color.blue, title="MACD Line")
plot(signalLine, color=color.orange, title="Signal Line")

// Plot RSI
hline(70, "Overbought", color=color.red)
hline(30, "Oversold", color=color.green)
plot(rsi, color=color.purple, title="RSI")

// Debugging plots
plotchar(buyCondition , char='B', location=location.belowbar, color=color.green, size=size.small)
plotchar(strategy.opentrades > 0, char='T', location=location.abovebar, color=color.blue, size=size.small)
plot(stopLossLevel, color=color.red, title="Stop Loss Level")
plot(takeProfitLevel, color=color.green, title="Take Profit Level")
관련
- 부피 기반의 동적 DCA 전략
- 멀티 타겟 지능형 볼륨 모멘텀 거래 전략
- 이중 이동 평균 트렌드 RSI 필터와 전략에 따라
- 이중 이동 평균-RSI 시너지 옵션 양적 거래 전략
- RSI 트렌드 모멘텀 추적 전략과 이동 평균 크로스오버
- RSI 다이내믹 트레일링 스톱 로스 양적 거래 전략과 함께 멀티-MA 크로스오버
- RSI와 이동 평균의 결합된 양적 거래 전략에 따른 경향
- 동적 ATR Stop-Loss RSI 과잉 매출 리바운드 양적 전략
- 다중 지표 동적 거래 전략
- RSI 필터와 OBV-SMA 크로스오버 다차원 모멘텀 거래 전략
더 많은
- 적립적 인 후속 인수 균형 잡힌 거래 전략, 영업 취득 및 중단 손실
- 증강된 트렌드 추적 시스템: ADX 및 파라볼 SAR를 기반으로 동적 트렌드 식별
- 이중 시간 프레임 스토카스틱 모멘텀 거래 전략
- 적응적인 볼링거 밴드 역동적 포지션 관리 전략
- 동적 RSI 스마트 타이밍 스윙 거래 전략
- 촛불 흡수 패턴 분석에 기초한 양방향 거래 전략
- 평균 반전 4H 양적 거래 전략과 함께 볼링거 브레이크
- 동적 격자 위치 크기 전략을 따르는 경향
- 이중적인 BBI (Bulls and Bears Index) 크로스오버 전략
- 이동 평균 크로스오버 신호 시스템으로 동적 장기/단기 스윙 거래 전략
- 고급 변동성 평균 회전 거래 전략: VIX와 이동 평균에 기반한 다차원적 양적 거래 시스템
- 금 트렌드 채널 역전 동력 전략
- 고급 EMA 모멘텀 트렌드 거래 전략
- 다중 MA 트렌드 강도 거래 전략 - MA 오차에 기반한 유연한 스마트 거래 시스템
- 부피 가중화된 이중 경향 감지 시스템
- 다중 요인 역동 트렌드 거래 전략
- 강화된 모멘텀 오시레이터 및 스토카스틱 디버전스 양적 거래 전략
- 트렌드 브레이크 트레이딩 전략으로 멀티 타임프레임 피보나치 리트레이싱
- 다중 지표 트렌드 수익 최적화 전략
- 프랙탈 브레이크업 모멘텀 거래 전략