Strategi Perpindahan MACD
Penulis:ChaoZhang, Tarikh: 2024-04-18 17:56:23Tag:EMAMA

Ringkasan
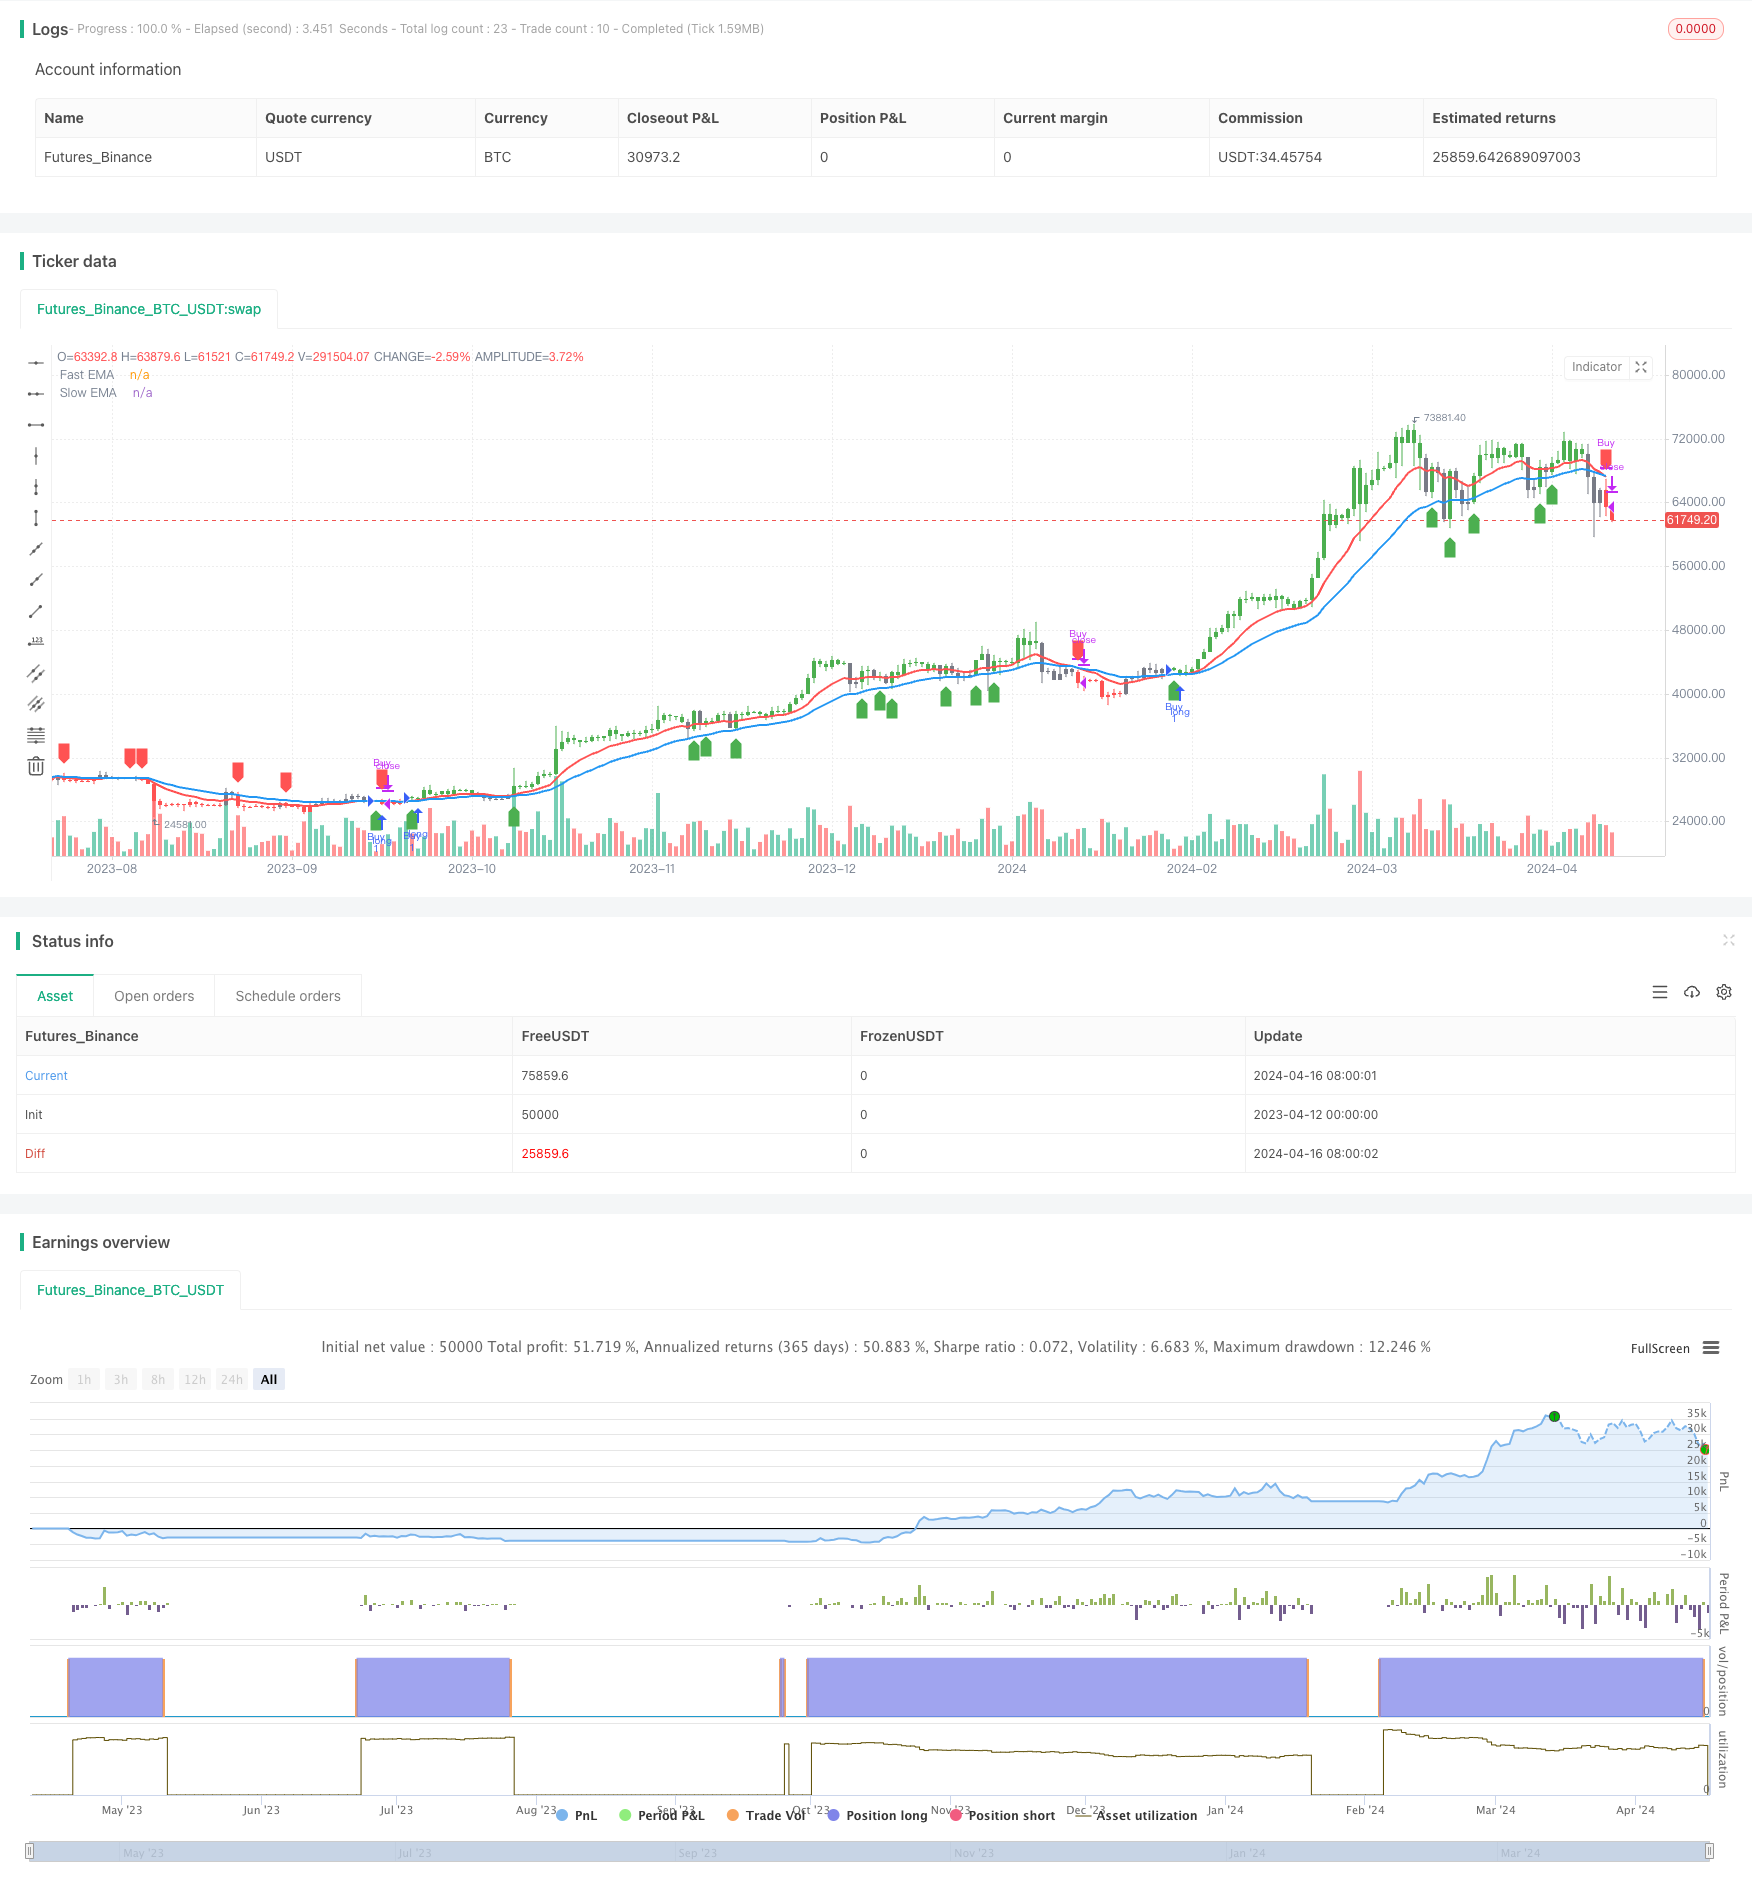
Strategi ini menggunakan persilangan dua purata bergerak eksponensial (EMA) dengan tempoh yang berbeza untuk menjana isyarat dagangan. Apabila EMA pantas melintasi di atas EMA perlahan, ia menjana isyarat beli, dan apabila EMA pantas melintasi di bawah EMA perlahan, ia menjana isyarat jual. Strategi ini boleh digunakan untuk pelbagai instrumen kewangan dan jangka masa, seperti emas yang paling berkesan pada jangka masa 2 jam dan Bitcoin yang paling berkesan pada carta harian, dll.
Prinsip Strategi
- Mengira EMA pantas (periode lalai adalah 12) dan EMA perlahan (periode lalai adalah 26).
- Tentukan zon bullish (EMA pantas di atas EMA perlahan dan harga di atas EMA pantas) dan zon bearish (EMA pantas di bawah EMA perlahan dan harga di bawah EMA pantas).
- Beli semasa peralihan dari zon penurunan ke zon kenaikan, dan jual semasa peralihan dari zon kenaikan ke zon penurunan.
- Tandai zon menaik dan menurun pada carta dengan warna hijau dan merah, dan gunakan anak panah untuk menandakan isyarat beli dan jual.
Kelebihan Strategi
- Sederhana dan mudah difahami, sesuai untuk pemula belajar.
- Digunakan secara meluas, boleh digunakan untuk pelbagai instrumen kewangan dan jangka masa.
- Keupayaan trend yang kuat, mampu menangkap trend jangka sederhana hingga panjang.
- Parameter yang boleh diselaraskan, meningkatkan fleksibiliti.
Risiko Strategi
- Rendah untuk menghasilkan isyarat palsu di pasaran yang bergelora, yang membawa kepada kerugian.
- Perlahan bertindak balas pada pembalikan trend, mengakibatkan beberapa slippage.
- Pemilihan parameter yang tidak betul akan menjejaskan prestasi strategi.
Arahan Pengoptimuman Strategi
- Tambah penapis trend, seperti hanya berdagang apabila ADX melebihi nilai tertentu, untuk mengurangkan kerugian di pasaran yang bergelombang.
- Mengoptimumkan masa masuk dan keluar, seperti menggunakan ATR untuk menentukan stop-loss dan mengambil keuntungan, mengurangkan kerugian perdagangan tunggal.
- Mengoptimumkan parameter untuk mencari kombinasi terbaik, meningkatkan kestabilan dan keuntungan.
- Gabungkan dengan penunjuk lain untuk penilaian tambahan, seperti MACD, RSI, dll., untuk meningkatkan ketepatan isyarat.
Ringkasan
Strategi persilangan MACD adalah strategi mudah berdasarkan trend berikut. Kelebihannya adalah kesederhanaan, kepraktisan, dan penerapan yang luas, sementara kekurangannya adalah kesukaran dalam memahami pembalikan trend dan pemilihan parameter. Melalui penapisan trend, mengoptimumkan titik masuk dan keluar, pengoptimuman parameter, dan menggabungkan penunjuk lain, prestasi strategi ini dapat ditingkatkan, yang bernilai penyelidikan dan ujian lanjut.
/*backtest
start: 2023-04-12 00:00:00
end: 2024-04-17 00:00:00
period: 1d
basePeriod: 1h
exchanges: [{"eid":"Futures_Binance","currency":"BTC_USDT"}]
*/

//@version=5
strategy('Advance EMA Crossover Strategy', overlay=true, precision=6)
//****************************************************************************//
// CDC Action Zone is based on a simple EMA crossover
// between [default] EMA12 and EMA26
// The zones are defined by the relative position of
// price in relation to the two EMA lines
// Different zones can be use to activate / deactivate
// other trading strategies
// The strategy can also be used on its own with
// acceptable results, buy on the first green candle
// and sell on the first red candle
//****************************************************************************//
// Define User Input Variables

xsrc = input(title='Source Data', defval=close)
xprd1 = input(title='Fast EMA period', defval=12)
xprd2 = input(title='Slow EMA period', defval=26)
xsmooth = input(title='Smoothing period (1 = no smoothing)', defval=1)
fillSW = input(title='Paint Bar Colors', defval=true)
fastSW = input(title='Show fast moving average line', defval=true)
slowSW = input(title='Show slow moving average line', defval=true)
plotSigsw = input(title='Plot Buy/Sell Signals?', defval=true)

//****************************************************************************//
//Calculate Indicators

xPrice = ta.ema(xsrc, xsmooth)

FastMA = ta.ema(xPrice, xprd1)
SlowMA = ta.ema(xPrice, xprd2)

//****************************************************************************//
// Define Color Zones and Conditions

BullZone = FastMA > SlowMA and xPrice > FastMA  // Bullish Zone
BearZone = FastMA < SlowMA and xPrice < FastMA  // Bearish Zone

//****************************************************************************//
// Strategy Entry and Exit Conditions

if (BullZone and not BullZone[1])
    strategy.entry("Buy", strategy.long)  // Buy on the transition into BullZone

if (BearZone and not BearZone[1])
    strategy.close("Buy")  // Sell on the transition into BearZone

//****************************************************************************//
// Display color on chart

plotcolor = BullZone ? color.green : BearZone ? color.red : color.gray
barcolor(color=fillSW ? plotcolor : na)

//****************************************************************************//
// Plot Fast and Slow Moving Averages

plot(fastSW ? FastMA : na, color=color.red, title="Fast EMA", linewidth=2)
plot(slowSW ? SlowMA : na, color=color.blue, title="Slow EMA", linewidth=2)

//****************************************************************************//
// Plot Buy and Sell Signals

plotshape(series=plotSigsw and BullZone and not BullZone[1], location=location.belowbar, color=color.green, style=shape.labelup, title="Buy Signal")
plotshape(series=plotSigsw and BearZone and not BearZone[1], location=location.abovebar, color=color.red, style=shape.labeldown, title="Sell Signal")

//****************************************************************************//
- Strategi Posisi Sepanjang Malam Pasar dengan Penapis EMA
- EMA Dual Moving Average Crossover Strategi
- Strategi Perdagangan Momentum EMA
- Strategi Dagangan Crossover EMA Bertiga dengan Stop-Loss dan Take-Profit Dinamik
- Trend Momentum Crossover Multi-EMA Berikutan Strategi
- Sistem Perdagangan Automatik Multi-EMA dengan Kunci Keuntungan Terakhir
- Trend EMA Bertiga Berikutan Strategi Dagangan Kuantitatif
- Strategi Trend EMA Multi-Timeframe dengan Sistem Penembusan Tinggi-Rendah Harian
- Trend Crossover Multi-EMA Berikutan Strategi Dagangan Kuantitatif
- Sistem Perdagangan Pengesanan EMA Dual Chain Hybrid Momentum
- Strategi Penangkapan Trend dengan Penembusan Garis Horizontal
- Pertukaran purata bergerak dengan strategi keuntungan mengambil berbilang
- MACD Golden Cross dan Death Cross Strategi
- MACD-V dan Fibonacci Multi-Timeframe Dynamic Take Profit Strategi
- Strategi Penangkap Trend
- Strategi Dagangan Kuantitatif Berdasarkan Purata Bergerak dan Bollinger Bands
- Strategi Penembusan Bollinger Bands
- Dual Timeframe Momentum Strategi
- MACD BB Strategy Penembusan
- Wavetrend Amplitude Besar Terlalu Dijual Rebound Grid Strategi Perdagangan
- Strategi Mengikuti Trend MACD yang Dioptimumkan dengan Pengurusan Risiko berasaskan ATR
- ZeroLag MACD Strategi Pendek Panjang
- BBSR Strategi Ekstrim
- Strategi Dagangan Pembalikan Frekuensi Tinggi Berdasarkan Indikator Momentum RSI
- Strategi Indeks Kekuatan Relatif RSI
- Strategi Penembusan Bollinger Bands
- Saluran Donchian dan Larry Williams Strategi Indeks Perdagangan Besar
- SPARK Pengukuran Posisi Dinamik dan Strategi Dagangan Indikator Berdua
- Moving Average Crossover + Strategi Momentum Garis Perlahan MACD
- Strategi DCA dinamik berasaskan jumlah