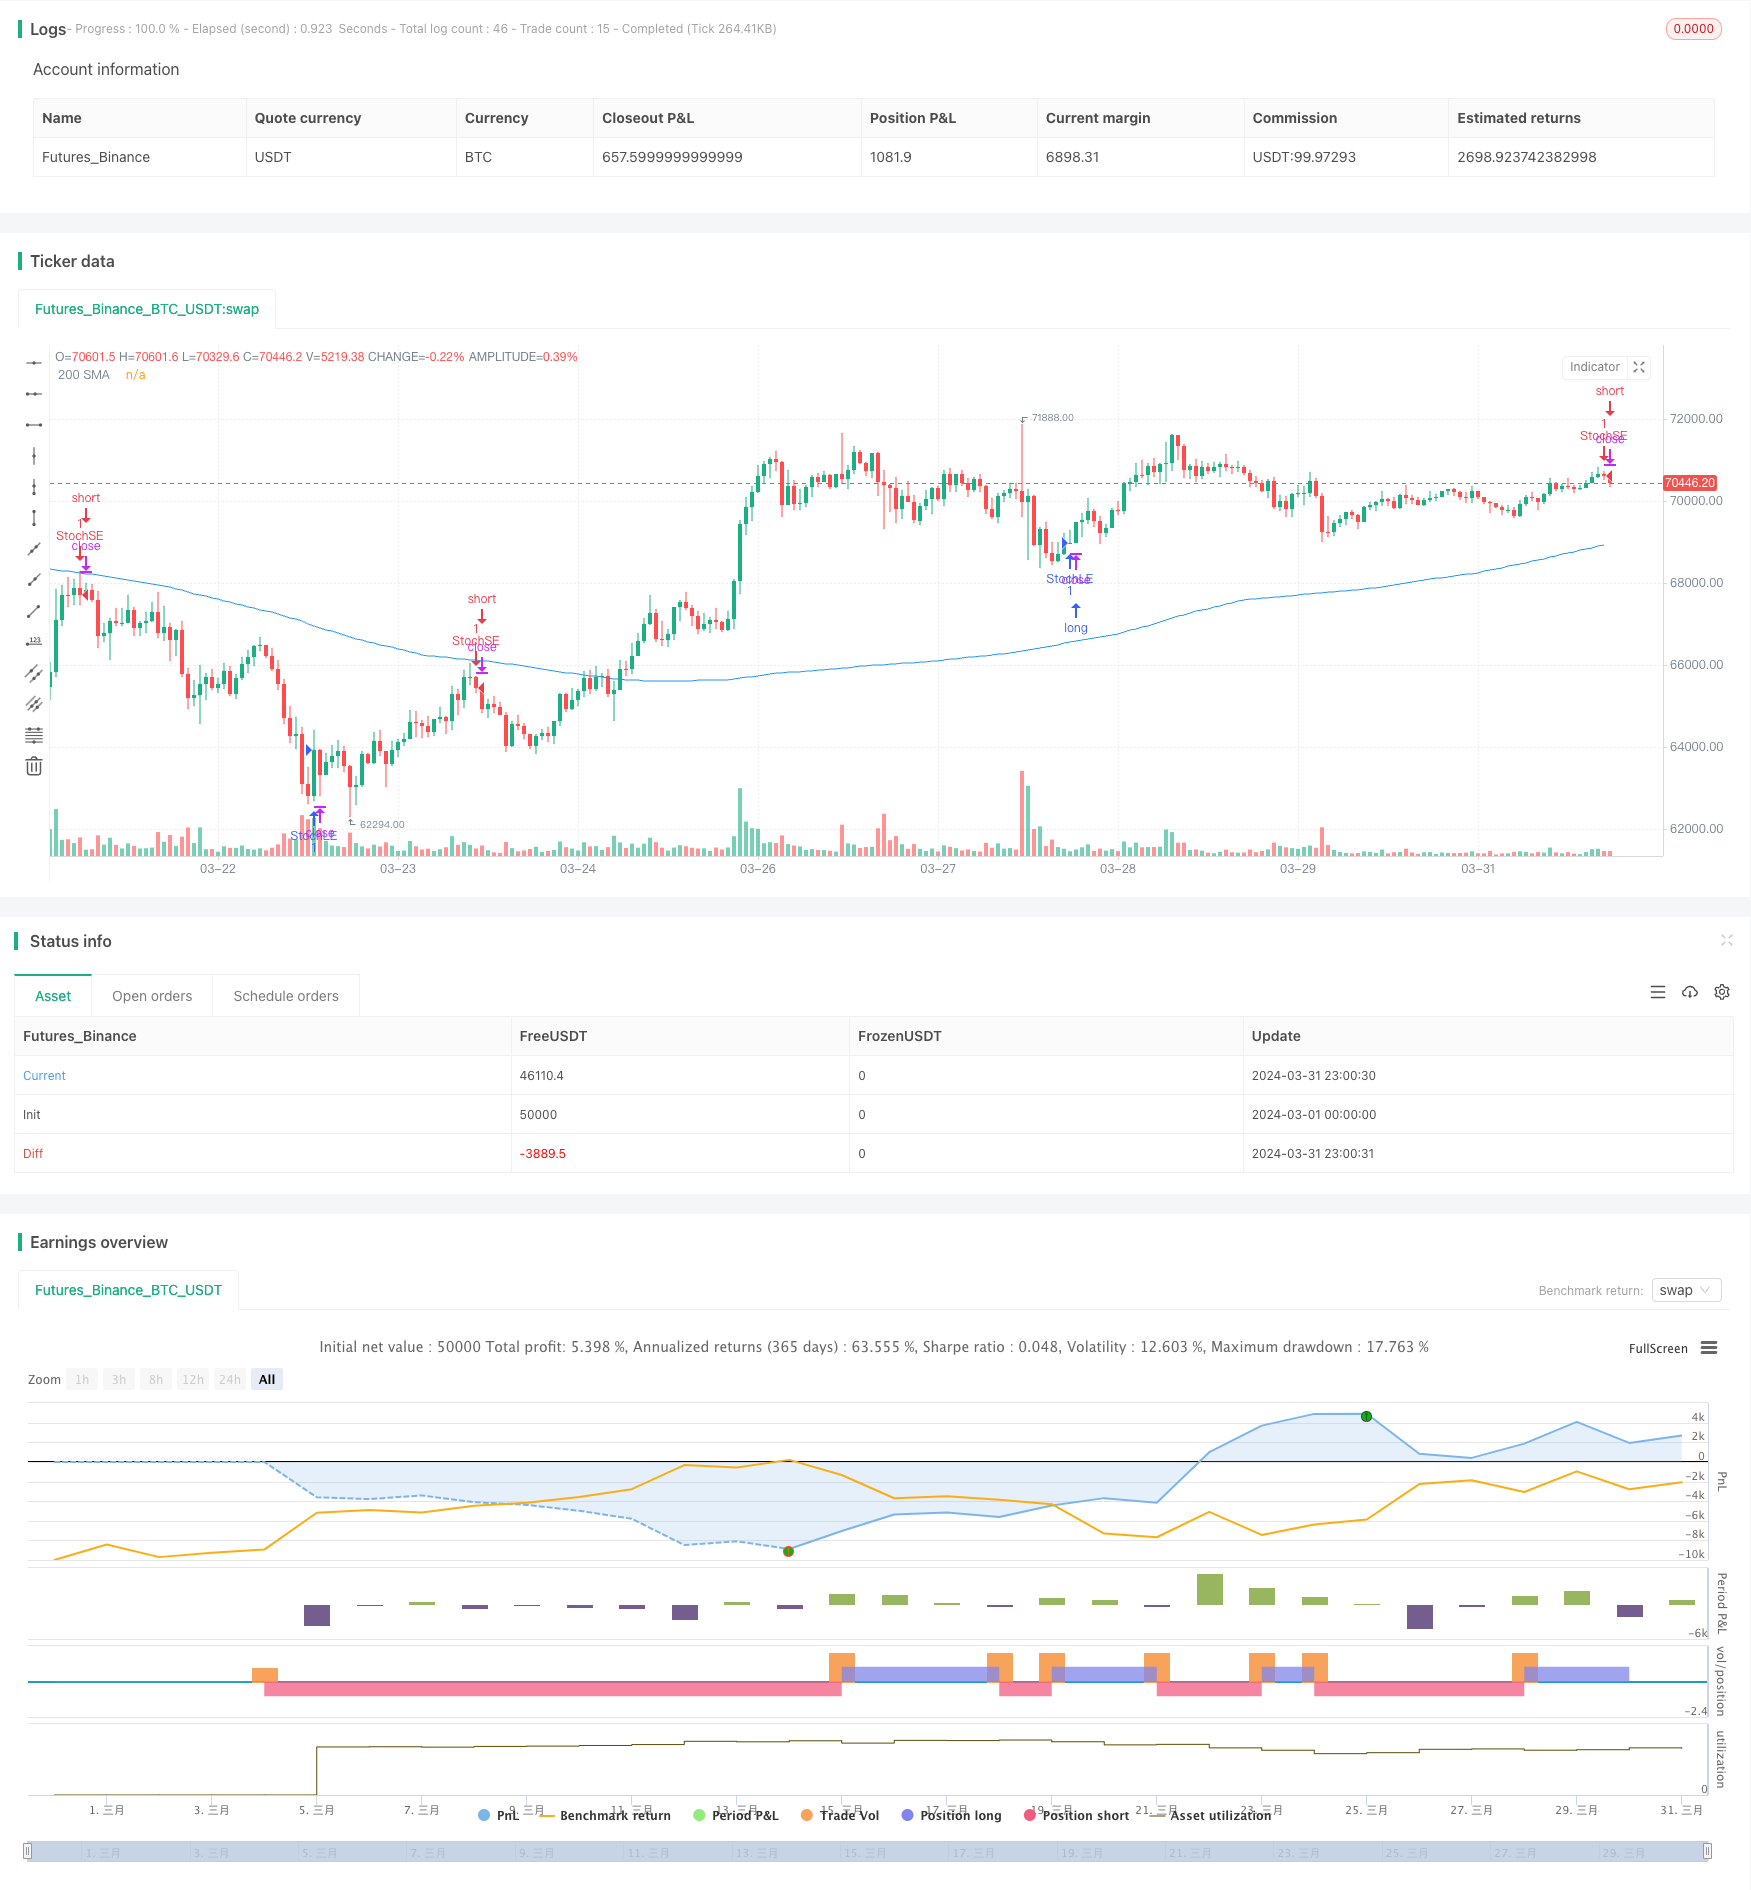
Overview
This strategy utilizes the Stochastic Slow indicator as the primary trading signal, combined with a 200-period Simple Moving Average (SMA) as a trend filter. Additionally, the strategy introduces a dummy Artificial Intelligence (AI) indicator to provide extra entry signals. The main idea is to buy in oversold areas and sell in overbought areas, while ensuring that the price is above the 200 SMA for long entries and below the 200 SMA for short entries, aligning with the current trend. The inclusion of the AI indicator offers more entry opportunities.
Strategy Principles
Calculate the K and D values of the Stochastic Slow indicator, with the K period set to 26 and the D value being a 3-period SMA of the K value.
Set the overbought level (OverBought) to 81, the oversold level (OverSold) to 20, and the minimum K value (minKValue) to 11.
Generate a buy signal when the K line crosses above the D line, and the K value is below the oversold level and above the minimum K value.
Generate a sell signal when the K line crosses below the D line, and the K value is above the overbought level and above the minimum K value.
Use the 200-period SMA as a trend filter, allowing long entries only when the price is above the 200 SMA and short entries when the price is below the 200 SMA.
Introduce a dummy AI indicator (using RSI>50 for bullish and RSI<50 for bearish), entering long when the AI signal is bullish and short when it is bearish.
Combine the signals from the Stochastic indicator, trend filter, and AI indicator to generate the final trading signals.
Set a 10% stop loss for long entries and a 10% stop loss for short entries.
Strategy Advantages
The Stochastic Slow indicator effectively identifies overbought and oversold areas in the market, providing good entry points for trades.
The 200 SMA trend filter ensures that trades align with the current trend, increasing the success rate.
The inclusion of the AI indicator offers more entry opportunities, potentially increasing the strategy’s profitability.
The use of stop-loss orders effectively manages risk.
Strategy Risks
The Stochastic indicator may generate false signals in choppy markets.
The AI indicator is currently a dummy indicator, and its actual effectiveness needs to be verified.
The stop-loss settings may lead to some profits being cut short prematurely.
Strategy Optimization Directions
Optimize the parameters of the Stochastic indicator to find the best period and overbought/oversold threshold settings.
Introduce more complex and effective AI models to improve the accuracy of AI signals.
Fine-tune the stop-loss and take-profit settings for better risk control and profit capture.
Consider incorporating other effective technical indicators or fundamental data to enhance the strategy’s robustness.
Summary
This strategy combines the Stochastic Slow indicator, trend filter, and AI signals to form a multi-factor trading approach. The Stochastic indicator provides effective overbought and oversold signals, the trend filter ensures that trades align with the overall trend, and the AI signals offer additional entry opportunities. Although the strategy has some potential risks and room for improvement, its overall logic is clear and reasonable, making it worth further exploration and refinement.
/*backtest
start: 2024-03-01 00:00:00
end: 2024-03-31 23:59:59
period: 1h
basePeriod: 15m
exchanges: [{"eid":"Futures_Binance","currency":"BTC_USDT"}]
*/

//@version=5
strategy("Stochastic Slow Strategy with More Entries and AI", overlay=true)

length = input.int(26, minval=1)
OverBought = input(81)
OverSold = input(20)
smoothK = input.int(3, minval=1)
smoothD = input.int(3, minval=1)
minKValue = input(11, title="Minimum K Value")

// Stochastic calculations
k = ta.sma(ta.stoch(close, high, low, length), smoothK)
d = ta.sma(k, smoothD)
co = ta.crossover(k, d)
cu = ta.crossunder(k, d)

// Trend filter (200-period simple moving average)
ema200 = ta.sma(close, 200)

// Artificial Intelligence indicator (dummy example)
// Aquí puedes colocar la lógica de tu red neuronal artificial
// Por ahora, simplemente usaremos una señal aleatoria
ai_signal = ta.rsi(close, 14) > 50 ? 1 : -1

// Entry conditions
longCondition = ta.crossover(close, ema200) and k < OverSold and k > minKValue and ai_signal == 1
shortCondition = ta.crossunder(close, ema200) and k > OverBought and k > minKValue and ai_signal == -1

if (not na(k) and not na(d))
    if (co and k < OverSold and k > minKValue)
        strategy.entry("StochLE", strategy.long, comment="StochLE")
    if (cu and k > OverBought and k > minKValue)
        strategy.entry("StochSE", strategy.short, comment="StochSE")
    if (longCondition)
        strategy.entry("LongEntry", strategy.long, comment="LongEntry")
        strategy.exit("StopLoss", "LongEntry", loss = close * 0.9) // Stop loss del 10%
    if (shortCondition)
        strategy.entry("ShortEntry", strategy.short, comment="ShortEntry")
        strategy.exit("StopLoss", "ShortEntry", loss = close * 1.1) // Stop loss del 10%

// Plotting
plot(ema200, color=color.blue, title="200 SMA")