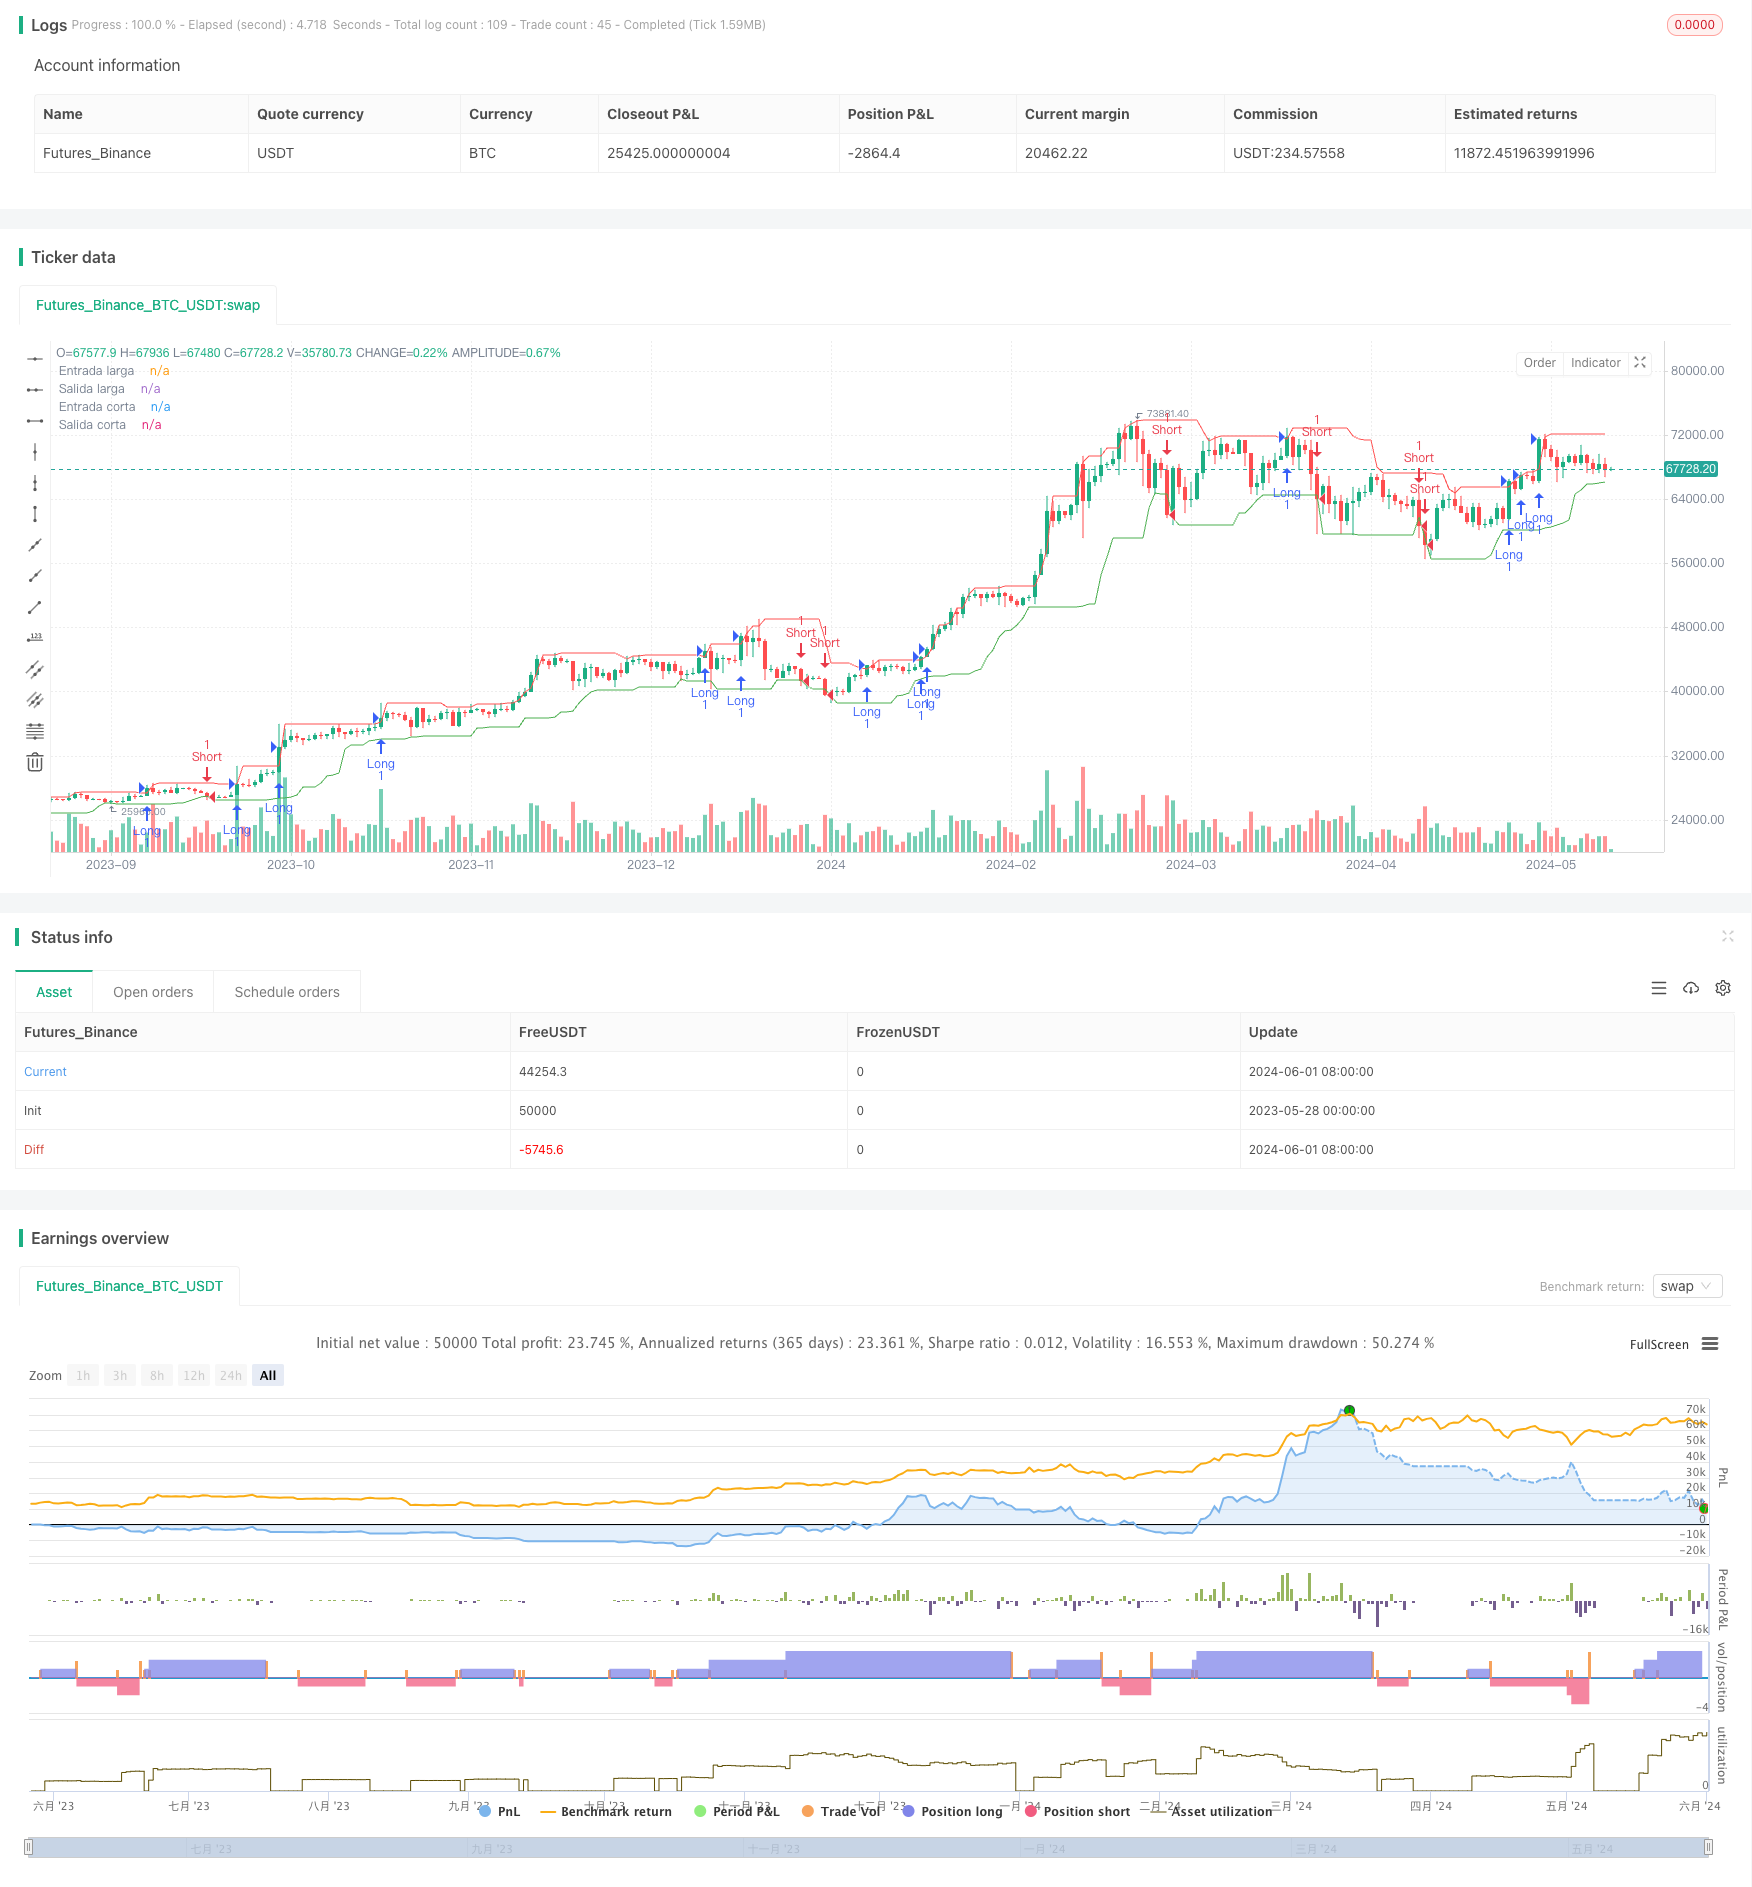
トートル=ATR ボリンジャー・バンドのブレイクアウト戦略
作者: リン・ハーンチャオチャン, 日付: 2024-06-03 10:48:09タグ:ATR

概要
トートル取引のルールに基づくトレンドフォロー戦略である.この戦略は,トレンド方向と取引ポジションのサイズを決定するためにATR (平均真要範囲) を使用する.価格が特定の期間中の最高価格または最低価格から突破したとき,戦略はロングまたはショートポジションを開く.価格は特定の期間中の最低価格または最高価格から突破するまでポジションを保持し,その時点で戦略はポジションを閉じます.この戦略の目的は,リスクを厳格に制御しながら,強いトレンド市場を捕捉することです.
戦略原則
この戦略の核心は,トレンド方向と取引ポジションのサイズを決定するためにATR指標を使用することです.ATR指標は市場の変動を測定し,適切なストップ・ロストレベルとポジションサイズを決定するのに役立ちます.戦略の主なステップは以下の通りです:
- ATR指標値を計算する.
- ロングとショートポジションのブレイクアウト価格レベルを決定します.ロングブレイクアウト価格は特定の期間中の最高価格で,ショートブレイクアウト価格は特定の期間中の最低価格です.
- 価格がロングブレイク価格を超えると,ロングポジションを開く.価格がショートブレイク価格を下回ると,ショートポジションを開く.
- ATR指標の値と口座残高に基づいて,各取引のポジションサイズを計算する.
- ポジションを保持し,価格が一定期間中の最低価格 (ロングポジション) または最高価格 (ショートポジション) を破るまで,その後ポジションを閉じる.
このアプローチに従うことで,戦略は,リスクを厳格に制御しながら,強いトレンド市場を把握することができます.ATR指標の使用は,市場の変動により良く適応するために,ポジションサイズを動的に調整するのに役立ちます.
戦略 の 利点
- トレンドフォロー: この戦略は,強いトレンド市場を把握し,実質的な利益を生むことを目的としています.
- リスク管理: ATR インディケーターを使用してポジションサイズとストップ・ロスのレベルを決定することで,戦略はリスクを効果的に制御することができます.
- 適応性:ATR指標は動的に調整可能で,戦略は異なる市場環境に適応できます.
- シンプル: 戦略の論理は明確で,理解し実行するのが簡単です.
戦略リスク
- トレンド逆転:市場のトレンドが突然逆転すると,戦略は大きな損失を被る可能性があります.
- 不安定な市場: 不安定な市場では,戦略は頻繁にポジションを開閉し,高い取引コストにつながる可能性があります.
- パラメータ敏感性: 戦略のパフォーマンスはパラメータ設定に敏感であり,不適切なパラメータは不良なパフォーマンスにつながる可能性があります.
これらのリスクに対処するために,次の解決策を検討できます.
- トレンドが逆転するときに早急にポジションを開くのを避けるために,トレンド確認メカニズムを導入する.
- ポジションのサイズを減らすか 変動する市場での取引を中止する
- パラメータを最適化して 最高の組み合わせを見つけます
戦略の最適化方向
- より多くの指標を導入する:ATR指標に加えて,動向平均などの他の傾向確認指標を導入することを検討し,傾向の識別の精度を向上させる.
- ダイナミックパラメータ調整:市場変化に適応するために,ATR期とブレイク価格期などの異なる市場環境に基づいて戦略パラメータをダイナミックに調整する.
- ある程度の利益を達成した後,部分的なポジション閉鎖を考慮して利益を固定しリスクを軽減してください.
- ロング/ショートポジション管理: 戦略の柔軟性を高めるため,ストップ・ロストとテイク・プロフィートの異なる基準を使用するなど,ロングとショートポジションを別々に管理することを検討する.
上記の最適化により,戦略の安定性と収益性がさらに向上できます.
概要
トートル・ATRボリンガーバンドブレイクアウト戦略は,トレンドトレードルールのルールに基づいたトレンドフォロー戦略である.この戦略は,トレンド方向と取引ポジションのサイズを決定するためにATR指標を利用し,価格が一定期間中に最高または最低価格から突破したときのポジションを開設し,トレンドが逆転するまでポジションを保持する.この戦略の利点は,リスクを厳格に制御しながら強いトレンド市場を捕獲する能力にある.しかし,この戦略はトレンド逆転,不安定な市場,パラメータ敏感性などのリスクにも直面している.戦略のパフォーマンスをさらに改善するために,より多くの指標を導入し,パラメータを動的に調整し,利益を引き出すメカニズムを組み込み,ポジション管理を最適化するなどの分野で最適化を検討することができる.全体的に,TURTLE-ATRボリンガーバンドブレイクアウト戦略は,研究やさらなる適用に値するシンプルで適応性のあるトレンドフォロー戦略である.
/*backtest
start: 2023-05-28 00:00:00
end: 2024-06-02 00:00:00
period: 1d
basePeriod: 1h
exchanges: [{"eid":"Futures_Binance","currency":"BTC_USDT"}]
*/

// This Pine Script™ code is subject to the terms of the Mozilla Public License 2.0 at https://mozilla.org/MPL/2.0/
// © luisfeijoo22

//@version=5
strategy("Estrategia de las tortugas_ES", overlay=true, pyramiding=3)

// Parámetros
atrLength = input.int(20, "Longitud del ATR")
atrFactor = input.float(2, "Factor del ATR")
entryBreakout = input.int(20, "Breakout de entrada")
exitBreakout = input.int(10, "Breakout de salida")
longOnly = input.bool(false, "Solo largos")
shortOnly = input.bool(false, "Solo cortos")


// Cálculo del ATR
atr = ta.atr(atrLength)

// Cálculo de los niveles de breakout
longEntry = ta.highest(high, exitBreakout)[1]
longExit = ta.lowest(low, exitBreakout)[1]
shortEntry = ta.lowest(low, exitBreakout)[1]
shortExit = ta.highest(high, exitBreakout)[1]

// Cálculo del tamaño de la posición
nContracts = math.floor((strategy.equity * 0.01) / (atrFactor * atr))

// Filtra las fechas según el rango deseado
// in_range = time >= timestamp(year(start_date), month(start_date), dayofmonth(start_date))

// Condiciones de entrada y salida
longCondition = not longOnly and close > longEntry and time >= timestamp("2023-03-15")
if longCondition
    strategy.entry("Long", strategy.long, qty = nContracts)

shortCondition = not shortOnly and close < shortEntry and time >=  timestamp("2023-03-15")
if shortCondition
    strategy.entry("Short", strategy.short, qty = nContracts)

strategy.exit("Exit Long", "Long", stop = longExit)
strategy.exit("Exit Short", "Short", stop = shortExit)

// Visualización de los niveles de breakout
plot(longEntry, "Entrada larga", color.green, style = plot.style_line)
plot(longExit, "Salida larga", color.red, style = plot.style_line)
plot(shortEntry, "Entrada corta", color.green, style = plot.style_line)
plot(shortExit, "Salida corta", color.red, style = plot.style_line)
- ATR ベースのリスク管理による多EMA 傾向を追求するスウィング・トレーディング戦略
- 量確認による構造の破裂 多条件のインテリジェント・トレーディング戦略
- 多指標動的ストップ・ロスの動向トレンド・トレード戦略
- Fibonacci リトレースメント レベルに基づく定量的な取引戦略を伴う多条件トレンド
- マルチフィルタートレンドブレークスルー スマート移動平均取引戦略
- 複数の指標による変動取引のRSI-EMA-ATR戦略
- トリプル・スーパートレンドとボリンジャー・バンド 多指標トレンド 戦略をフォローする
- 多トレンドラインブレイクモメント量的な戦略
- RSIモメンタムとADXトレンド強度に基づく資本管理システム
- ATRベースの取利益とストップ損失を伴う戦略をフォローする多期間の傾向
- アダプティブ トレイリングストップの先端トレンドフォロー戦略
- 動向フィルタリングによるトレンドフォローする取引戦略
- RSIと線形回帰チャネル取引戦略
- ダブル・ベガス・チャネル・ボラティリティ調整スーパートレンド量的な取引戦略
- EMAのRSIクロスオーバー戦略
- 移動平均収束勢雲戦略
- 2つの移動平均のクロスオーバーストップ損失と利益戦略
- TEMAの二重移動平均のクロスオーバー戦略
- マルチタイムフレーム SMA トレンド ダイナミックストップロスの戦略をフォローする
- ボリンジャー・バンドの正確なエントリーとリスク管理戦略
- ボリンジャーバンド+RSI+ストカスティックRSI戦略
- VWAPとスーパートレンドの買い/売戦略
- 限定マルティンゲールによる高度MACD戦略
- ケルトナー・チャネルズ EMA ATR戦略
- MA MACD BB マルチインジケーター取引戦略 バックテストツール
- RSI+スーパートレンド トレンドフォローする取引戦略
- イチモク・クモ・トレード戦略
- ダイナミックATRストップ・ロスト&テイク・プロフィート 移動平均クロスオーバー戦略
- EMA トレンド・モメンタム・キャンドルスティック・パターンの戦略
- Gチャンネルトレンド検出戦略
- トレーリングストップ損失戦略の移動平均クロスオーバー