Trend silang purata bergerak berganda mengikut strategi dengan sistem Stop-Loss dan Take-Profit dinamik
Penulis:ChaoZhang, Tarikh: 2024-11-25 17:24:33Tag:EMASMAMATPSL

Ringkasan
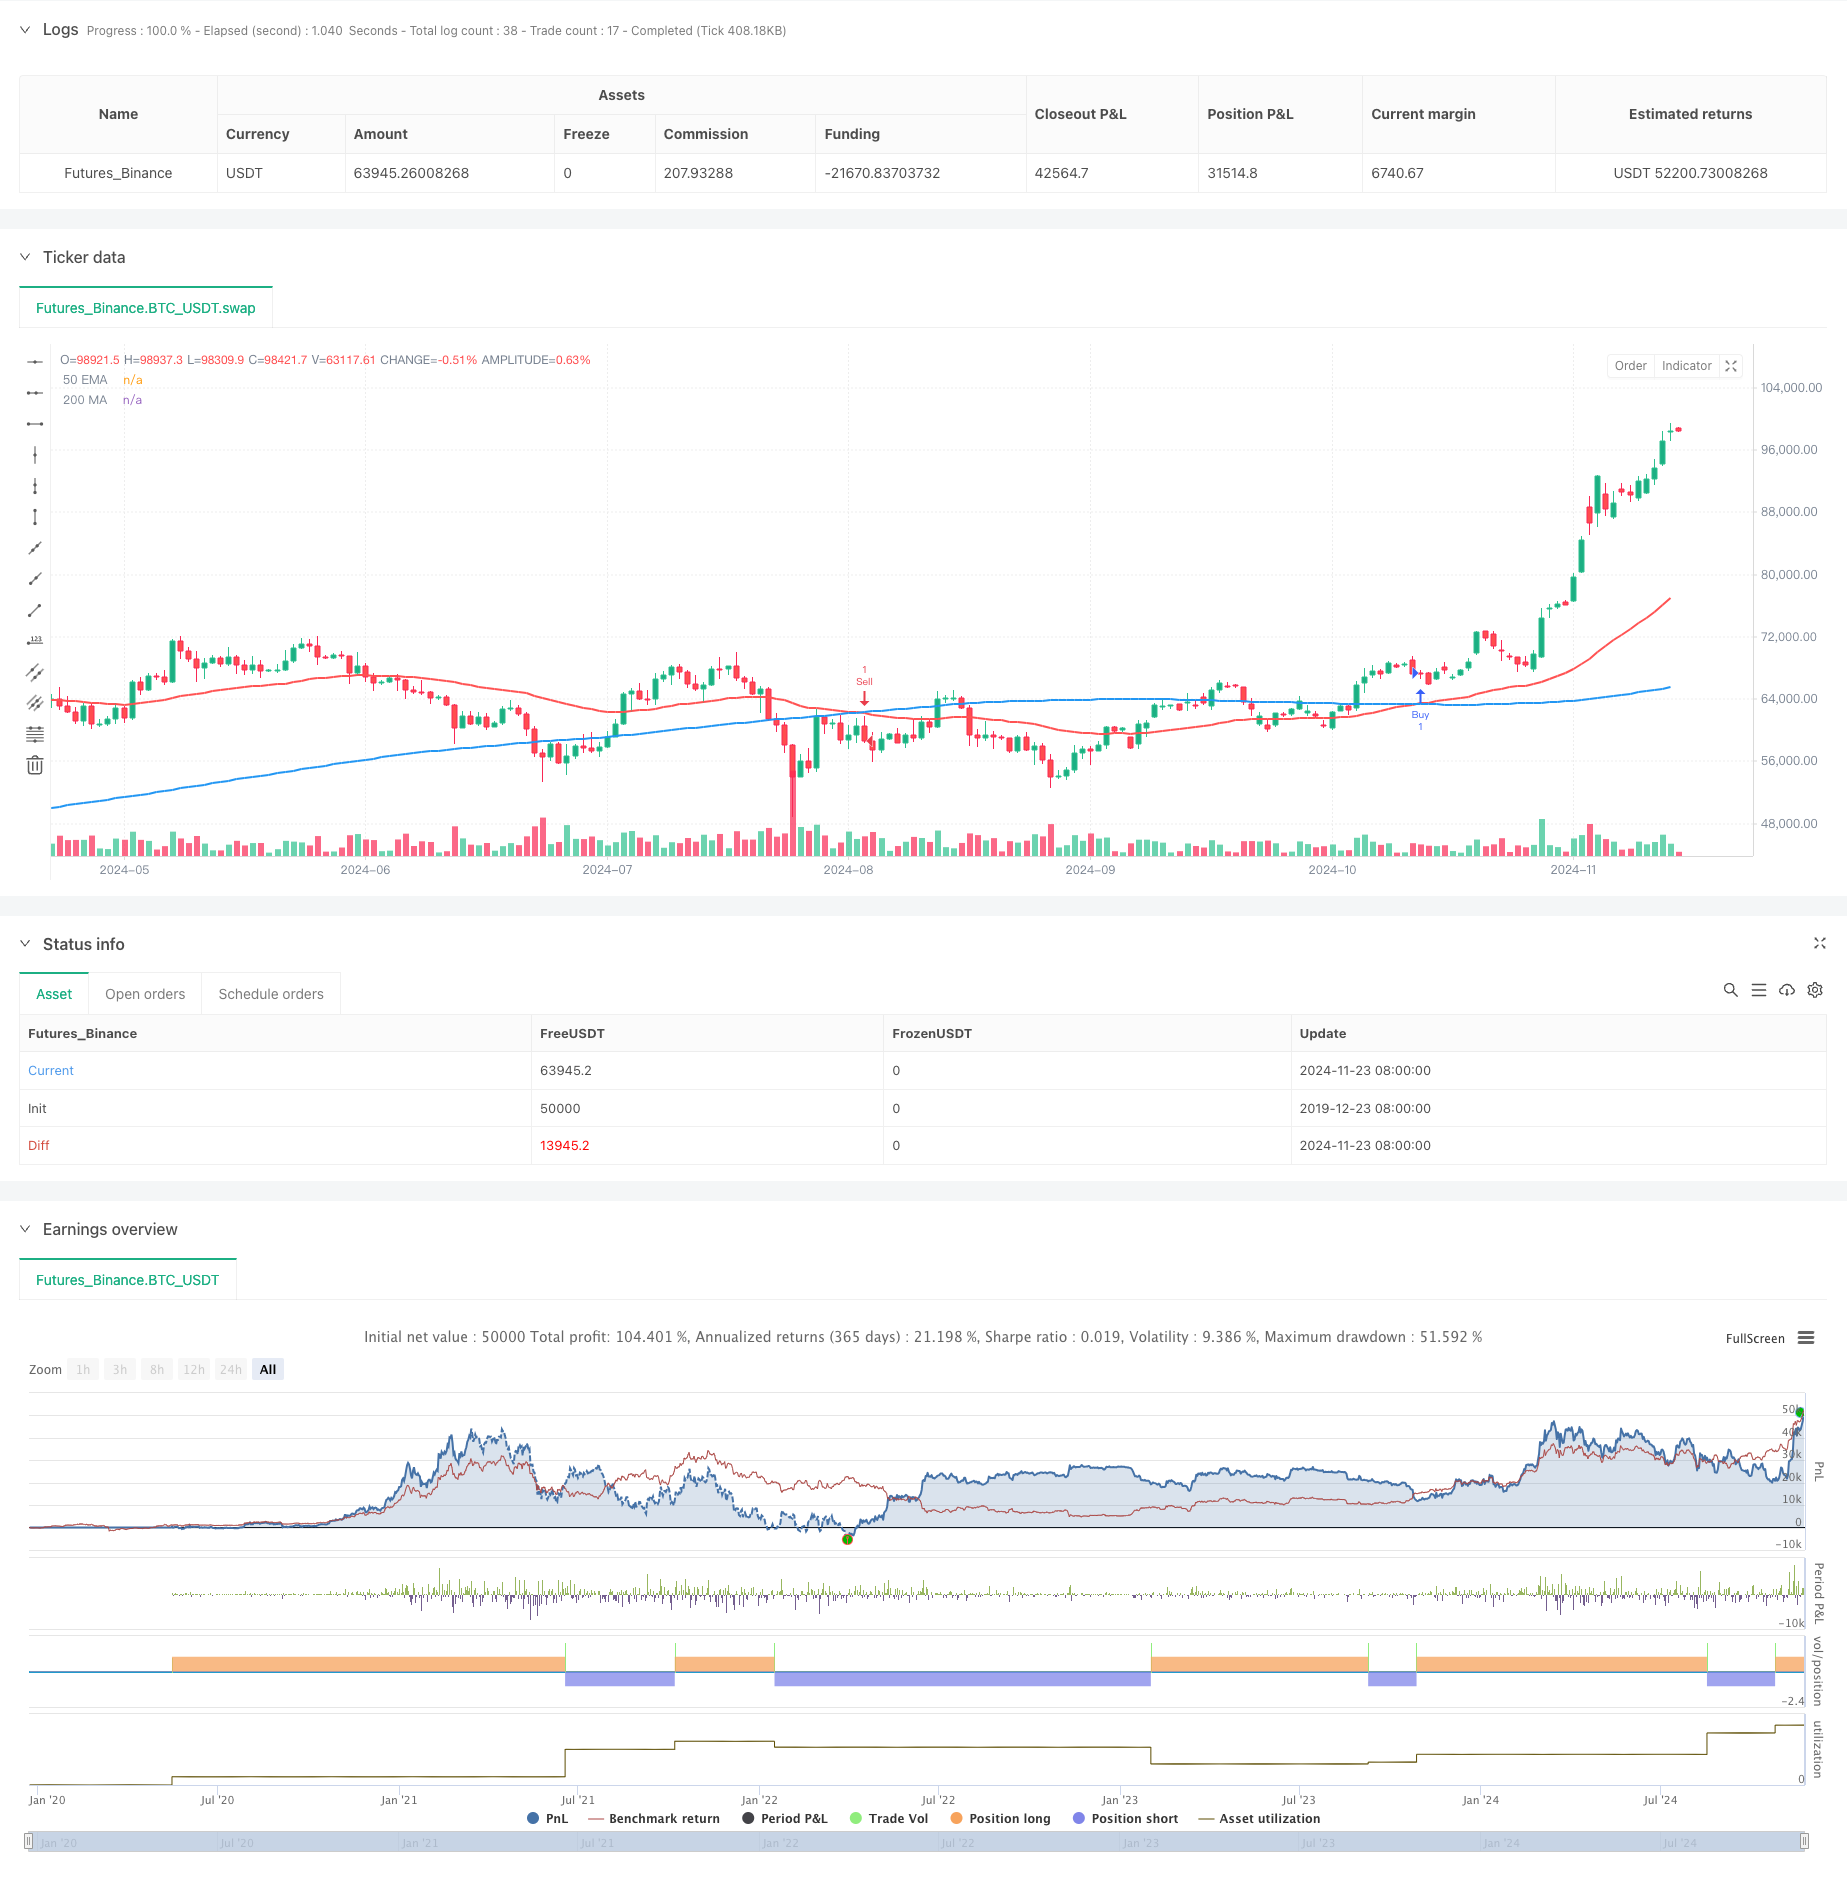
Strategi ini adalah sistem trend-mengikuti berdasarkan analisis teknikal, terutamanya menggunakan isyarat silang antara purata bergerak eksponen 50 tempoh (EMA) dan purata bergerak mudah 200 tempoh (MA) untuk menangkap trend pasaran.
Prinsip Strategi
Logik terasnya adalah berdasarkan persilangan dua purata bergerak: isyarat beli dihasilkan apabila EMA 50 tempoh melintasi di atas MA 200 tempoh, sementara isyarat jual dicetuskan apabila EMA 50 tempoh melintasi di bawah MA 200 tempoh. Selepas setiap kemasukan, sistem secara automatik menetapkan paras stop-loss (3 mata dari kemasukan) dan tahap mengambil keuntungan (7.5 mata dari kemasukan).
Kelebihan Strategi
- Keupayaan mengikuti trend yang kuat: Mencatatkan secara berkesan peralihan trend pasaran dengan menggabungkan purata bergerak cepat dan perlahan
- Kawalan risiko yang komprehensif: Mengintegrasikan mekanisme stop-loss dan mengambil keuntungan yang dinamik untuk pengurusan risiko yang berkesan
- Sistematisasi yang tinggi: Isyarat perdagangan yang jelas dan titik keluar tetap mengurangkan gangguan penilaian subjektif
- Kemudahan penyesuaian yang kuat: Strategi boleh digunakan untuk persekitaran pasaran dan instrumen perdagangan yang berbeza
- Operasi mudah: Logik masuk dan keluar yang jelas, mudah untuk pelaksanaan dan pengujian belakang
Risiko Strategi
- Risiko pasaran yang bergelombang: Penembusan palsu di pasaran yang berbeza boleh membawa kepada kerugian berturut-turut
- Risiko tergelincir: Harga pelaksanaan sebenar boleh menyimpang dengan ketara dari harga teori semasa turun naik yang tinggi
- Risiko stop loss tetap: Tahap stop loss tetap yang ditetapkan mungkin tidak sesuai dengan semua keadaan pasaran
- Risiko pembalikan trend: Potensi penangguhan keluar semasa pembalikan trend tiba-tiba
- Risiko pengurusan wang: Julat stop-loss tetap mungkin tidak sesuai untuk saiz akaun yang berbeza
Arahan pengoptimuman
- Menggabungkan penunjuk turun naik: Sesuaikan secara dinamik tahap stop-loss dan mengambil keuntungan berdasarkan turun naik pasaran
- Tambah penunjuk pengesahan trend: Seperti RSI atau MACD untuk meningkatkan kebolehpercayaan isyarat
- Mengoptimumkan pengurusan wang: Penyesuaian saiz kedudukan berdasarkan saiz akaun dan turun naik pasaran
- Tambah penapis persekitaran pasaran: Kurangkan kekerapan perdagangan atau hentikan perdagangan di pasaran yang berbeza
- Memperbaiki mekanisme keluar: Melaksanakan hentian belakang untuk memaksimumkan keuntungan
Ringkasan
Strategi ini menggabungkan sistem crossover purata bergerak berganda klasik dengan mekanisme stop-loss dan mengambil keuntungan dinamik untuk mewujudkan sistem perdagangan trend yang lengkap. Kekuatannya terletak pada sistematisasi yang tinggi dan kawalan risiko yang komprehensif, walaupun penerapan praktikal memerlukan pengoptimuman berdasarkan keadaan pasaran tertentu dan saiz modal. Kestabilan dan keuntungan strategi ini dapat ditingkatkan dengan menambah lebih banyak penunjuk teknikal dan meningkatkan kaedah pengurusan wang. Bagi pelabur yang mencari pulangan yang stabil, ini berfungsi sebagai kerangka strategi asas yang berharga untuk dibangunkan.
/*backtest
start: 2019-12-23 08:00:00
end: 2024-11-24 00:00:00
period: 1d
basePeriod: 1d
exchanges: [{"eid":"Futures_Binance","currency":"BTC_USDT"}]
*/

//@version=5
strategy("200 MA & 50 EMA Crossover Strategy with **Estimated** SL & TP", overlay=true)

 // Parameters for the 200 MA and 50 EMA
ma200 = ta.sma(close, 200) // 200-period simple moving average
ema50 = ta.ema(close, 50) // 50-period exponential moving average

 // Plot the MA and EMA on the chart
plot(ma200, color=color.blue, linewidth=2, title="200 MA")
plot(ema50, color=color.red, linewidth=2, title="50 EMA")

 // Define **estimated** stop loss and take profit values
// SL = 3 points, TP = 7.5 points from the entry price
sl_points = 3
tp_points = 7.5

 // Buy signal: when the 50 EMA crosses above the 200 MA (bullish crossover)
if (ta.crossover(ema50, ma200))
    strategy.entry("Buy", strategy.long)
 // Set **estimated** stop loss and take profit strategy.exit("Take Profit/Stop Loss", "Buy", stop=strategy.position_avg_price - sl_points, limit=strategy.position_avg_price + tp_points)

 // Sell signal: when the 50 EMA crosses below the 200 MA (bearish crossover)
if (ta.crossunder(ema50, ma200))
    strategy.entry("Sell", strategy.short)
 // Set **estimated** stop loss and take profit strategy.exit("Take Profit/Stop Loss", "Sell", stop=strategy.position_avg_price + sl_points, limit=strategy.position_avg_price - tp_points)

 // Optional: Close the position when an opposite signal appears
if (strategy.position_size > 0 and ta.crossunder(ema50, ma200))
    strategy.close("Buy")
if (strategy.position_size < 0 and ta.crossover(ema50, ma200))
    strategy.close("Sell")
- Adaptive Moving Average Crossover dengan strategi Stop-Loss yang mengikut
- Strategi Penangkapan Trend Purata Bergerak Berganda dengan Stop-Loss Dinamik dan Penapis
- Rata-rata Bergerak Ganda dan MACD Trend Gabungan Berikutan Sistem Dagangan Pintar Ambil Keuntungan Dinamis
- Strategi Crossover Purata Bergerak Berganda dengan Stop-Loss dan Take-Profit yang Sesuai
- Strategi Dagangan Kuantitatif Beradaptasi dengan Crossover Purata Bergerak Berganda dan Ambil Keuntungan / Hentikan Kerugian
- Sistem Dagangan Kuantitatif Automatik dengan Crossover EMA Dual dan Pengurusan Risiko
- Dinamis Trailing Stop Dual Sasaran Moving Purata strategi crossover
- EMA Advanced Crossover Strategy: Sistem Dagangan Bersesuaian dengan Matlamat Stop-Loss dan Take-Profit Dinamik
- Sistem Dagangan Trend Breakout dengan Purata Bergerak (Strategi TBMA)
- Strategi Perdagangan Penembusan SMA Empat Tempoh dengan Sistem Pengurusan Keuntungan/Hilang Dinamik
- Strategi Ramalan Rintisan Osilasi Dinamik MACD
- VWAP-ATR Sistem Dagangan Aksi Harga Dinamik
- Strategi Kuantitatif Trend Dinamik Berdasarkan Bollinger Bands dan RSI Cross
- Strategi pembalikan purata dengan Bollinger Bands, RSI dan Sistem Stop-Loss Dinamik berasaskan ATR
- Sistem Strategi Dagangan Dinamik Berdasarkan Indikator SAR Parabolik
- Adaptive Volatility and Momentum Quantitative Trading System (AVMQTS)
- Strategi Dagangan Trend Lanjutan Berdasarkan Bollinger Bands dan Corak Candlestick
- Volatiliti ATR dan Trend Penyesuaian Berasaskan Purata Bergerak Berikutan Strategi Keluar
- Strategi Dagangan Trend Momentum EMA Berganda dengan Sistem Isyarat Lilin Tubuh Penuh
- Dual Timeframe Supertrend dengan Sistem Pengoptimuman RSI
- Sistem Dagangan Mengikut Trend Multi-Timeframe dengan Integrasi ATR dan MACD
- Strategi Perdagangan Pintar RSI Supertrend Jangka Masa Berganda
- Dual MACD Price Action Breakout Trailing Strategi
- Multi-EMA Trend Momentum Recognition dan Sistem Dagangan Stop-Loss
- Strategi Pengesahan Trend Volume Dual EMA untuk Perdagangan Kuantitatif
- Strategi silang EMA-RSI berganda dengan mengambil keuntungan dinamik/berhenti kerugian
- Peningkatan Trend Penyesuaian Dinamik Berbilang Tempoh Berikutan Sistem Dagangan
- Strategi Dagangan Dua Arah Penembusan Volatiliti Besar: Sistem Masuk Sempadan Berasaskan Titik
- Strategi Kuantitatif Pembalikan Rata-rata Bollinger yang Ditingkatkan
- Penembusan Kotak Darvas Dinamik dengan Sistem Perdagangan Pengesahan Trend Purata Bergerak