Multi-Indicator Crossover Dynamic Strategy System: A Quantitative Trading Model Based on EMA, RVI and Trading Signals
Author: ChaoZhang, Date: 2024-11-12 15:58:01Tags: EMARVIATRSLTP

Overview
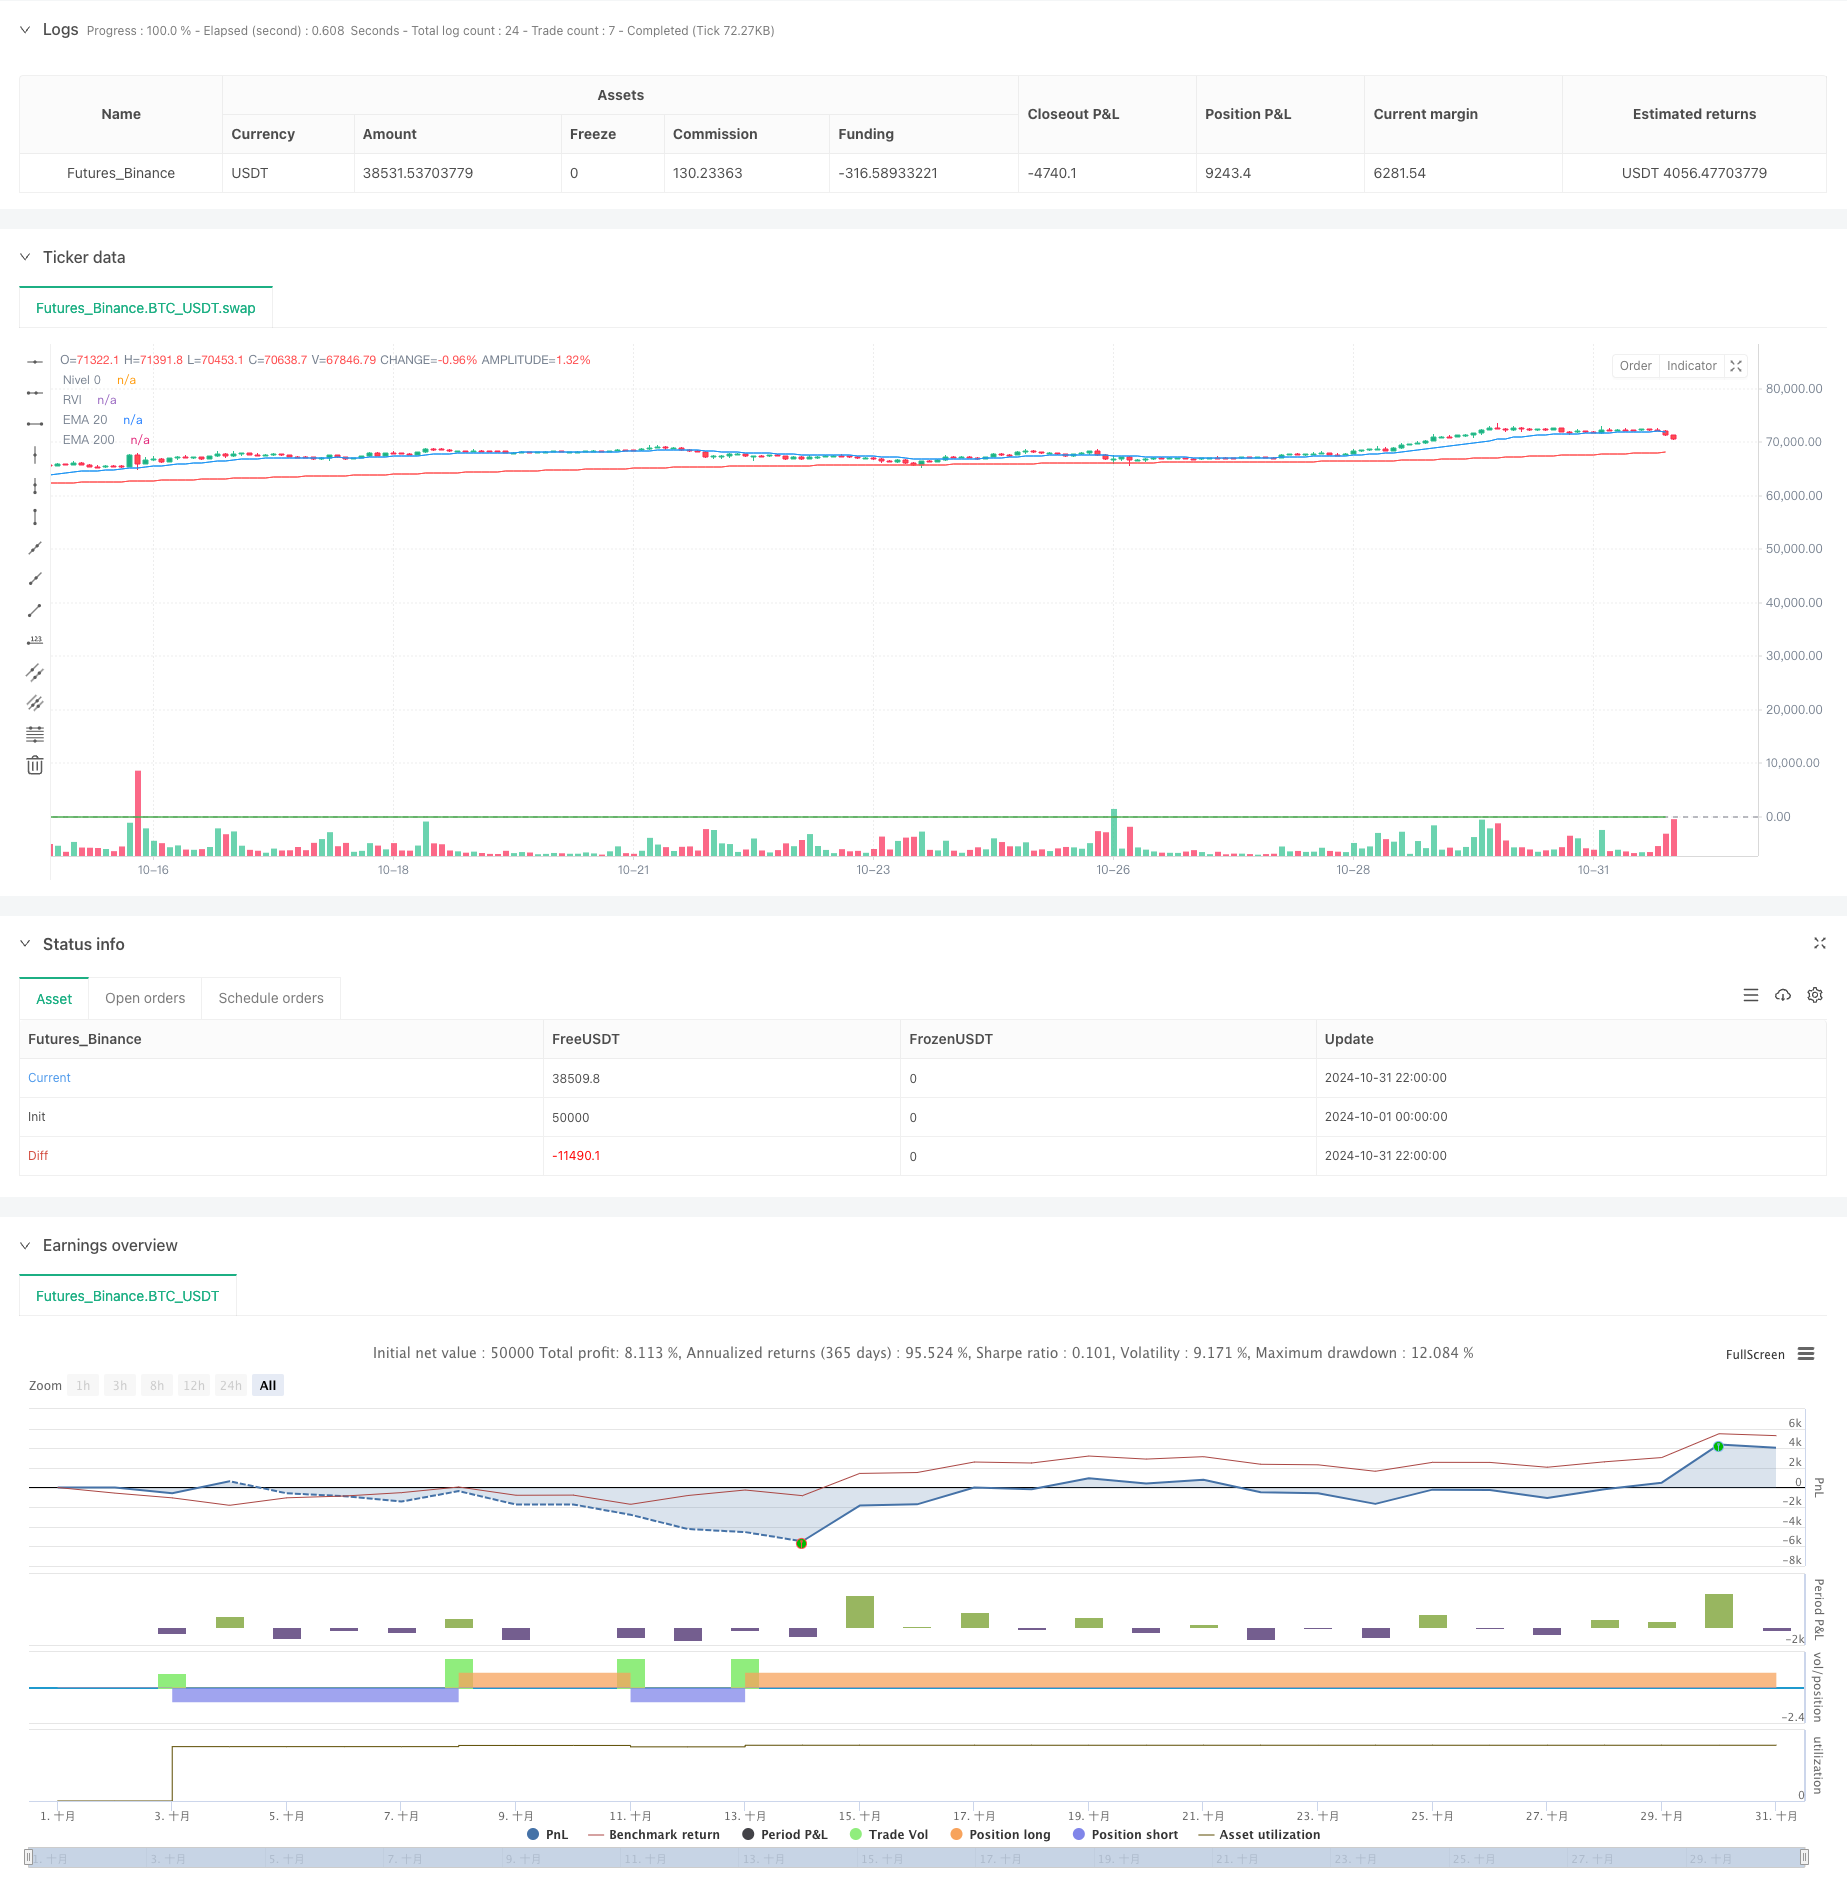
This strategy is a quantitative trading system based on multiple technical indicators, combining Exponential Moving Averages (EMA), Relative Volatility Index (RVI), and custom trading signals for decision-making. The system employs dynamic stop-loss and take-profit targets using the ATR indicator for risk management, creating a comprehensive trading strategy framework.
Strategy Principles
The strategy relies on three core components for trading decisions: 1. Dual EMA System: Uses 20-period and 200-period EMAs to determine market trends through crossovers 2. RVI Indicator: Confirms market volatility direction and provides additional trading confirmation 3. Custom Signals: Integrates external trading signals for tertiary confirmation The system enters long positions when: - EMA20 crosses above EMA200 - RVI is positive - Receives a buy signal Short conditions are reversed. Additionally, the system uses ATR-based dynamic stop-loss and take-profit targets for risk management.
Strategy Advantages
- Multiple Confirmation Mechanism: Reduces false signals through multiple independent indicator analysis
- Dynamic Risk Management: ATR-based stop-loss adapts to market volatility
- Flexible Capital Management: Uses cash-based position sizing
- Visual Support: Complete graphical interface for analysis and optimization
- Modular Design: Independent components for easy maintenance and optimization
Strategy Risks
- EMA Lag: EMAs are inherently lagging indicators, potentially causing delayed entries
- Signal Dependency: Over-reliance on multiple signals may cause missed opportunities
- Market Adaptability: May generate frequent false signals in ranging markets
- Parameter Sensitivity: Multiple indicator parameters require precise tuning Recommend backtesting across different market conditions and considering market environment filters.
Optimization Directions
- Market Environment Recognition: Add market state detection module for parameter adjustment
- Dynamic Parameter Adjustment: Automatically adjust EMA and RVI periods based on volatility
- Signal Weighting System: Implement dynamic weights for different indicators
- Stop-Loss Optimization: Consider adding trailing stops for better profit protection
- Position Management: Implement more sophisticated position management strategies
Summary
The strategy builds a relatively complete trading system through the comprehensive use of multiple technical indicators and risk management tools. While there are some inherent limitations, the system shows promise for improved performance through the suggested optimizations. The key is continuous monitoring and adjustment in live trading to ensure strategy stability across different market conditions.
/*backtest
start: 2024-10-01 00:00:00
end: 2024-10-31 23:59:59
period: 2h
basePeriod: 2h
exchanges: [{"eid":"Futures_Binance","currency":"BTC_USDT"}]
*/

//@version=5
strategy("Gold Bot with Viamanchu, EMA20/200, and RVI - 3min", overlay=true)

// Parámetros de las EMAs
ema20 = ta.ema(close, 20)
ema200 = ta.ema(close, 200)

// Relative Volatility Index (RVI)
rvi_length = input(14, title="RVI Length")
rvi = ta.rma(close - close[1], rvi_length) / ta.rma(math.abs(close - close[1]), rvi_length)

// Simulación de Viamanchu (aleatoria para demo, se debe reemplazar por señal de Viamanchu real)
var int seed = time
simulated_vi_manchu_signal = math.random() > 0.5 ? 1 : -1  // 1 para compra, -1 para venta (puedes sustituir por la lógica de Viamanchu)

// Gestión de riesgos: Stop Loss y Take Profit usando ATR
atr_length = input(14, title="ATR Length")
atr = ta.atr(atr_length)
atr_multiplier = input.float(1.5, title="ATR Multiplier for Stop Loss/Take Profit")
stop_loss_level = strategy.position_avg_price - (atr * atr_multiplier)
take_profit_level = strategy.position_avg_price + (atr * atr_multiplier)

// Condiciones de entrada
longCondition = ta.crossover(ema20, ema200) and rvi > 0 and simulated_vi_manchu_signal == 1
shortCondition = ta.crossunder(ema20, ema200) and rvi < 0 and simulated_vi_manchu_signal == -1

// Ejecutar compra (long)
if (longCondition)
    strategy.entry("Compra", strategy.long, stop=stop_loss_level, limit=take_profit_level)

// Ejecutar venta (short)
if (shortCondition)
    strategy.entry("Venta", strategy.short, stop=stop_loss_level, limit=take_profit_level)

// Visualización de las condiciones de entrada en el gráfico
plotshape(series=longCondition, title="Compra señal", location=location.belowbar, color=color.green, style=shape.labelup, text="BUY")
plotshape(series=shortCondition, title="Venta señal", location=location.abovebar, color=color.red, style=shape.labeldown, text="SELL")

// Visualización de las EMAs en el gráfico
plot(ema20, color=color.blue, title="EMA 20")
plot(ema200, color=color.red, title="EMA 200")

// Visualización del RVI en el gráfico
plot(rvi, color=color.green, title="RVI")
hline(0, "Nivel 0", color=color.gray)
- Dynamic Trend Following Strategy Combining Supertrend and EMA
- Dynamic Trend Following with Precision Take-Profit and Stop-Loss Strategy
- Dynamic Risk-Managed Exponential Moving Average Crossover Strategy
- Dual EMA Pullback Trading System with ATR-Based Dynamic Stop-Loss Optimization
- Triple Exponential Moving Average Trend Trading Strategy
- Advanced EMA Crossover Trend Following Strategy with ATR-Based Dynamic Stop Management System
- MACD Crossover Momentum Strategy with Dynamic Take Profit and Stop Loss Optimization
- Adaptive Moving Average Crossover with Trailing Stop-Loss Strategy
- Dynamic Long/Short Swing Trading Strategy with Moving Average Crossover Signal System
- Multi-Indicator Trend Following Strategy: Integrating SuperTrend, EMA, and Risk Management
- Multi-Timeframe EMA Trend Momentum Trading Strategy
- Intelligent Time-Based Long-Short Rotation Balanced Trading Strategy
- Advanced MACD Dynamic Trend Quantitative Trading Strategy
- Trend Breakout Trading System with Moving Average (TBMA Strategy)
- ATR-Based Multi-Trend Following Strategy with Take-Profit and Stop-Loss Optimization System
- RSI Momentum-based Smart Adaptive Trading System with Multi-level Risk Management
- Adaptive RSI Oscillator Dynamic Trading Strategy with Threshold Optimization
- RSI and AO Synergistic Trend Following Quantitative Trading Strategy
- Adaptive Trend Momentum RSI Strategy with Moving Average Filter System
- Dual Moving Average Cross RSI Momentum Strategy with Risk-Reward Optimization System
- RSI Dynamic Range Reversal Quantitative Strategy with Volatility Optimization Model
- Bollinger Bands Momentum Trend Following Quantitative Strategy
- Multi-Period Technical Analysis and Market Sentiment Trading Strategy
- Dynamic Holding Period Strategy Based on 123 Point Reversal Pattern
- Multi-Technical Indicator Crossover Momentum Quantitative Trading Strategy - Integration Analysis Based on EMA, RSI and ADX
- Parabolic SAR Divergence Trading Strategy
- Combined Momentum SMA Crossover Strategy with Market Sentiment and Resistance Level Optimization System
- Multi-Period RSI Momentum and Triple EMA Trend Following Composite Strategy
- Multi-Moving Average Momentum Trend Following Strategy
- E9 Shark-32 Pattern Quantitative Price Breakout Strategy