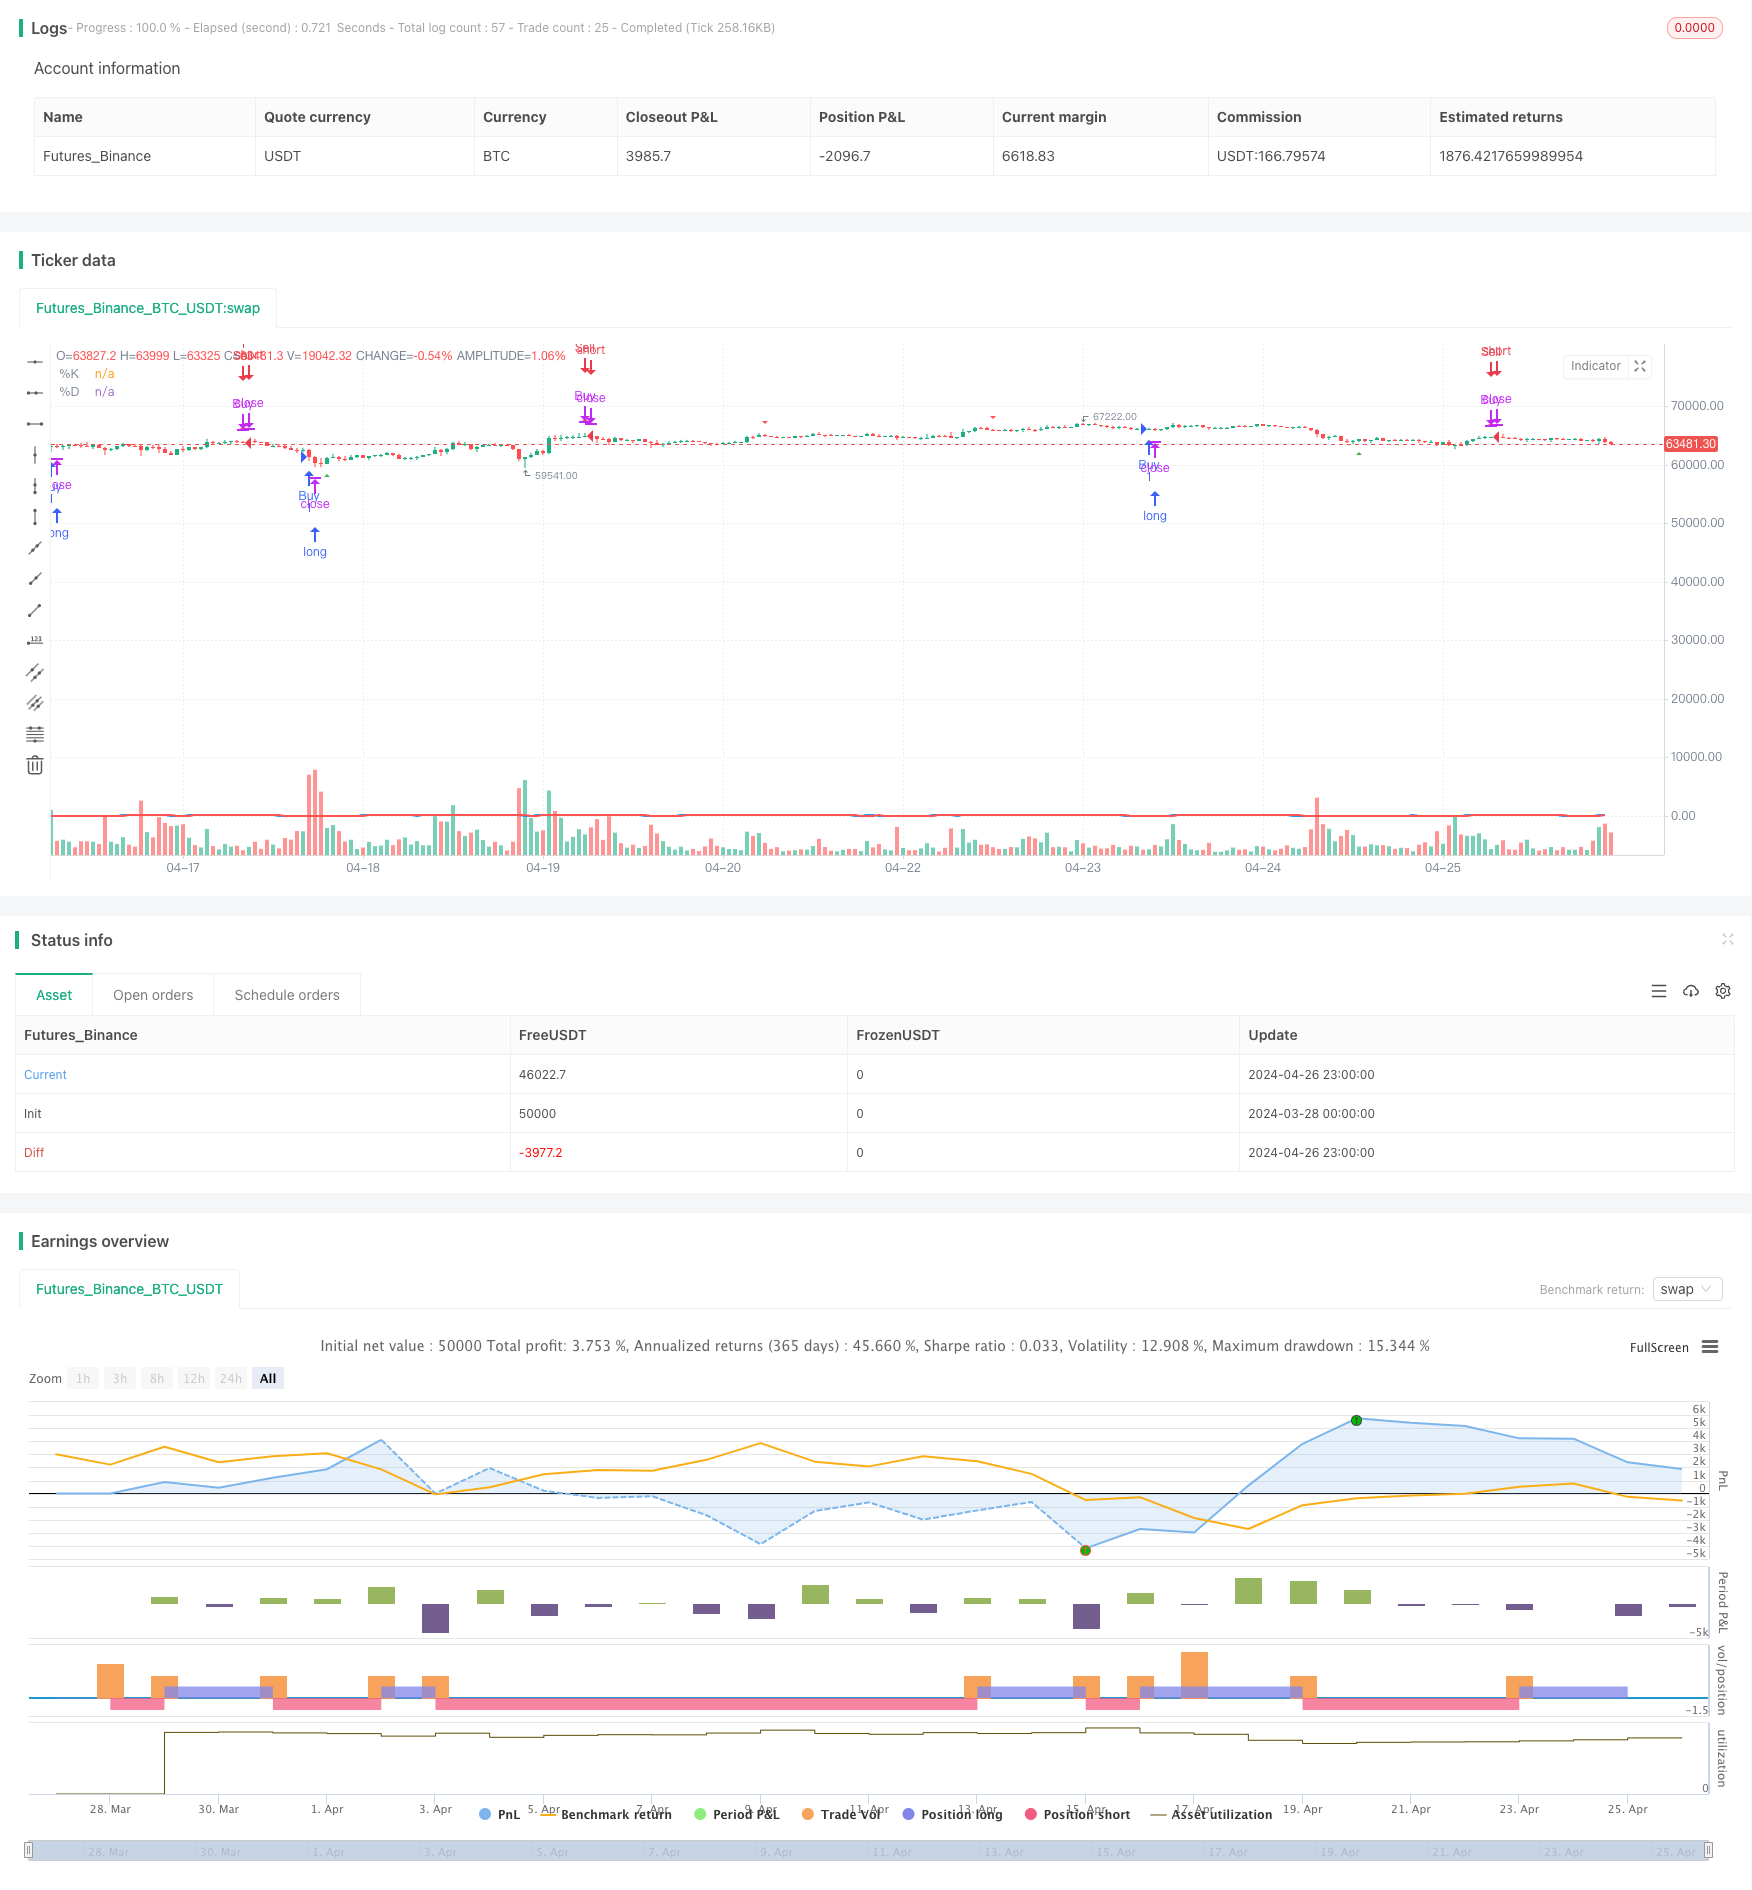
스토카스틱 크로스오버 지표 모멘텀 거래 전략
저자:차오장, 날짜: 2024-04-28 11:57:14태그:스톡SMA

전반적인 설명
이 전략은 잠재적 인 구매 및 판매 기회를 식별하기 위해 스토카스틱 오시일레이터의 크로스오버 신호를 사용합니다. 스토카스틱 오시일레이터의 %K 라인이 %D 라인 위에 넘어가고 %K 값이 20 이하일 때 전략은 구매 신호를 생성합니다. 반대로, %K 라인이 %D 라인 아래에 넘어가고 %K 값이 80 이상일 때 전략은 판매 신호를 생성합니다. 전략은 5 분 시간 프레임에 적용됩니다.
전략 원칙
스토카스틱 오시레이터는 %K 라인과 %D 라인으로 구성됩니다. %K 라인은 지정된 기간 동안 높은 가격과 낮은 가격에 대한 폐쇄 가격의 위치를 측정합니다. %D 라인은 %K 라인의 이동 평균이며, %K 라인을 매끄럽게하고 더 신뢰할 수있는 신호를 생성하는 데 사용됩니다. %K 라인이 %D 라인을 넘을 때 가격 동력의 변화를 나타냅니다. 이는 잠재적 인 구매 또는 판매 신호로 해석 될 수 있습니다. 이 전략은 잠재적인 트렌드 역전 또는 추진력 변화를 식별하기 위해 스토카스틱 오시레이터의 크로스오버를 사용합니다. %K 라인이 %D 라인 위에 넘어가고 %K 값이 20 이하인 경우 (가장 팔린 조건을 나타냅니다), 전략은 구매 신호를 생성합니다. 반대로, %K 라인이 %D 라인 아래에 넘어가고 %K 값이 80 이상인 경우, 전략은 판매 신호를 생성합니다. 이 접근법은 가격 역전이 발생하기 전에 트렌드의 변화를 포착하려고합니다.
전략적 장점
- 단순성: 전략은 널리 사용되는 기술 지표에 기초하고 있으며 이해하기 쉽고 실행하기 쉽습니다.
- 트렌드 식별: 스토카스틱 오시레이터의 크로스오버를 사용하여 전략은 잠재적 인 트렌드 반전 및 추진력 변화를 식별 할 수 있습니다.
- 과잉 구매/ 과잉 판매 신호: 스토카스틱 오시레이터의 크로스오버를 과잉 구매/ 과잉 판매 수준과 결합함으로써, 전략은 가격 반전이 발생하기 전에 극단적인 조건을 식별하려고 시도합니다.
전략 위험
- 잘못된 신호: 스토카스틱 오시레이터는 잘못된 신호를 생성하여 수익성이 없는 거래로 이어질 수 있습니다.
- 지연: 지연 지표로서 스토카스틱 오시레이터는 가격이 이미 역전된 후에 신호를 생성할 수 있습니다.
- 트렌드 확인 부족: 전략은 불안정한 시장에서 빈번한 거래 신호를 생성하여 과잉 거래 및 잠재적 인 손실로 이어질 수 있습니다.
전략 최적화
- 트렌드 확인: 트렌드 신호를 생성하기 전에 트렌드를 확인하기 위해 추가적인 기술 지표 또는 가격 행동 분석이 포함될 수 있습니다. 이것은 불안정한 시장에서 잘못된 신호를 필터링하는 데 도움이 될 수 있습니다.
- 동적 매개 변수: 스토카스틱 오시레이터의 매개 변수는 시장 변동성이나 다른 시장 조건에 따라 동적으로 조정하여 전략의 성능을 최적화 할 수 있습니다.
- 리스크 관리: 잠재적 손실을 제한하고 이익을 보호하기 위해 적절한 스톱 로스 및 포지션 사이즈 컨트롤을 구현할 수 있습니다.
요약
스토카스틱 크로스오버 지표 모멘텀 거래 전략은 자산의 과잉 구매/ 과잉 판매 상태를 고려하면서 잠재적 인 구매 및 판매 기회를 식별하기 위해 스토카스틱 오시레이터의 크로스오버를 사용합니다. 전략은 간단하고 트렌드 반전을 식별 할 수 있지만 잘못된 신호를 생성하고 트렌드 확인이 부족할 수도 있습니다. 트렌드 확인 지표, 동적 매개 변수 최적화 및 리스크 관리를 통합함으로써 전략의 성능을 더욱 향상시킬 수 있습니다. 그러나 실행하기 전에 다른 시장 조건 하에서 전략을 철저히 테스트하고 평가하는 것이 중요합니다.
/*backtest
start: 2024-03-28 00:00:00
end: 2024-04-27 00:00:00
period: 1h
basePeriod: 15m
exchanges: [{"eid":"Futures_Binance","currency":"BTC_USDT"}]
*/

//@version=4
strategy("Stochastic Crossover Buy/Sell", shorttitle="Stochastic Crossover", overlay=true)

// Stochastic Oscillator Parameters
length = input(14, title="Stochastic Length")
smoothK = input(3, title="Stochastic %K Smoothing")
smoothD = input(3, title="Stochastic %D Smoothing")

// Calculate %K and %D
stoch = stoch(close, high, low, length)
k = sma(stoch, smoothK)
d = sma(k, smoothD)

// Plot Stochastic Lines
plot(k, color=color.blue, linewidth=2, title="%K")
plot(d, color=color.red, linewidth=2, title="%D")

// Stochastic Crossover Buy/Sell Signals
buySignal = crossover(k, d) and k < 20 // Buy when %K crosses above %D and %K is below 20
sellSignal = crossunder(k, d) and k > 80 // Sell when %K crosses below %D and %K is above 80

// Plot Buy/Sell Arrows
plotshape(series=buySignal, style=shape.triangleup, location=location.belowbar, color=color.green, size=size.small, title="Buy Signal")
plotshape(series=sellSignal, style=shape.triangledown, location=location.abovebar, color=color.red, size=size.small, title="Sell Signal")

// Entry and Exit Points
strategy.entry("Buy", strategy.long, when=buySignal)
strategy.close("Buy", when=sellSignal)

strategy.entry("Sell", strategy.short, when=sellSignal)
strategy.close("Sell", when=buySignal)
- 매수 전략은 AO+Stoch+RSI+ATR에 달려 있습니다.
- 멀티 스토카스틱 오스실레이션 및 모멘텀 분석 시스템
- BBSR 극단적 전략
- 리스크 관리 시스템과 함께 멀티 EMA 트렌드 모멘텀 거래 전략
- EMA/SMA 다중 지표 포괄적 동향 전략
- 강화된 모멘텀 오시레이터 및 스토카스틱 디버전스 양적 거래 전략
- RSI와 스토카스틱 퓨전 크로스 전략
- 크립토 빅 모브 스토카스틱 RSI 전략
- 압축 모멘텀 표시기
- 볼링거 밴드 표준 오차 파업 전략
- 전략에 따른 다중 지표 트렌드
- 스크리즈 백테스트 트랜스포머 v2.0
- 피보나치 트렌드 역전 전략
- HTF 지그자그 경로 전략
- 웨이브 트렌드 크로스 레이지 베어 전략
- CCI, DMI, MACD 하이브리드 장기 단기 전략
- AlphaTradingBot 거래 전략
- 베가스 슈퍼 트렌드 강화 전략
- 수량적 거래 전략 수정된 헬스 이동 평균과 Ichimoku Kinko Hyo를 기반으로
- RSI 트렌드 역전 전략
- RSI와 듀얼 EMA 크로스오버 신호 양적 전략
- 엘리엇 파동 이론 4-9 충동 파동 자동 탐지 거래 전략
- 스토카스틱 오시레이터 및 스토카스틱 필터와 함께 이동 평균 크로스오버 전략
- 일내 변동성 거래 전략
- KRK aDa AI 향상과 함께 스토카스틱 느린 평균 반전 전략
- 피보트 포인트 및 기울기 기반의 실시간 트렌드 라인 거래
- EMA23/EMA50 이중 이동 평균 크로스오버 양적 거래 전략
- 수평선 파열과 함께 트렌드 포착 전략
- 다중 취득 전략의 이동 평균 크로스오버
- MACD 골든 크로스와 데스 크로스 전략