G 채널과 EMA를 기반으로 한 양적 장기 단기 전환 전략
저자:차오장, 날짜: 2024-12-20 14:31:56태그:EMAMASMARSIMACD

전반적인 설명
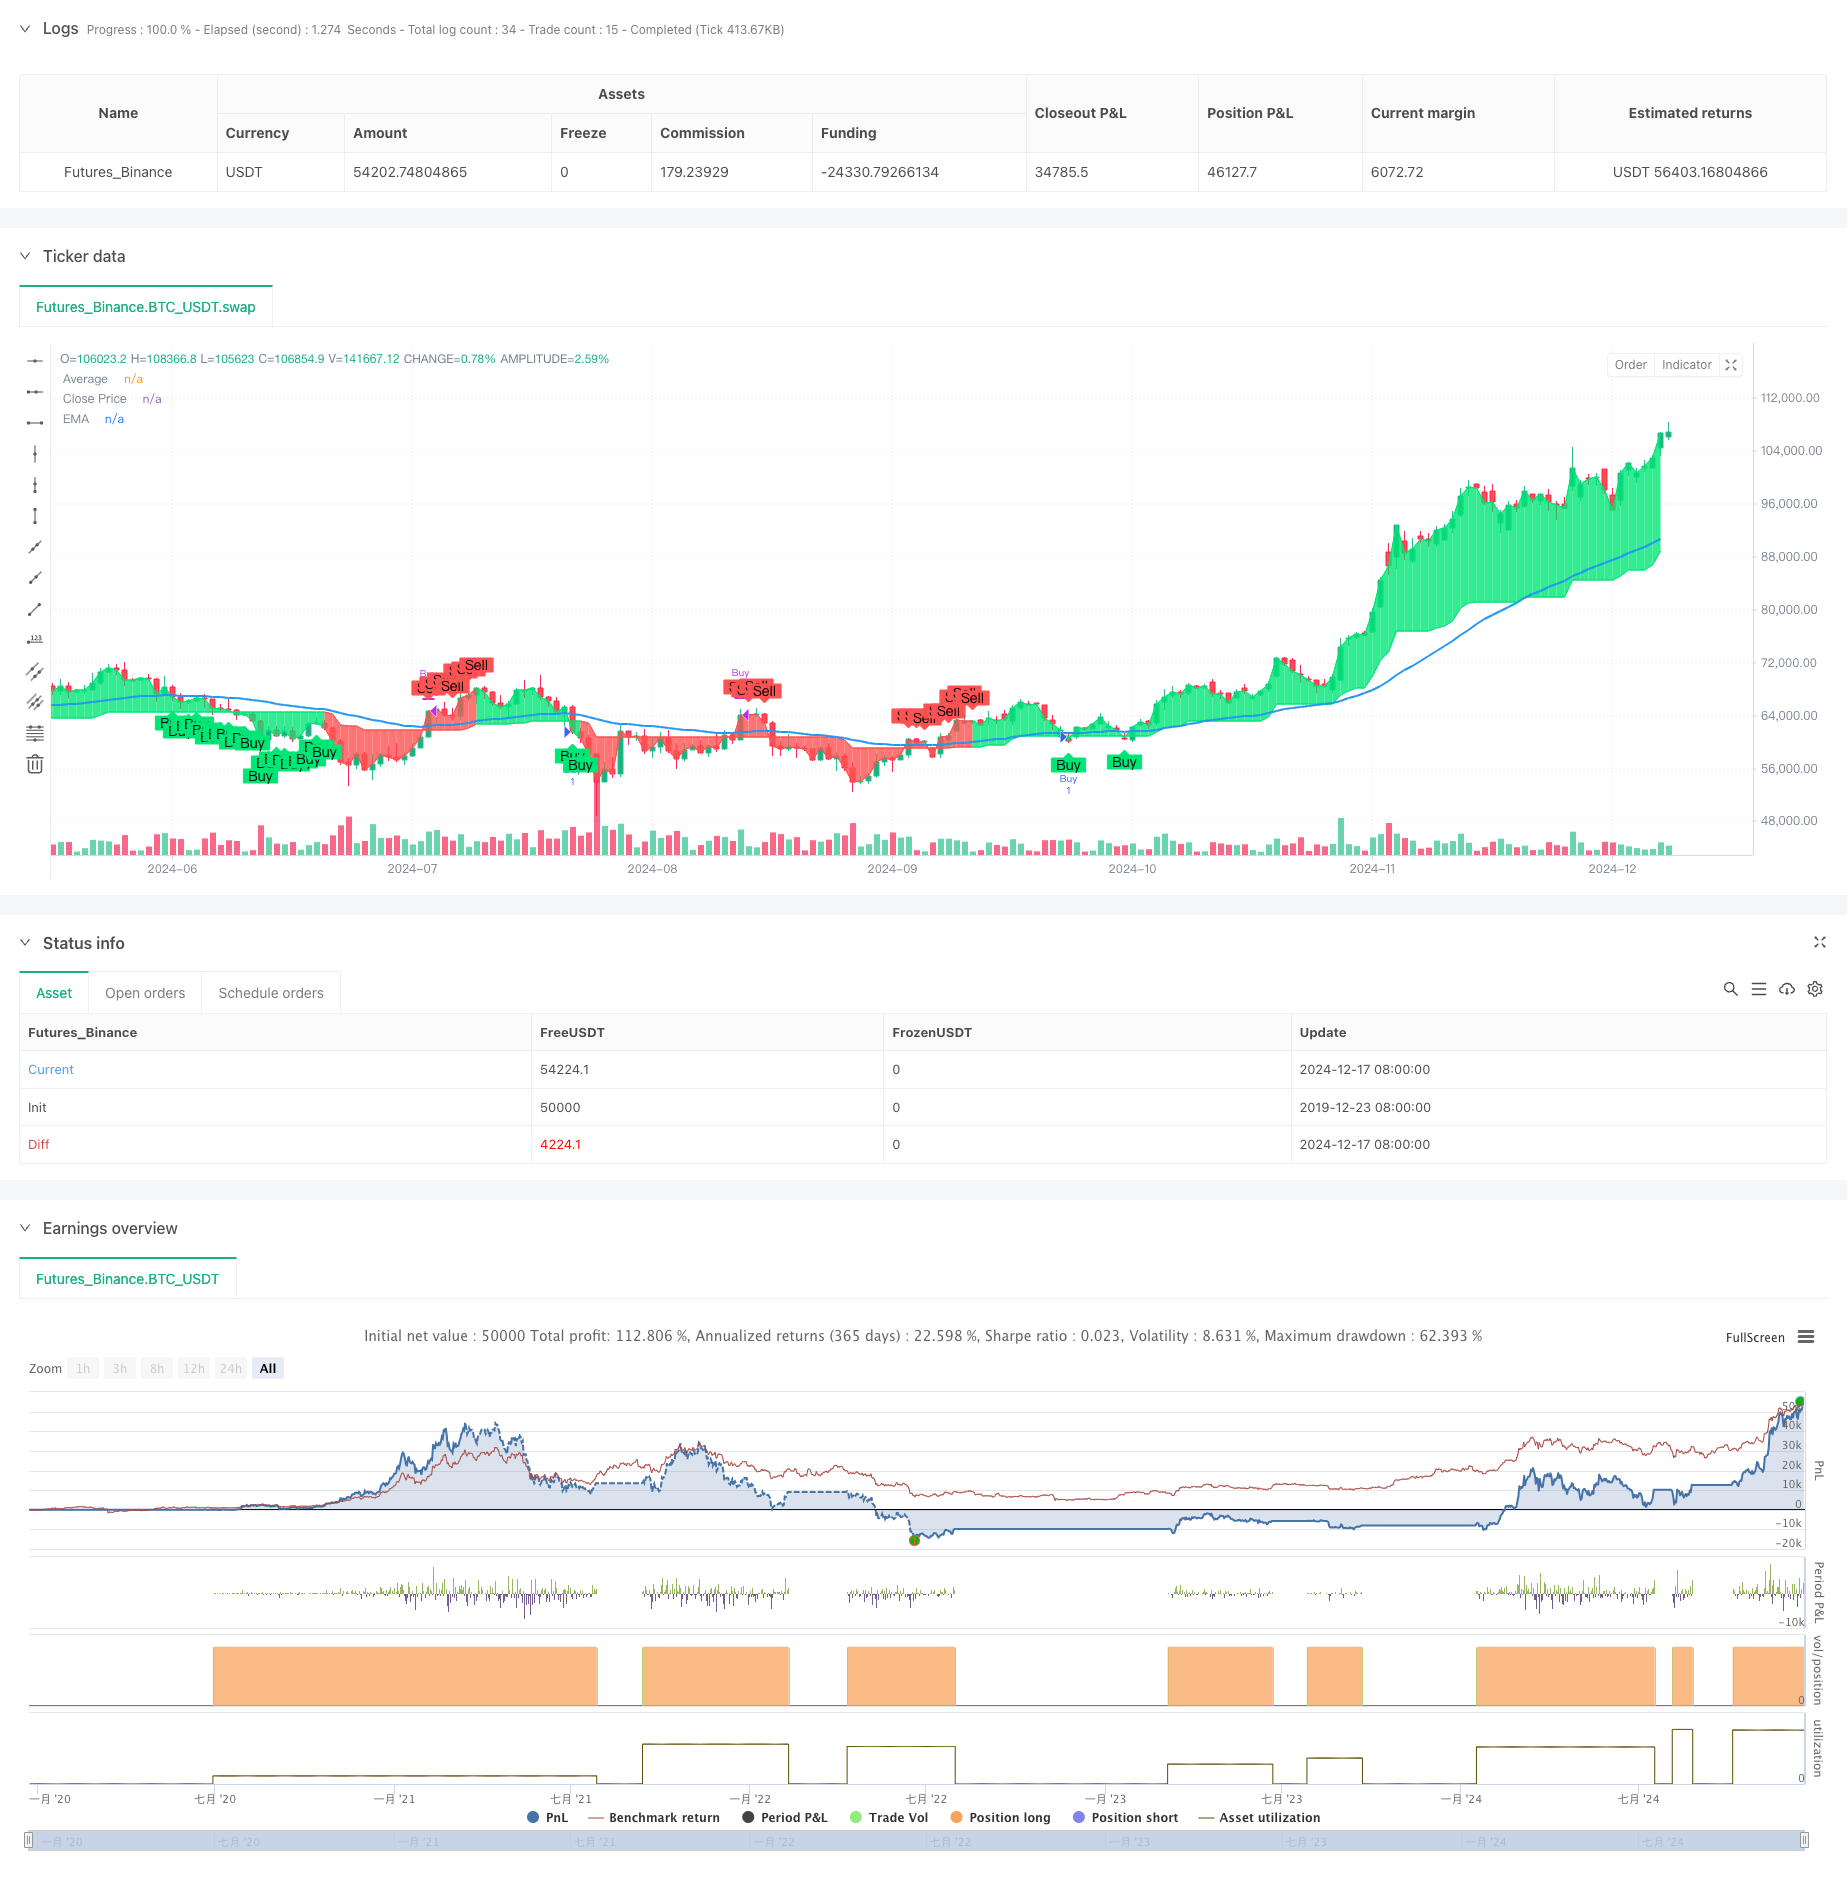
이 전략은 G 채널과 기하급수적인 이동 평균 (EMA) 을 결합한 양적 거래 시스템이다. 핵심 개념은 시그널 확인 및 위험 통제를 위해 EMA를 사용하여 G 채널을 통해 시장 트렌드 방향을 캡처하는 것입니다. 시장 변동으로부터 이익을 창출하는 것을 목표로합니다. 전략은 수동 개입없이 완전히 자동화 모드로 작동합니다.
전략 원칙
이 전략은 G-채널과 EMA라는 두 가지 핵심 지표에 기반하여 작동합니다. G-채널은 상위 및 하위 대역을 동적으로 계산하여 가격이 채널을 통과 할 때 거래 신호를 생성하여 가격 추세를 식별합니다. 구체적으로, 전략은 100 기간 G-채널 계산을 사용하여 수학적 공식을 통해 채널 경계를 지속적으로 업데이트합니다. 또한 50 기간 EMA가 2차 확인으로 도입되며, EMA에 대한 가격
전략적 장점
- 트렌드 추종 및 평균 역전 특성을 결합하여 다양한 시장 조건에서 안정적인 성과를 유지합니다.
- EMA를 보조 확인으로 사용하여 거짓 파기 위험을 효과적으로 줄입니다.
- 감정적 간섭을 피하기 위해 완전히 자동화된 거래를 사용합니다.
- 특징 간단하고 명확한 계산 논리, 이해하기 쉽고 유지
- 다른 시장 특성에 적응하기 위해 강력한 매개 변수 조정성을 제공합니다.
전략 위험
- 오스실레이션 시장에서 빈번한 거래를 초래할 수 있으며 거래 비용을 증가시킬 수 있습니다.
- 잘못된 G 채널 매개 변수 설정은 신호 지연을 초래할 수 있습니다.
- 부적절한 EMA 기간 선택은 중요한 트렌드 전환점을 놓칠 수 있습니다.
- 극심한 시장 변동성 중 상당한 마감 가능성 위험 감축 조치:
- 스톱 로스 메커니즘을 구현
- 매개 변수 구성 최적화
- 시장 환경 필터링 추가
- 합리적인 포지션 관리 전략을 설정
전략 최적화 방향
- 높은 변동성 환경에서 전략 매개 변수를 조정하거나 거래를 중단하기 위해 변동성 지표를 도입합니다.
- 신호 신뢰성을 향상시키기 위해 볼륨 분석을 통합하십시오.
- 약 트렌드 시장에서 빈번한 거래를 피하기 위해 트렌드 강도 필터를 추가합니다.
- 시스템 적응력을 높이기 위해 EMA 매개 변수 적응 메커니즘을 최적화
- 거래 안정성 향상을 위한 여러 시간 프레임 신호 확인 메커니즘 개발
요약
이 전략은 G-채널과 EMA 기술 지표를 결합하여 견고한 양적 거래 시스템을 구축합니다. 전략 논리는 명확하고 구현은 간단하며 좋은 확장성을 제공합니다. 적절한 매개 변수 최적화 및 리스크 제어 조치를 통해 전략은 라이브 거래에서 안정적인 수익을 창출 할 수있는 잠재력을 보여줍니다. 시장 특성에 따라 전략을 최적화하고 라이브 거래에 적용 할 때 위험 관리 프로토콜을 엄격하게 구현하는 것이 좋습니다.
/*backtest
start: 2019-12-23 08:00:00
end: 2024-12-18 08:00:00
period: 1d
basePeriod: 1d
exchanges: [{"eid":"Futures_Binance","currency":"BTC_USDT"}]
*/

// This Pine Script™ code is subject to the terms of the Mozilla Public License 2.0 at https://mozilla.org/MPL/2.0/
// © stanleygao01


//@version=5
strategy('G-Channel with EMA Strategy', overlay=true)

// G-Channel parameters
length = input(100, title='G-Channel Length')
src = input(close, title='Source')

a = 0.0
b = 0.0
a := math.max(src, nz(a[1])) - nz(a[1] - b[1]) / length
b := math.min(src, nz(b[1])) + nz(a[1] - b[1]) / length
avg = math.avg(a, b)

crossup = b[1] < close[1] and b > close
crossdn = a[1] < close[1] and a > close
bullish = ta.barssince(crossdn) <= ta.barssince(crossup)

// EMA parameters
emaLength = input(50, title='EMA Length')
ema = ta.ema(close, emaLength)

// Buy and Sell Conditions
buyCondition = bullish and close < ema
sellCondition = not bullish and close > ema

// Plot G-Channel
c = bullish ? color.lime : color.red
p1 = plot(avg, title='Average', color=c, linewidth=1, transp=90)
p2 = plot(close, title='Close Price', color=c, linewidth=1, transp=100)
fill(p1, p2, color=c, transp=90)

// Plot EMA
plot(ema, title='EMA', color=color.new(color.blue, 0), linewidth=2)

// Strategy Entries and Exits
if buyCondition
    strategy.entry('Buy', strategy.long)
if sellCondition
    strategy.close('Buy')

// Plot Buy/Sell Labels
plotshape(buyCondition, title='Buy Signal', location=location.belowbar, color=color.new(color.lime, 0), style=shape.labelup, text='Buy')
plotshape(sellCondition, title='Sell Signal', location=location.abovebar, color=color.new(color.red, 0), style=shape.labeldown, text='Sell')
관련
- 멀티 전략 기술 분석 거래 시스템
- 다중 시간 프레임 EMA 크로스 높은 수익률 트렌드 전략 (첨단)
- 동적 이중 이동 평균 크로스오버 양적 거래 전략
- 상위 윗부분의 윗부분의 윗부분의 윗부분의 윗부분의
- 엘리엇 파동 이론 4-9 충동 파동 자동 탐지 거래 전략
- 이치모쿠 클라우드 브레이크오웃 및 스톱-러스 시스템과 함께 전략에 따른 다기술 지표 트렌드
- 이중 동적 지표 최적화 전략
- 고급 MACD 동적 트렌드 양적 거래 전략
- MACD 다중 간격 동적 스톱 로스 및 영업 영업 시스템
- RSI, MACD, 볼링거 밴드 및 볼륨 기반의 하이브리드 거래 전략
더 많은
- 다중 지표 동적 스톱 로스 동력 트렌드 거래 전략
- 피보나치 리트레이싱 레벨에 기초한 양적 거래 전략을 따르는 다조건 트렌드
- 거래 전략에 따른 다중 이동 평균 트렌드
- 멀티 필터 트렌드 돌파구 스마트 이동 평균 거래 전략
- 동적 EMA 돌파 및 역전 전략
- G 채널 지표와 동적 트렌드 모멘텀 최적화 전략
- 다단계 ATH 동적 추적 세 가지 항목 전략
- 가만급 변동성 동적 추적 전략이 적용되는 적응형 VWAP 대역
- 다중 지표 추세 옵션 거래 EMA 크로스 전략
- 다중 지표 변동성 거래 RSI-EMA-ATR 전략
- 이중 이동평균 트렌드 위험 관리 전략
- 트리플 슈퍼트렌드 및 볼링거 밴드 다중 지표 트렌드 다음 전략
- 멀티 트렌드 라인 브레이크 모멘텀 양적 전략
- RSI 모멘텀 및 ADX 트렌드 강도에 기반한 자본 관리 시스템
- 다중 시간 프레임 유동성 피보트 핫맵 전략
- ATR 기반의 취득 및 손실 중지 전략에 따른 다중 시간 프레임 트렌드
- 어댑티브 트레일링 스톱과 함께 고급 트렌드 다음 전략
- RSI 모멘텀 필터와 함께 전략에 따른 다기술 지표 트렌드
- 동적 리스크 관리 기하급수적 이동 평균 크로스오버 전략
- 이중 기하급수적 이동 평균 및 상대적 강도 지수 크로스오버 전략