MACD and RSI Multi-Filter Intraday Trading Strategy
Author: ChaoZhang, Date: 2024-06-07 15:20:13Tags: RSIMACDSMA
Overview
This strategy combines MACD (Moving Average Convergence Divergence), RSI (Relative Strength Index), and SMA (Simple Moving Average) to generate reliable buy and sell signals. MACD is used to capture momentum changes in price, RSI is used to identify overbought and oversold conditions, while SMA is used to confirm the trend direction. The strategy employs multiple filters to reduce false signals, providing clear entry and exit points for intraday trading.
Strategy Principles
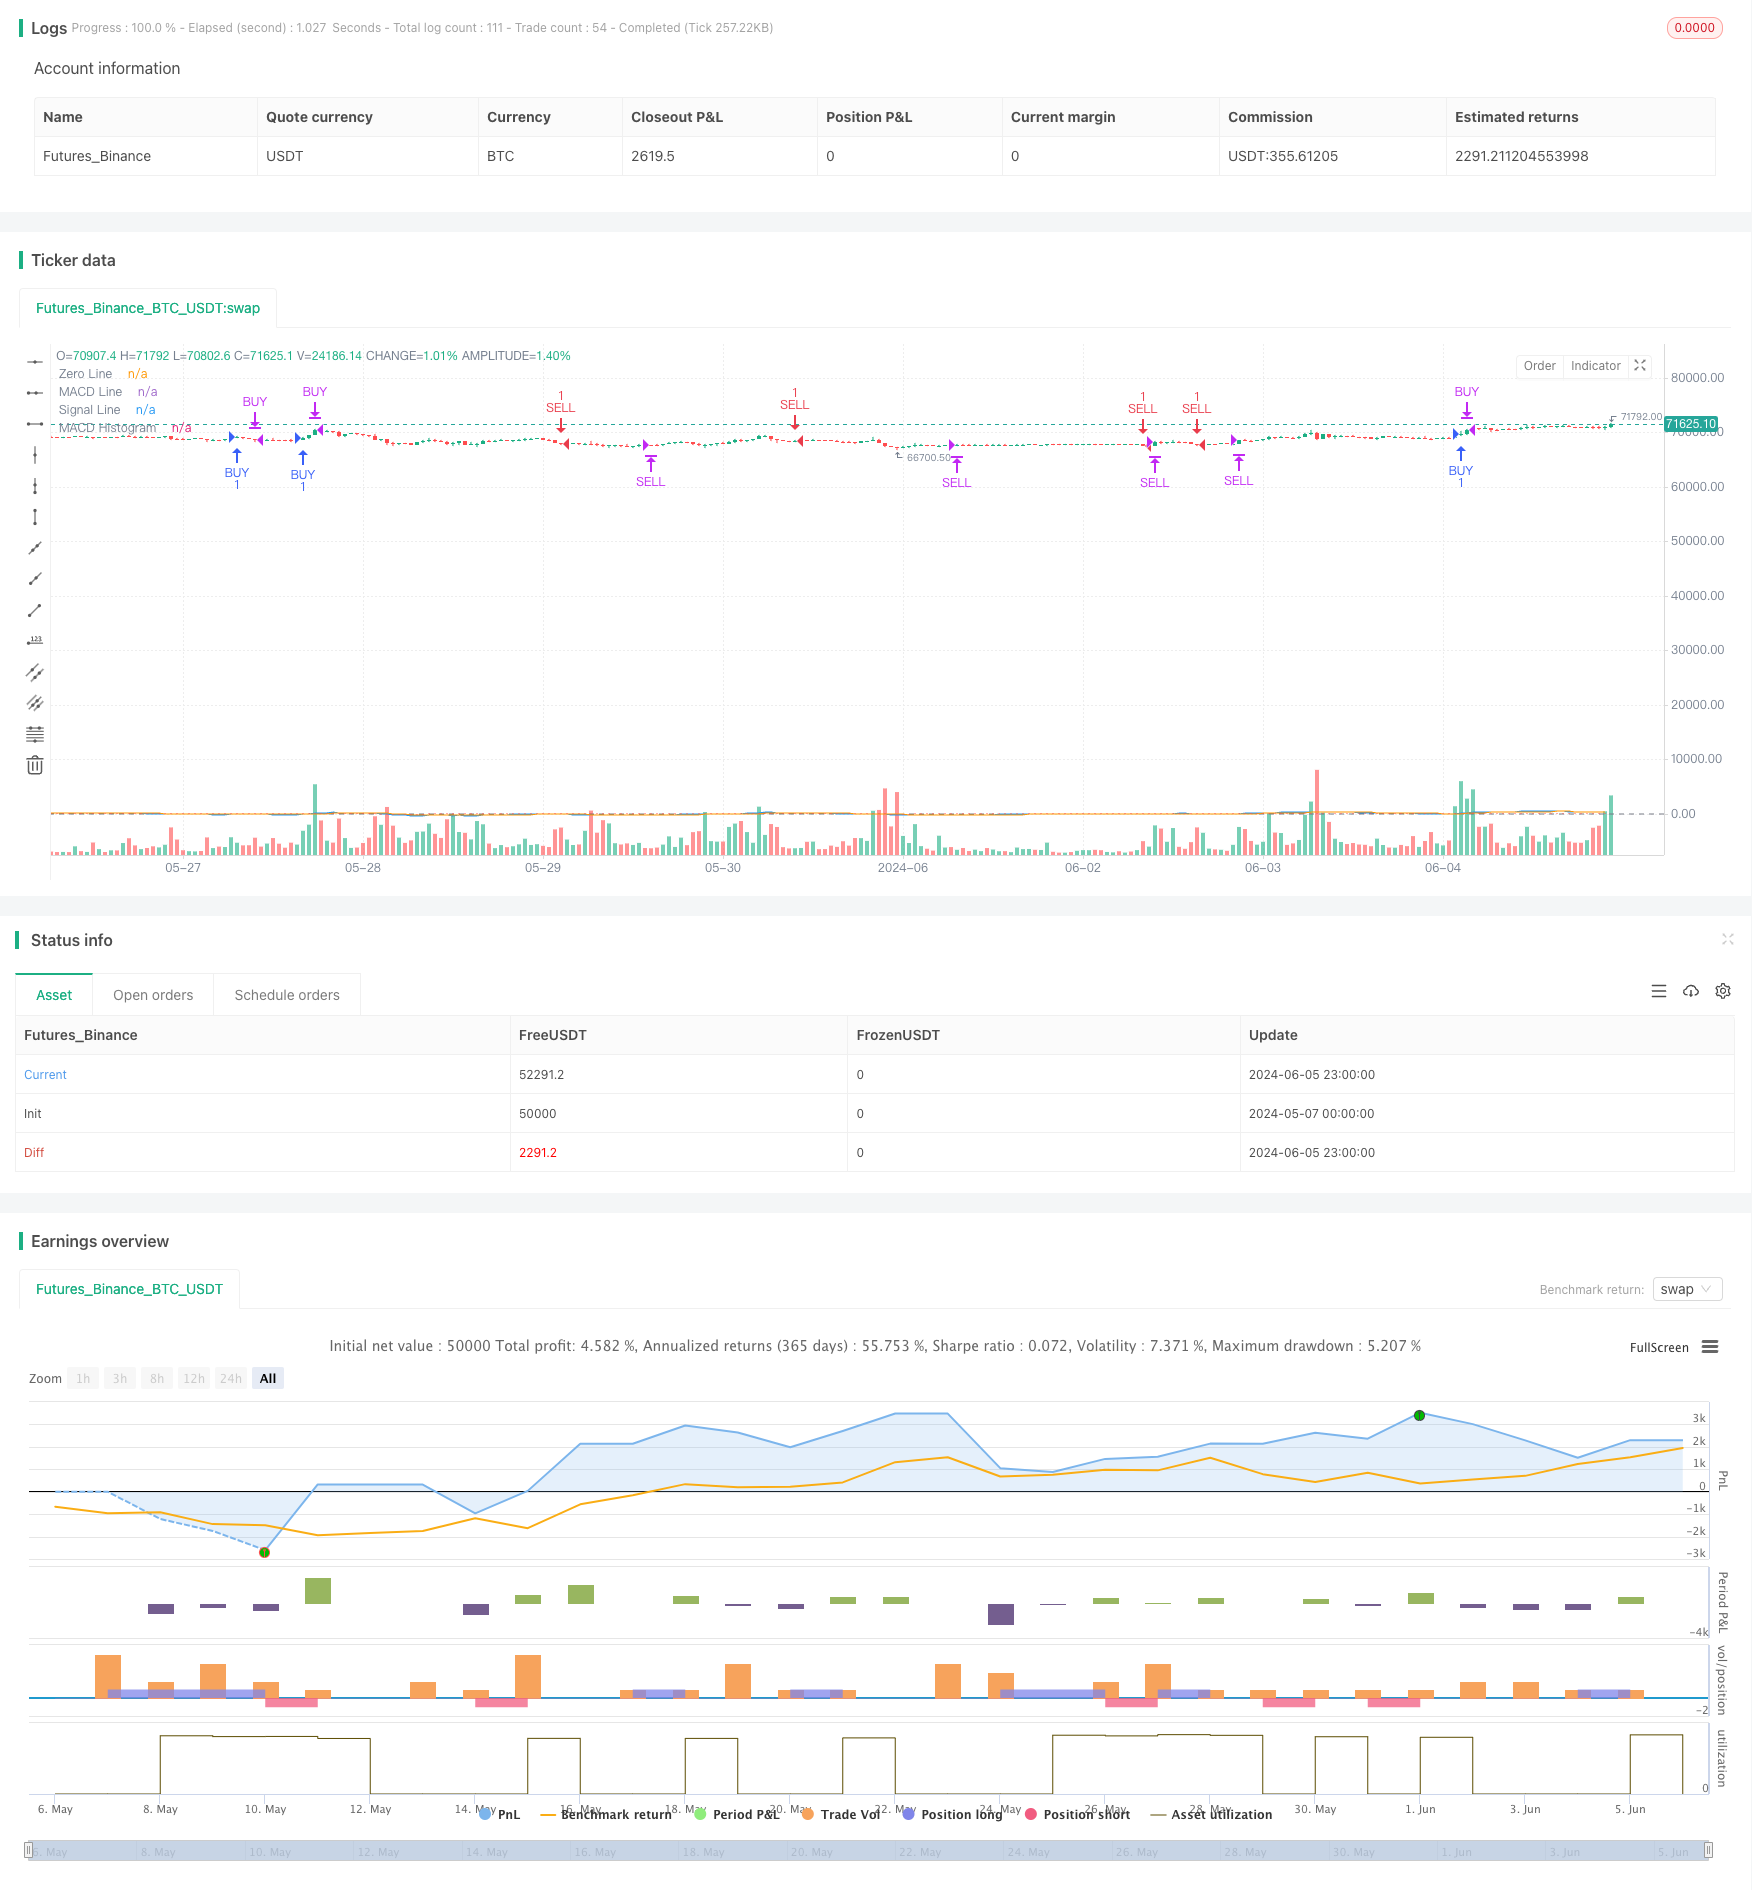
- MACD: A bullish signal is generated when the MACD line crosses above the signal line, and a bearish signal is generated when the MACD line crosses below the signal line.
- RSI: Long positions are only considered when RSI is below the overbought level (70), and short positions are only considered when RSI is above the oversold level (30). This helps avoid entering trades when the market is already overbought or oversold.
- SMA: The 50-period SMA and 200-period SMA are used to confirm the trend direction. A long position is only considered if the 50-period SMA is above the 200-period SMA, and a short position is only considered if the 50-period SMA is below the 200-period SMA.
The entry and exit conditions for the strategy are as follows:
- Long Entry: When the MACD line crosses above the signal line, RSI is below the overbought level (70), and the 50-period SMA is above the 200-period SMA (indicating an uptrend).
- Long Exit: When the MACD line crosses below the signal line or RSI exceeds the overbought level (70).
- Short Entry: When the MACD line crosses below the signal line, RSI is above the oversold level (30), and the 50-period SMA is below the 200-period SMA (indicating a downtrend).
- Short Exit: When the MACD line crosses above the signal line or RSI drops below the oversold level (30).
Strategy Advantages
- The multi-filter mechanism effectively reduces false signals and improves signal reliability.
- By combining momentum and trend confirmation indicators, the strategy seeks high-probability trading opportunities in the direction of the trend.
- Clear entry and exit rules make it easy to implement automated trading and eliminate emotional factors in trading.
- Suitable for intraday trading, the strategy can quickly adapt to market changes and capture short-term trading opportunities.
Strategy Risks
- In choppy markets, the strategy may generate more false signals, leading to frequent trades and capital losses.
- The strategy relies on historical data to optimize parameters, and may require re-optimization when market conditions change significantly.
- Unexpected major positive or negative news may cause prices to break through overbought or oversold levels, and the strategy may miss these trading opportunities.
- The strategy does not set stop-losses, which may expose it to greater risk in extreme market conditions.
Strategy Optimization Directions
- Introduce more filtering conditions, such as trading volume and volatility, to further improve signal reliability.
- Use different parameter combinations for different market states (e.g., trending, ranging) to improve the strategy’s adaptability.
- Set reasonable stop-loss and take-profit levels to control risk and reward for each trade.
- Backtest and forward-test the strategy, continuously optimizing and adjusting parameters to improve its robustness.
Summary
This strategy combines technical indicators such as MACD, RSI, and SMA to form a multi-filter intraday trading strategy. It utilizes changes in momentum and trend to capture trading opportunities while controlling risk through clear entry and exit rules. Although the strategy may face challenges in choppy markets, with further optimization and risk management, it has the potential to become a reliable tool for intraday trading.
/*backtest
start: 2024-05-07 00:00:00
end: 2024-06-06 00:00:00
period: 1h
basePeriod: 15m
exchanges: [{"eid":"Futures_Binance","currency":"BTC_USDT"}]
*/

//@version=5
strategy("Day Trading Strategy", overlay=true)

// Parametrii pentru MACD
macdLength = input.int(12, title="MACD Length")
signalSmoothing = input.int(9, title="MACD Signal Smoothing")
src = input(close, title="Source")

// Calculul MACD
[macdLine, signalLine, _] = ta.macd(src, macdLength, 26, signalSmoothing)
macdHist = macdLine - signalLine

// Parametrii pentru RSI
rsiLength = input.int(14, title="RSI Length")
rsiOverbought = input.int(70, title="RSI Overbought Level")
rsiOversold = input.int(30, title="RSI Oversold Level")

// Calculul RSI
rsi = ta.rsi(src, rsiLength)

// Filtru suplimentar pentru a reduce semnalele false
longFilter = ta.sma(close, 50) > ta.sma(close, 200)
shortFilter = ta.sma(close, 50) < ta.sma(close, 200)

// Conditii de intrare in pozitie long
enterLong = ta.crossover(macdLine, signalLine) and rsi < rsiOverbought and longFilter

// Conditii de iesire din pozitie long
exitLong = ta.crossunder(macdLine, signalLine) or rsi > rsiOverbought

// Conditii de intrare in pozitie short
enterShort = ta.crossunder(macdLine, signalLine) and rsi > rsiOversold and shortFilter

// Conditii de iesire din pozitie short
exitShort = ta.crossover(macdLine, signalLine) or rsi < rsiOversold

// Adaugarea strategiei pentru Strategy Tester
if (enterLong)
    strategy.entry("BUY", strategy.long)
if (exitLong)
    strategy.close("BUY")

if (enterShort)
    strategy.entry("SELL", strategy.short)
if (exitShort)
    strategy.close("SELL")

// Plotarea MACD si Signal Line
plot(macdLine, color=color.blue, title="MACD Line")
plot(signalLine, color=color.orange, title="Signal Line")
hline(0, "Zero Line", color=color.gray)
plot(macdHist, color=color.red, style=plot.style_histogram, title="MACD Histogram")
- Multi-Indicator Probability Threshold Momentum Trend Trading Strategy
- Multi-Indicator Trend Trading System with Momentum Analysis Strategy
- Multi-Period Technical Analysis and Market Sentiment Trading Strategy
- Combined Momentum SMA Crossover Strategy with Market Sentiment and Resistance Level Optimization System
- MACD-RSI Crossover Trend Following Strategy with Bollinger Bands Optimization System
- RSI, MACD, Bollinger Bands and Volume-Based Hybrid Trading Strategy
- Multi-Dimensional Ichimoku Cloud Price Breakthrough Trend Confirmation Trading Strategy
- Dual Momentum Oscillator Smart Timing Trading Strategy
- Dual Moving Average Channel Trend Following Strategy
- Multi-Indicator Trend Following with RSI Overbought/Oversold Quantitative Trading Strategy
- MA, SMA, MA Slope, Trailing Stop Loss, Re-Entry
- TSI Crossover Strategy
- EMA Dual Moving Average Crossover Strategy
- Williams %R Dynamic TP/SL Adjustment Strategy
- RSI Dynamic Drawdown Stop-Loss Strategy
- VWAP Trading Strategy with Volume Anomaly Detection
- Supertrend and EMA Combination Strategy
- TGT Falling Buy Strategy Based on Price Decline
- Dual Trend Strategy with EMA Crossover and RSI Filter
- EMA and Parabolic SAR Combination Strategy
- Price Relationship-based Arbitrage Trading Strategy Between Two Markets
- RSI-based Trading Strategy with Percentage-based Take Profit and Stop Loss
- MACD and Martingale Combination Strategy for Optimized Long Trading
- Elliott Wave Stochastic EMA Strategy
- Bollinger Bands and Moving Average Crossover Strategy
- SMA Dual Moving Average Crossover Strategy
- 10SMA and MACD Dual Trend Following Trading Strategy
- MACD and RSI Combined Natural Trading Strategy
- Dynamic Timeframe High-Low Breakout Strategy
- Dynamic Trend Following Strategy